my comments on comments on the CBO report

STAFF ANALYSIS OF THE CONGRESSIONAL BUDGET OFFICE’S BUDGET AND ECONOMIC OUTLOOK, 2015–2025 “Political differences shouldn’t prevent us from taking bold, decisive action to address America’s dire financial outlook.

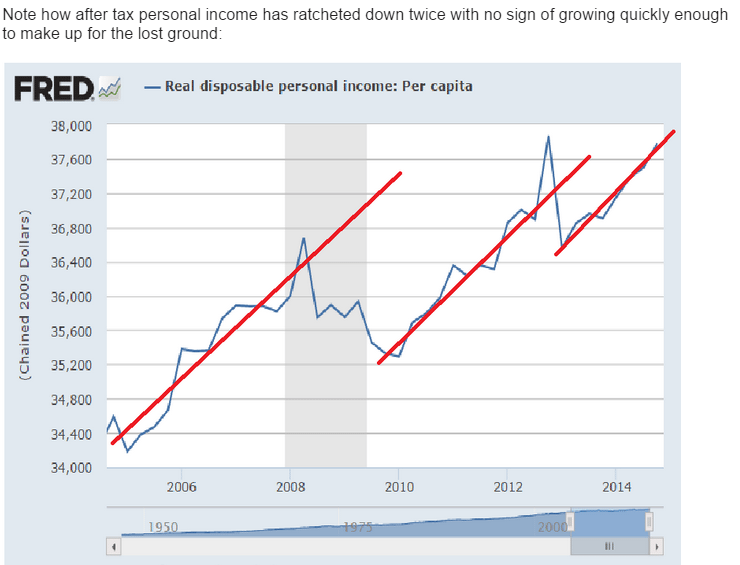
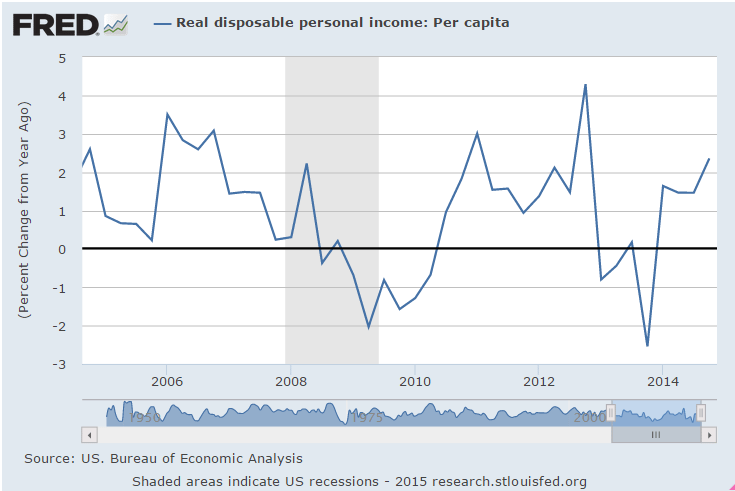
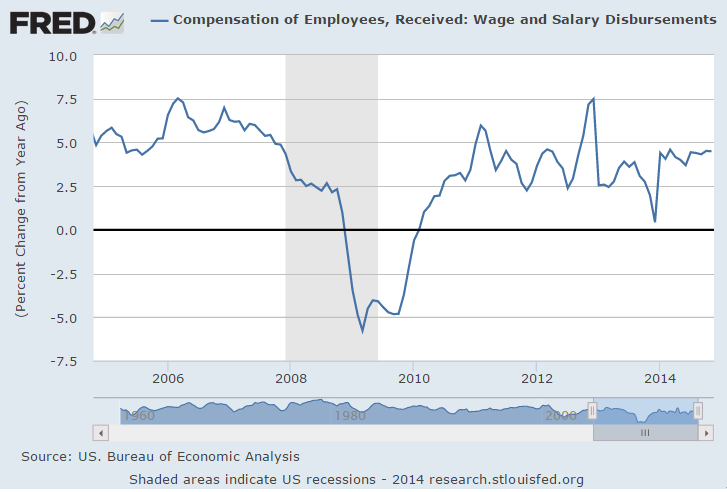
Yes, there is an acute shortage of available desired savings as indicated by the slack in the labor market.

Republicans and Democrats agree that being $18 trillion in debt today and facing the prospect of spending more than $800 billion a year on interest payments alone does not lend itself to a prosperous future for our country.

We don’t agree. A prosperous future is not a function of said forecast interest payments.

CBO’s numbers only reinforce this notion.

To the contrary, the inflation forecast and growth forecast together indicate the deficit forecast is far too low-given current institutional structure- to accommodate the nations savings desires, and as a consequence aggregate demand falls short of full employment levels.

The longer we postpone reforms and put off making tough decisions, the deeper the hole we have to climb out of. Let’s not miss the opportunity before us to start down a new path and address our problems head on.”

I agree, the problem of inadequate aggregate demand should be addressed head on, immediately, and decisively with an immediate fiscal expansion- tax cuts and/or spending increases. There is no time to waste as we are sacrificing yet another generation of young Americans on the alter of failed austerity.

– Chairman Mike Enzi “America remains on a financially unsustainable path that threatens the future stability, security, and prosperity of our economy.

The idea of financial sustainability with a non convertible currency, floating exchange rate policy is entirely inapplicable.
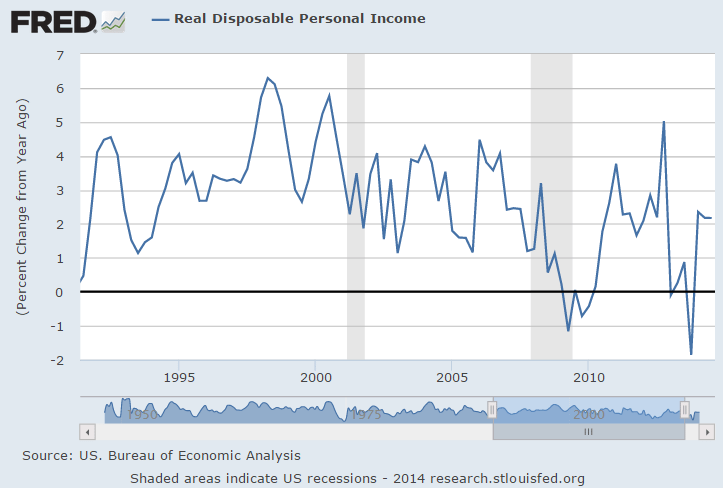
What is threatening the future is a deficit that’s far too small to accommodate our savings desires, as evidenced by the low inflation forecast and the low participation rates.

Interest on the debt alone will consume $5.6 trillion of federal spending over the next decade.

This interest is paid routinely by the Fed by simply crediting the appropriate member bank’s reserve account at the Fed.
There are no grandchildren or taxpayers in sight when this routine accounting entry take place.

We have a duty to prevent a clear and present danger, and that means we must take steps now to balance the budget.” – Sen. Jeff Sessions “The new projections released by the CBO should serve as a stark reminder that our country is on an unsustainable economic path. The longer we wait to act, the more difficult it will become to put in place real reforms to control spending and reduce our over $18 trillion national debt.

It is a fact, not theory, that those $18 trillion of net financial assets held by the global economy as ‘savings’ is far less than the desired net savings as evidenced by the unemployment rates and labor participation rates, and an immediate fiscal expansion- lower taxes and/or higher spending- is in order.

This dangerous level of debt remains a drag on the economy and job growth and will only worsen over time if Washington continues to irresponsibly add to the credit card.” – Sen. Mike Crapo “This latest CBO report indicates that we’re headed down an unsustainable path that will put a damper on economic growth and hurt American workers.

Nothing could be further from the truth. When govt cuts taxes and/or increases spending every professional economic forecaster paid to be right increases his GDP estimate and lowers his unemployment forecast.

When a nonpartisan organization like the CBO says that Americans will pay more taxes yet our deficits will rise, something needs to be done.

Yes, we need an immediate tax cut and/or spending increase.

It’s crucial that we get our spending and deficits under control so we can grow our economy and give job creators the certainty they need to expand and hire more workers.” – Sen. Rob Portman “With $18 trillion in debt and the growth of entitlement programs skyrocketing, it is clear the federal government’s current fiscal path is unsustainable. A sluggish economy makes the problem even worse. CBO has warned that this situation could persist if no action is taken.

True! Without an immediate tax cut and/or spending increase the economy will continue to under employ and under pay the American people.

Controlling debt requires making smart choices on spending as well as enacting policies that encourage stronger economic growth.” – Sen. Roger Wicker “I didn’t come to Washington to sit idly by as lawmakers in both parties pretend the deficit is shrinking and that our national debt is not a concern.

True, he came to Washington with no clue as to the functioning of today’s monetary system.

We have a genuine fiscal crisis on our hands. We’re already handing our kids and grandkids a national debt of over $18 trillion and tens of trillions of dollars of unfunded liabilities for entitlement programs. The latest CBO report shows that the deck is stacked to get even worse.

No, in fact their 2% long term inflation forecast is evidence that the built in spending is insufficient to keep the US running at anywhere near full capacity.

We need a sense of urgency to seriously tackle our national debt because of the threat it poses to our economy and national security. As a member of the Budget Committee, I look forward to working with Senate Budget Chairman Mike Enzi and House Budget Chairman Tom Price in the pursuit of a budget that reflects the tough decisions necessary to eliminate wasteful spending, prioritize our resources, and grow the economy.” – Sen. David PerdueSummary CBO projects that the government will collect $3.2 trillion in revenue and spend $3.7 trillion this year, resulting in a deficit of $468 billion in FY 2015 ($15 billion less than recorded in the prior year). Based on current law, CBO projects that the country’s fiscal situation will remain relatively stable for the next few years. After FY 2019, however, CBO projects steadily increasing levels of deficits, debt, and interest payments. By the last year of the budget window, FY 2025, deficits will again surpass the $1 trillion mark, debt held by the public will reach $21.6 trillion, and a single year’s interest payments will total $827 billion.

And the inflation and employment forecasts show that isn’t nearly enough to be adding to savings to support our economy at full employment levels.

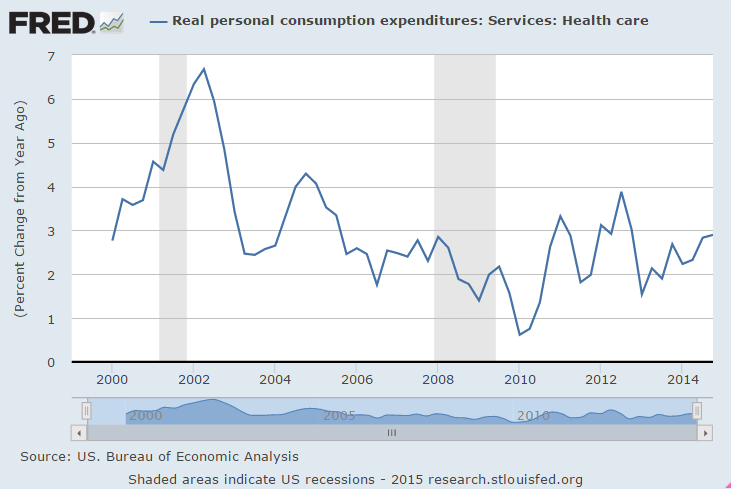
According to CBO, federal outlays will total $3.7 trillion in FY 2015, or 20.3 percent of GDP— slightly higher than the 20.1 percent 50-year historical average. Federal outlays are expected to grow to reach $6.1 trillion, or 22.3 percent of GDP by FY 2025, while revenues are expected to remain steady at about 18 percent of GDP. Spending is projected to increase by 2 percentage points of GDP over the budget window. Mandatory spending (primarily Social Security and health care spending) will account for 1.7 percentage points of the increase; net interest costs will contribute another 1.7 percentage points; and discretionary spending will account for a reduction of 1.4 percentage points. CBO projects federal revenues will total $3.2 trillion in FY 2015, or 17.7 percent of GDP—slightly above the 50-year historical average of 17.4 percent. Under current law, total revenues will rise significantly in 2016 to $3.5 billion (18.4 percent of GDP) due mainly to the expiration of business tax provisions that were allowed to lapse at the end of calendar year 2014. After FY 2016, revenue collections will remain steady at approximately 18.1 percent of GDP throughout the duration of the forecast period. In total, over the 10-year budget horizon (FY 2016–2025), CBO expects the federal government will collect $41.7 trillion in revenue. Deficits Over the period FY 2016–2025, annual spending will outpace tax collections by a cumulative total of $7.6 trillion.For the budget year (FY 2016), CBO projects a deficit of $467 billion. Spending will total $3.9 trillion, while revenues total $3.5 trillion. Deficits will begin to climb after FY 2016, reaching $1.1 trillion by FY 2025. Deficits will remain relatively flat at around 2.5 percent of GDP from FY 2015 through FY 2018 (slightly below the 50-year average of 2.7 percent of GDP), then rise steadily to 4 percent of GDP by FY 2025. Debt And Interest CBO projects that debt held by the public will follow a similar path as deficits, remaining relatively stable at about 74 percent of GDP in the near term and then rapidly growing to nearly 79 percent of GDP by FY 2025. In dollar terms, debt held by the public would increase from $13.4 trillion in FY 2015 to $21.6 trillion in FY 2025, a nearly 62 percent increase. CBO notes that while the federal debt increase over the projected window seems modest, it is already high by historical standards—with debt remaining greater relative to GDP than at any other time since the years immediately following World War II.Gross debt, which includes Treasury securities held by federal trust funds, will also continue to rise according to CBO. By the end of FY 2015, CBO projects a gross debt of $18.5 trillion. This number will grow to $27.3 trillion by the end of FY 2025, an increase of 47.7 percent. Gross debt grows less rapidly than public debt because Social Security begins redeeming bonds at a rapid rate toward the end of the projection period.

Yes, and the 2% inflation forecast indicates all of this fall short of providing the savings needed for our economy to sustain full employment.

According to CBO, carrying these high levels of debt has negative consequences for the federal budget and the U.S. economy, including increased government borrowing crowding out private borrowing and leading to increased costs of borrowing for businesses,

That applies only to fixed exchange rate regimes. It is entirely inapplicable to the US with our floating exchange rate policy, as history has clearly demonstrated.

limits to the ability of the government to respond to crises with tax and spending policies,

Any such limit is by political decision, and not an operational constraint with todays floating exchange rate policy.

and increased interest payments.

Yes, which are simply a credit to a member bank account by the Fed.

The federal government is expected to spend $227 billion on interest payments in FY 2015, or about 1.3 percent of GDP. These interest payments will increase to $827 billion (3 percent of GDP) by FY 2025, an increase of 264 percent. These interest costs, a product of continuing to carry such a high debt burden, will put a strain on federal resources and begin to crowd out other priorities.

Interest payments are a matter of the Fed crediting a member bank account. The notion of a strain on federal resources’ is entirely inapplicable. And, in fact, even with those interest payments inflation is forecast at only 2% indicating there is no forecast of excess spending per se.

Enough???

Visa on consumer spending, GDP, Consumer sentiment, Greece update, Personal income, Employment costs

Visa quantifies impact to consumer spending from lower gas prices (from its earnings call Thurs night) –

US fuel prices are down ~30% since June. The drop amounts to ~$60/month for the avg. consumer according to our survey. Approximately 50% of the savings are being saved, 25% is being used to pay down debt & ~25% is being spent in other discretionary categories including grocery, clothing & restaurants. As we look forward, we would anticipate the savings will accumulate & ultimately we’ll see more spend in the discretionary categories including higher ticket items (i.e. home improvement, electronics, travel and entertainment)

No sign of ‘acceleration’ here but continues to be operating under the previously discussed macro constraint with regard to the need for agents spending more than their incomes to offset those spending less than their incomes in the context of lower federal deficits. Moreover, the drop in oil prices that has led to a drop in capital expenditures removes what had been the marginal support for even the modest growth we’ve been seeing, and not the reversal of data I highlighted previously as subject to reversal, and the Q4 inventory build should reverse in Q1:

GDP
eco-release-1-30-1
Highlights
The advance estimate for fourth quarter GDP growth disappointed with a 2.6 percent figure versus analysts’ estimate of 3.2 percent and following 5.0 percent for the third quarter.

Final sales of domestic product slowed to 1.8 percent, following a 5.0 percent jump in the third quarter. Final sales to domestic purchasers eased to 2.8 percent from 4.1 percent in the third quarter.

The increase in real GDP in the fourth quarter reflected positive contributions from personal consumption expenditures, private inventory investment, exports, nonresidential fixed investment, state and local government spending, and residential fixed investment that were partly offset by a negative contribution from federal government spending. Imports, which are a subtraction in the calculation of GDP, increased.

The deceleration in real GDP growth in the fourth quarter primarily reflected an upturn in imports, a downturn in federal government spending, and decelerations in nonresidential fixed investment and in exports that were partly offset by an upturn in private inventory investment and an acceleration in PCEs. PCE growth posted at 4.3 percent in the fourth quarter versus 3.2 percent the prior quarter. Inventories rose $113.1 billion, compared to $82.2 billion in the third quarter.

On the price front, the chain-weighted price index was unchanged, compared to the1.4 percent rise in the third quarter. Market expectations were for a 1.0 percent gain. The core chain index, excluding food and energy, eased to 0.7 percent from 1.7 percent in the third quarter.

From the BEA:

eco-release-1-30-15

eco-release-1-30-2
The growth of actual $ spent by people in fact grew at a lower rate, reinforcing the narrative that the ‘consumer savings’ was not being spent. But it also further reinforces my narrative that at the macro level there is no net savings, as for every agent spending less there are other agents getting exactly that much less income.

The first chart is the change in actual $ spent:
eco-release-1-30-3
This second chart is adjusted for inflation, indicating the slower growth in actual dollars spent none the less resulted in a faster growth of ‘real’ purchases. Keep in mind, however, the inflation adjustment methodology is necessarily highly problematic at best with quite a bit of volatility in the short term, so Q1 will likely show a similar reduction in the growth of ‘real’ PCE if oil prices stabilize at current levels:
eco-release-1-30-4
eco-release-1-30-5
eco-release-1-30-6
It’s service prices that tend to be ‘sticky’ so they show ‘real’ increases when the price deflator falls, so interesting how the annual growth rate actually came down some:
eco-release-1-30-7
And spending growth on health care remains low enough to not be a political issue:
eco-release-1-30-8
Again, this is one man one vote, not one dollar one vote, and while more people are saving on fuel than are losing income, which is what is driving the chart, the income losses = the income gains:
eco-release-1-30-9
Regarding Greece, I have no idea how this translates into actual policy proposals:

Varoufakis said he had assured Dijsselbloem that Athens planned to implement reforms to make the economy more competitive and have balanced budgets but that it would not accept a “self-fed crisis” of deflation and non-viable debt.

eco-release-1-30-10
Yes, the growth rate is almost about what it was before, but it would have to grow faster to make up for the lost ground shown above.
eco-release-1-30-12
The only cause for alarm is how low this is:

eco-release-1-30-13

eco-release-1-30-14

Brazil

So just maybe the high rates are supporting the inflation?

Brazil Central Bank Signals Further Increase in Interest Rates (WSJ) “Advances achieved in the fight against inflation…aren’t enough yet,” the bank’s monetary-policy committee said in minutes from last week’s meeting, when its policy rate, known as Selic, was raised to 12.25% from 11.75%. The central bank began raising borrowing costs in April 2013, when the Selic stood at a historic low of 7.25% and annual inflation was 6.49%. Brazil’s annual inflation was 6.41% in 2014, above the central bank’s 4.5% target and just below the 6.5% maximum tolerated. The central bank now forecasts a 9.3% increase in controlled prices this year, up from 6% previously. Economic growth, however, will be “below potential” in 2015, the bank said.

Jobless claims, Pending home sales, Danish CB cuts rate to -.5%, comments on Greece, Canada job losses, Shell capex cut, Gasoline and utility demand soft

Jobless Claims 265k, -43k to 15-Year Low in Holiday Week.

This is the lowest level for initial claims since April 15, 2000 when it was 259,000. The previous week’s level was revised up by 1,000 from 307,000 to 308,000. The 4-week moving average was 298,500, a decrease of 8,250 from the previous week’s revised average.

Pending Home Sales Index
pending-home-sales-dec
Highlights
Indications on housing had been turning up — but not after today’s pending home sales index which fell a very steep 3.7 in December. A decline was not expected at all with the result far underneath the Econoday low estimate for plus 0.3 percent. All regions show single digit declines in the month including the two most closely watched regions, the South (down 2.6 percent) and the West (down 4.6 percent).

Final sales of existing homes did pop higher in last week’s report for December but amid a still flat trend. Today’s pending sales report doesn’t point to any improvement, which is a bit of a mystery given how low mortgage rates are and how strong the job market is.

Another CB ‘raises taxes’:

*DANISH CENTRAL BANK CUTS DEPOSIT RATE TO -0.5% FROM -0.35%

Reads like a showdown brewing.

Greece won’t be able to fund itself in euro and will bounce checks without at least implied ECB support. That leaves going back to their own new currency, which carries the usual high risks of mismanagement by leadership that gets in it way over their heads, etc. That is, even with its own currency Greece has been ‘in crisis’ with unemployment, inflation, and interest rates all in double digits along with the corresponding currency depreciation. And it would fundamentally be a ‘strong euro’ bias, as Greek euro debt and bank deposits would likely vanish.

Eurozone May Not Blink First in Confrontation With Greece (WSJ) Alexis Tsipras has been prime minister of Greece for only 48 hours and has done little to back his claim of wanting to keep his country in the eurozone. His strategy appears to be to put himself at the head of a Europe-wide leftist assault against “austerity,” playing to an anti-German gallery in the hope of isolating Berlin. Mr. Tsipras and his finance minister have already been in contact with leftist governments in France and Italy. Madrid is clear that any deal with the Greek leader must be based on reform commitments at least as tough as those demanded of former Prime Minister Antonis Samaras. Anything less would represent a win for Mr. Tsipras and fuel support for Spain’s own new radical leftist party, Podemos.

Greece Moves Quickly to Roll Back Austerity (WSJ) Prime Minister Alexis Tsipras said “our priority is to support the economy, to help it get going again. We are ready to negotiate with our partners in order to reduce debt and find a fair and viable solution.” Government ministers said that the planned sale of the state’s 67% stake in the main port of Piraeus had been halted, that Greece would freeze the planned restructuring and sell off the country’s dominant, state-controlled utility company, and that the government would reverse some of the thousands of layoffs imposed as part of the bailout. Labor Minister Panos Skourletis also said that an increase to Greece’s basic wage will be among the first bills the government will submit to parliament.

Oil capex cuts continue:

Canada December Job Losses Deeper After Revisions (WSJ) The Canadian economy shed 11,300 net jobs last month instead of the 4,300 decline reported earlier in January, Statistics Canada said. December’s jobless rate was 6.7%, compared with the previously estimated 6.6%. Adjusted to U.S. concepts, the jobless rate was 5.7% last month, compared with 5.6% south of the border, Statistics Canada said. Net job creation in Canada for all of 2014 totaled 121,300 positions, the lowest level since the country posted a net loss in jobs in 2009, at the height of the global recession.

Shell oil:

The $15 billion spending cut, which will involve cancelling and deferring projects through 2017, which would represent a 14 percent cut per year from 2014 capital investment of $35 billion.

Reflecting the new oil price environment, Shell, having said in October it would keep its 2015 spending unchanged, announced it would have to cut what is one of the largest capital investment programmes in the industry.

“Shell is considering further reductions to capital spending should the evolving market outlook warrant that step, but is aiming to retain growth potential for the medium term,” it said in a statement.

No sign yet of US gasoline or electric consumption materially increasing:

pce-gas-elec

ip-elec-gas

ECB, Jobless Claims, Sea Container Counts, Housing Starts, Purchase apps, Architecture Billings, miles driven, Redbook sales, my take on consequences of $50 oil

Like the carpenter with the piece of wood “no matter how much I cut off it’s still too short”

Draghi has yet to realize rate cuts/QE/etc. are a deflationary/contractionary bias:

*DRAGHI SAYS WILL BUY UNTIL SEE SUSTAINED INFLATION IMPROVEMENT

Jobless Claims
claims-1-17
Highlights
Jobless claims have been inching higher and are not pointing to increasing strength for the January employment report. Initial claims did fall 10,000 in the January 17 week but to a 307,000 level that is just outside the high end of the Econoday consensus range (289,000 to 305,000).

The January 17 week is the sample week for the monthly employment report and a comparison with the December sample week shows a sizable 18,000 increase. The current 4-week average at 306,500 is up 6,500 from the prior week for the highest reading since way back in July. A sample-week to sample-week comparison for the average shows a 7,750 increase this month.

Continuing claims, which are reported with a 1-week lag, have also been on the increase. Continuing claims for the January 10 week rose 15,000 to 2.443 million with the 4-week average up 9,000 to 2.427 million. This average has also been on the rise and is up 8,000 from the month-ago comparison. The unemployment rate for insured workers is unchanged at 1.8 percent.
claims-1-17-graph

December 2014 Sea Container Counts Continue to Show Softness in Trade

By Steven Hansen

Export container counts continue to weaken, which is usually awarning that the global economy is slowing. Export three month rolling averages continue to decelerate – being in negative territory year-over-year. However, there are serious labor issues at all West Coast ports, and it is hard to understand the effect on the container counts. One should also consider that exports have been decelerating most of 2014 – well before the labor disputes.
containers

Housing Starts
starts-dec
starts-dec-graph

Permits lead housing:
permits-dec

MBA Purchase Applications
mba-apps-1-16
mba-apps-1-16-graph

private-permits
This isn’t going anywhere:
architecture-billings-index-dec
Miles driving per capital even worse than this:
miles-driven

This isn’t supposed to be soft with the consumer saving so much on gas and oil:
red-book-1-17
So here’s the latest ‘back of the envelope’ mainstream take on oil:

Consumer saves $200 billion, but
Capex down by $100 billion =
Unambiguous Net Gain of $100 billion

Except they all left out the fact that if the consumer is saving $200 billion other agents are losing $200 billion of income.

And that foreign capex that totaled over $500 billion in 2014 is being cut back as well, with some of those cutbacks translating into reduced US exports.

Not to mention the US consumer only spends part of that $200 billion saved, and what is spent on imports doesn’t add to US GDP.

So my back of the envelope remains:

Consumers who save $200 billion spend only $120 billion on domestic output. Agents who lose $200 billion of income cut spending on domestic output by $120 billion That all nets to 0, consistent with weak December retail sales, for example.

Additionally, US capex falls $100 billion, and US exports fall $50 billion, both also supported by recent data releases.

Therefore $50 oil is an unambiguous negative for the US economy.

Jobs, Philly Fed

This tick up might mean nothing,
but could also be the start of a move up due to the fall off in oil capital expenditures:

Jobless Claims
claims-1-10
Highlights
Jobless claims jumped sharply in the January 10 week, up 19,000 to a 316,000 level that’s the highest since September. The 4-week average is up 6,750 to 298,000 which is about even with the month-ago comparison.
claims-1-10-graph

This tick down might mean nothing, but could also be the start of a move down due to the fall off in oil capital expenditures:

Philadelphia Fed Survey
philly-jan
Highlights
Abrupt slowing is the signal from the manufacturing report of the Philly Fed whose general conditions index for January fell to plus 6.3 from December’s plus 24.3 (revised from 24.5). Growth in new orders, however, does remain solid at plus 8.5 though down from December’s plus 13.6. The 6-month general outlook also is a positive, at a very strong 50.9 vs December’s 50.4.

Now the weak readings led by shipments, which are in contraction at minus 6.9 vs December’s plus 15.1, and employment, now also in contraction at minus 2.0 vs December’s plus 8.4. Unfilled orders also are in the negative column, at minus 8.6 vs plus 2.7 in December. Price readings are soft with input price inflation moderating further and output prices now in modest contraction.
ism-dec
Empire did a bit better.

This came out before the Philly Fed 6.3 print so add that last data point to the red line on the chart:
emp-vs-philly

Brazil inflation

Maybe somehow the higher interest rates set by the CB support the higher rates of inflation?

;)
Brazil’s Inflation Rises Even Amid Low Growth (WSJ) Brazil’s official IPCA consumer-price index rose 6.41% in 2014. The IPCA rose 5.91% in 2013. Annual inflation was driven up by an 8% increase in food prices and a 8.8% surge in housing-related prices. Inflation also accelerated in December, with the IPCA rising 0.78% versus 0.51% rise in November. The central bank raised its benchmark interest rate, called Selic, to 11.75% in December, the latest in a series of increases since April 2013, when the rate was 7.25%. The Central Bank of Brazil has a tolerance band for annual inflation of between 2.5% and 6.5%.

Kelton story in Forbes, attribution

Confused, of course, but in the news!

Watch Out, MMT’s About, As Bernie Sanders Hires Stephanie Kelton

By Tom Worstall

Jan 12 (Forbes) — The idea that Modern Monetary Theory might actually become vaguely mainstream, even an influence on how the Republic is governed, entirely petrifies me. It’s not actually that I disagree very much with the economics that is being laid out in MMT: indeed, I’m terribly tempted to agree that they’re actually correct in much of what they say. Rather, it’s what it will do to the political process if they do gain real policy influence. For at present there does have to be some link, however vague or tenuous, between how much money the government takes in from all of us and how much money the government spends on giving prizes to all. The basic innovation of MMT is to point out that this no longer has to be so: and that’s simply not a tool that I want politicians of any stripe to have available to them.

Dylan Matthews has the story that has me hot and bothered:

President Obama’s biggest problem in the Senate is obviously its new Republican majority, but opposition from the left wing of the Democratic caucus appears to be growing too. Most prominently, Sen. Elizabeth Warren (D-MA) has clashed with the White House on a key Treasury Department position and the CRomnibus spending package. But new budget committee ranking member Sen. Bernie Sanders (I-VT) is poised to break dramatically from traditional Democratic views on budgeting, from Obama to Clinton to Walter Mondale and beyond.

His big move: naming University of Missouri – Kansas City professor Stephanie Kelton as his chief economist. Kelton is not exactly a household name, but to those who follow economic policy debates closely, tapping her is a dramatic sign.

If you want all of the grubby details of MMT then I recommend that piece and those it links to. I’ll just give a pencil sketch here.

It’s most certainly not obvious that MMT proponents are all barking mad or anything. Jamie Galbraith (who I’ve had one or two very limited interactions with) is certainly a reasonable guy. And his insistence that a budget surplus, despite the ribbing he gets about it, is in fact economically contractionary doesn’t seem to have anything wrong with it. Budget deficits are fiscally expansive, a surplus is fiscally contractionary, if there’s any one statement at the heart of Keynesianism that’s it. I might differ on the desirability of a surplus at times but not on that basic point about one being contractionary. My disagreement being that the old standard Keynesianism was based on the idea that at times we want the government to be contractionary. Not as a means of paying down the debt or anything but as just general good management of the economy. Sure, let’s add to aggregate demand in a slump but the flip side of that coin is that in the boom we want to temper things. Just as the old complaint about central banking goes (“the central banker’s job is to remove the punch bowl just as the party gets going” by raising interest rates) a budget surplus is the fiscal equivalent, just part of moderating both the booms and busts to which capitalism is prone.

So I’m certainly not thinking that the MMTers are over there with David Icke and whispering about the Grey Aliens or anything.

And their basic outline about money creation is true as far as I can see. If you’re a country with your own central bank you can print as much money as you like. And sure, you could indeed finance government just by printing more money. Print money, spend it, hey presto, you’ve financed government. Standard monetary theory also recognises this: we know that the Fed makes a pretty profit each year from printing Benjamins (20 cents of paper and 3 cents of ink really is worth $100 these days) and that’s worth perhaps $20 billion a year to the US government in seignorage. We really don’t complain about it either. That standard monetary theory then also says that doing too much of this (in more detail, printing or creating lots of base money, rather than the creation of credit in the manner that the banking system does) will be highly inflationary. Standard theory points to Wiemar Germany, post WWII Hungary and modern Zimbabwe as examples (that last so fun that the end series of banknotes were only printed on one side as they didn’t have enough “real money” left to buy ink).

At which point the MMT crowd say ah, but yes, that’s what taxes are for. Print the money, spend it, thereby injecting it into the economy, and if inflation rises then taxes are what sucks that money back out of the economy and thus kills off the inflation. And it’s that bit that absolutely terrifies me. The effect that idea has on the incentives for politicians.

Given that we are discussing monetary policy it seems appropriate to bring Milton Friedman in here. And he pointed out that if you ever have a chance to cut taxes just do so. On the basis that politicians, any group of politicians, will spend the bottom out of the Treasury and more however much there is. So, the only way to stop ever increasing amounts of the the entire economy flowing through government is simply to constrain the resources they can get their sticky little mits on. We could, for example, possibly imagine a Republican from the Neanderthal wing of the party arguing that what the US really needs is another 7 carrier battle groups. And one from the even more confused than usual Progressive end of the Democratic Party arguing that each college student needs her own personal carrier battle group to protect her from the microaggressions of being asked out for a coffee. You know. Sometime. Maybe. If you want to?

A Mea Culpa and Some Comments on MMT and Fiat Currency Economics

By Warwick Smith

Jan 12 — It has recently been pointed out to me that some of my writing on monetary economics has not given proper attribution to the intellectual tradition behind the ideas that I present and that this gives the impression that these are my ideas. I’m embarrassed to admit that the criticisms are spot on and I have made a major misjudgement in how I wrote these articles (one in The Conversation and one in The Guardian). I had no intention of stealing other peoples ideas but, nevertheless, this is in effect what I did. I apologise unreservedly to those who may have felt aggrieved by my actions.

I have a history in public policy activism and I have approached my recent popular political and economic writing somewhat from an activist standpoint where I viewed the main game as advocating and causing public policy change and increasing public awareness. The branch of monetary economics known as modern monetary theory (MMT) has something of an activist element to it where a minority who hold an accurate view of how things are and, perhaps to a lesser extent, how things should be, are vying for airtime against the overwhelming majority who hold (or at least communicate) a false perspective on monetary economics and public finance.

I thought that I could add a new voice and a new strategy to that struggle by simply writing about monetary economics from an MMT perspective but as if it’s just the uncontroversial (among economists) truth about monetary economics rather than a minority view among economists. I think the complexities of intra-discipline disagreement are impenetrable for newcomers and will put most people off investing the effort to understand the arguments.

Taking this line of thinking led me to make a serious misjudgement in what I wrote and how I wrote it because MMT is more an intellectual and academic discipline than it is an activist movement and, as such, people’s careers and their professional profiles are at stake. Again, I apologise to the people whose work has inspired some of my writing who have not been properly acknowledged including Warren Mosler, Perry Mehrling, Bill Mitchell and Steven Hail.

I wrote to the Guardian editors requesting a couple of additions. They agreed to add attribution to a line early in the article that credits Warren Mosler but not to make further edits post-publication. I’m a strong believer in owning up to mistakes and trying to remedy them when others are affected.

I believe MMT faces serious challenges in part because of its name and the way it is usually presented. A better name would be something like Fiat Currency Economics because MMT is not a theory but is primarily just a description of reality and the clear consequences that flow from that reality. No economist that I’ve found has any clear and well reasoned refutation of MMT to offer. All attempts at refutation appear to rely on misunderstandings or misrepresentations. This is why I took the approach of not referring to MMT at all in the pieces that I wrote. Nevertheless, I still should have referred to the people whose work contributed to or provided the ideas for the articles and I greatly regret that I did not. I promise I will not make this mistake again.

Below is a list in rough descending order of significance with respect to influencing my views on monetary economics.

Perry Mehrling’s Coursera course The Economics of Money and Banking
Warren Mosler’s book The Seven Deadly Frauds of Economic Policy
Various presentation given by Steven Hail
University of Newcastle’s CofFEE report on the Job Guarantee
Professor Bill Mitchell’s blog – this is the most comprehensive of the sources here but it’s low on my list because I came to it quite late in the formative period of my thinking on money and finance.

Jobs, Wages, Wholesale trade

Employment Situation
payrolls-dec
Highlights
The December employment situation was somewhat stronger than expected at the headline level but the payroll numbers softened. In terms of actual numbers, the report was mixed.

Payroll jobs advanced 252,000 after jumping a revised 353,000 in November. Analysts projected a 245,000 gain. October and November were revised up notably by a net 50,000. The unemployment rate decreased to 5.6 percent from 5.8 percent in November. Expectations were for 5.7 percent. Wages actually fell back for the latest month.

Going back to the payroll report, private payrolls increased 240,000 after rising 345,000 in November. Expectations were for 238,000.

Goods-producing jobs jumped in December, led by construction which advanced 67,000 in December after a 20,000 increase the month before. Manufacturing employment increased 17,000, following a jump of 29,000 in November. Mining rose 3,000 in December, following a 1,000 boost the prior month.

Private service-providing jobs gained 173,000 after a 294,000 jump in October. The latest increase was led by professional & business services. Government jobs increased 12,000 after rising 8,000 in November.

Average hourly earnings slipped 0.2 percent in December after gaining 0.2 percent the prior month. Expectations were for a 0.2 percent rise. Average weekly hours were unchanged at 34.6 hours and matched expectations.

The December jobs report was mixed. Payroll gains beat expectations but slowed from November. Wage growth softened. The unemployment rate dipped but partially on a lower participation rate. Still, the labor market is showing overall improvement. However, today’s numbers will only increase debate within the Fed on just how strong or soft the labor market really is.

This chart takes out the ‘demographics’ by looking only at 24-55 year old Americans.

It shows how ‘the problem’ remains a massive shortage of aggregate demand:

payrolls-dec-graph

Not long ago the mainstream raised the alarm that average hourly earnings were ‘accelerating’ and when this happens it doesn’t stop for an average of 4 years, so the Fed better hike now to avoid a serious inflation problem. When I suggested it might roll over this time as it did in 2003, that notions was immediately dismissed:
earnings-dec-1
Maybe higher paying energy jobs being replaced with lower paying fast food, retail, education, and healthcare types of jobs?
earnings-dec-2

Wholesale Trade
trade-nov
Inventories look a bit heavy in the wholesale sector, up 0.8 percent in November vs a 0.3 percent decline in sales that lifts the stock-to-sales ratio to 1.21 from October’s 1.20 and compared to 1.19 in September. Weak sales made for unwanted inventory builds in metals, chemicals, lumber, machinery and farm products.

The nation’s inventories have been steady though today’s report does hint at slowing demand going into year end. Watch for the final data on November inventories in Wednesday’s business inventories report.

I’m suspecting US exports are in the process of declining due to the lower oil price and the weak global economy. Oil producers both have less to spend due to falling revenues and they will also reduce capital expenditures that are no longer profitable.

And while ‘global consumers’ will have more to spend due to falling fuel costs, seems to me that nations other than the US will benefit from that type of spending.

You can see how US exports have rolled over recently:
exports-nov-1

Year over year growth is now near 0:
exports-nov-2

To the point of ‘bad inflation’ in Japan:

Japanese People Feel Their Lives Are Worse Off

Jan 8 (WSJ) — A Bank of Japan survey of more than 2,000 people found that falling real incomes and rising prices have made people feel worse off than at any time in the past three years. About 51% said the comfort of their life has diminished over the past year, while just 4% felt life was getting better. The differential, about 47 percentage points, was the worst level since December 2011, the central bank said. Respondents to the survey also tended to be pessimistic about the year ahead. Nearly 38% said they thought the economy would get worse over the next year. In the previous poll, taken in September 2014, only about 32% thought that. And more than half of respondents said they believed growth in the future would be lower than it is now.

not much here to spook the Fed

fed-1

fed-2

This was up 7.2% for Q3 from Q2 and should revert:
fed-3
Exports of goods were up 7.5% and should revert:

(this chart hasn’t been updated today but it’s very close)
fed-4

Near stall speed through Q3:
fed-5

The monthly number just reported a blip up but the growth rate remains low and slowing, and it looks a lot worse when you take out the top 1% of course:
fed-6

This is from the Dec 5 release:
fed-7

fed-8

This is the release from earlier today.
(These are not inflation adjusted):
fed-9