Greece reading IOU’s to pay public sector workers

Yes, this is viable operationally, as it going back to drachma.

However, there’s a lot that can go wrong, as demonstrated by prior episodes of inflation, high interest rates, high unemployment, and currency depreciation.

Not to mention the temptation of the channels of mass corruption also too often employed in the past by local leaders, which will be an immediate consideration at the referendum.

Greek pension funds ration payouts

(FT) — Haris Theoharis, formerly the head of Greece’s independent revenue collection office, said the government was preparing to issue IOUs next month to pay more than 600,000 public sector workers as a first step towards readopting the drachma.

He said a team from the national accounts office at the finance ministry was working on a “drachma plan” at the office of prime minister Alexis Tsipras.

“The first stage is to replace euros with IOUs that could be sold at a discount, for example, and used to pay taxes,” Mr Theoharis told the FT. “It would take several months to implement the return of the drachma.”

A government spokesman denied the existence of such a team.

existing home sales, Greece and China comments

So after cheering the big jump last month to 112.4, it gets revised down to only 111.6, so the lower than expected print of 112.6 vs 113 expected is now hailed as a larger than expected increase from last month, as the shameless cheer leading continues:

United States : Pending Home Sales Index
er-6-29-1
Highlights
Solid momentum is building inside the housing market based on the ongoing run of very strong data including today’s pending home sales index which is up a better-than-expected 0.9 percent in the May report which tops Econoday expectations for a 0.6 percent gain. The index level, at 112.6, is as high as it’s been since the bubble days of 2006.

Sales have been very strong in the West where pending sales rose 2.2 percent in May for a 13.0 percent year-on-year gain. Pending sales in the South, up 10.6 percent year-on-year, have also been strong though the region did dip 0.8 percent in the latest month. Sales also dipped in the Midwest, down 0.6 percent for a year-on-year plus 7.8 percent, but they rose sharply in the Northeast where housing after a heavy winter is bouncing back strongly, up 6.3 percent in this report for a year-on-year again of 10.6 percent.

Today’s report points to further strength for the existing home sales report which surged in data posted last week. Housing is getting a boost from the strong jobs market together perhaps with the prospect of rising mortgage rates which may be pushing buyers into the market. Watch for Case-Shiller home price data on tomorrow’s calendar.

Year over year % change, as the absolute number remains depressed:
er-6-29-2
Pending home sales index- only back to previous highs of what was also a depressed market:
er-6-29-3

NAR: Pending Home Sales Index increased 0.9% in May, up 10% year-over-year

By Bill McBride

So after reading this and a few other articles it seems they think a ‘run on the banks’ somehow removes euro that could otherwise be used to pay creditors. This implies either some kind of plan to tax bank deposits to pay creditors or just the continued evidence of gross ignorance of their own monetary system. In any case seems the most likely outcome is a yes vote for the troika plan which gives the leadership the desired political cover to go ahead and sign it and move on and remain the European citizens in good standing they’ve always been…

And this would also be yet another victory for the ongoing deflationary policies, this time being spun as explicit support from the people, proving once again that populations dislike inflation even more than they dislike unemployment. This means the focused pursuit of a trade surplus is intact, and I’ve yet to see a currency with a persistent trade surplus and a weak currency:
er-6-29-4

Greece Bailout: Eurozone Ministers to Explore ‘Plan B’ (WSJ) The first step in what has commonly been referred to as “Plan B” among Greece’s creditors would likely be the introduction of capital controls to avoid a run on the country’s banks. But in comparison to Cyprus, which implemented capital controls as part of a €10 billion bailout package from the eurozone and the International Monetary Fund, the financial situation of the Greek government is much more precarious. The eurozone portion of Greece’s €245 billion rescue package runs out on Tuesday, the same day the government has to pay €1.55 billion to the IMF.

Doing the same thing over and over again and expecting different results…

China cuts reserve ratio, interest rates to bolster growth (Xinhua) The central bank cut the RRR for commercial banks serving rural areas, agriculture and small businesses by 50 basis points (bps). The RRR for finance companies, or non-bank financial institutions, will be lowered by 300 bps, the PBOC announced. Benchmark interest rates have also been cut. Interest rates for one-year lending and deposits are cut by 25 bps to 4.85 percent and 2 percent respectively. Lending of other terms and kinds will also be lowered by the same margin, the announcement said. It is the third RRR reduction in nearly five months, while the fourth round of interest cuts in nearly seven months.

Consumer spending, rail traffic

Personal Income and Outlays
er-6-26-1
Highlights
The consumer came to life in May, boosted by a 0.5 percent rise in personal income and helping to support a 0.9 percent surge in personal outlays that reflects heavy spending on autos and retail goods. And gains are not inflationary, at least yet, based on the very closely watched core PCE price index which edged only 0.1 tenth higher in May and is at a very benign 1.2 percent year-on-year rate which is actually down a tenth from an upward revised April.

Components on the income side are very solid with wages & salaries up 0.5 percent in the month. Both proprietors’ income and rental income show especially strong gains. Spending components show special strength for durables, again tied especially to autos, and also strong gains for non-durables, here tied to higher pump prices. Spending on services once again shows an incremental gain.

Turning back to PCE prices, the overall price index looks a little hot in May at plus 0.3 percent but the year-on-year rate is unchanged at only 0.1 percent. That’s right, that’s the year-on-year rate at only the most incremental level of inflation. And the 1.2 percent year-on-year core appears to be moving in reverse, down 1 tenth in each of the last two reports and further away from the Fed’s 2 percent target.

Consumers, in an expression of their confidence, dipped into their savings to spend, with the savings rate down 3 tenths to 5.1 percent. This is a good report for the bulls, showing a strong non-inflationary bounce for the second quarter. This report won’t be keeping the doves up at night and does not move forward the Fed’s coming rate hike.

First, note the last wiggle up all the cheer leading is about, up from the previous flat one on the 5 year chart:
er-6-26-2
And the year over year growth rate for the last 10 years, and how the last time it got over 3% it didn’t stay there long:
er-6-26-3
New vehicle sales may have been up for the month, but the year over year industry growth rate is generally slowing:
er-6-26-4
er-6-26-5
And retail was reported higher, but hasn’t yet even recovered from the prior dip:
er-6-26-6
er-6-26-7
And, turns out, here’s where the growth is also coming from lately- health care premiums, which aren’t tracking with the lower growth of actual health care prices:
er-6-26-8
er-6-26-9
Construction appears to be growing at historical rates since the crisis dip:
er-6-26-10

The growth in health care employment has picked up to more historic levels after a large decline, so perhaps the larger increases we’ve seen are just a case of ‘catch up’, nor does there seem to be any unusual wage growth associated with the additional employment:
er-6-26-11
er-6-26-12
Nothing good happening here:
er-6-26-13

EU Industrial Production, Credit Check, Atlanta Fed

Even with increasing net exports, over all GDP isn’t benefiting all that much, as fiscal policy and structural reforms that assist exports do so by restricting incomes and domestic demand to achieve ‘competitiveness’. Additionally, negative rates and QE remove some interest income from the economy, which also restricts domestic demand to some degree. And, ironically, the subsequent current account surplus puts upward pressure on the euro until there are no net exports, obviating the efforts and sacrifices that went into achieving the competitiveness. Further note that a Greek default, for example, fundamentally removes net euro financial assets from the economy, further tightening the euro, as Greek debt is nothing more than bank deposits in the ECB system:

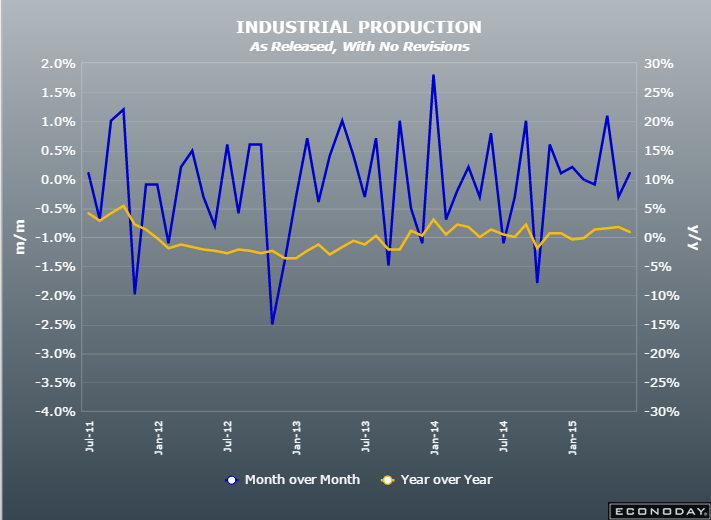
European Union : Industrial Production
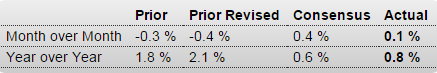
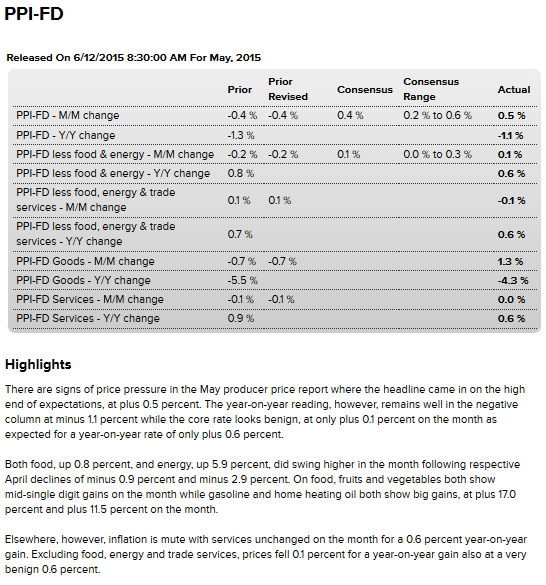
er-6-12-6
Highlights
The goods producing sector began the second quarter on a surprisingly soft note. A 0.1 percent monthly rise in production (ex-construction) was comfortably short of expectations and followed a steeper revised 0.4 percent decline in March. As a result, annual workday adjusted output growth dropped from 2.1 percent to 0.8 percent, its slowest pace since January.

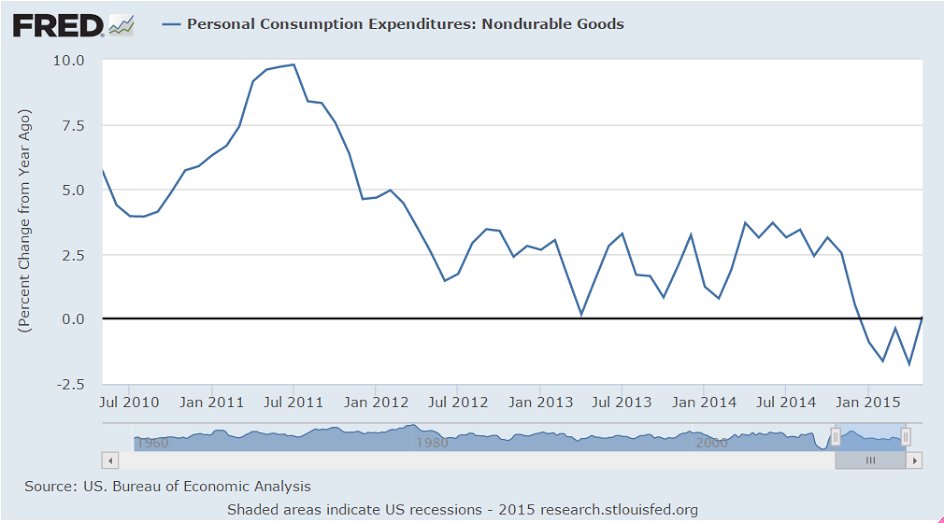
However, April’s minimal monthly rebound would have been rather more impressive but for a 1.6 percent slide in energy. Elsewhere there were gains in intermediates (0.3 percent), capital goods (0.7 percent) and consumer durables (1.0 percent). Non-durable consumer goods were down 0.8 percent but, apart from this category, all sectors reported increases versus a year ago.

Amongst the larger member states output rose a solid 0.8 percent on the month in Germany but there were falls in France (1.0 percent), Italy (0.3 percent) and Spain (0.1 percent). Elsewhere Finland, already technically in recession, only saw output stagnate following a cumulative 2.4 percent loss since the end of last year while Greece (also back in recession) posted a hefty 2.3 percent reversal.

April’s advance leaves Eurozone industrial production just 0.1 percent above its average level in the first quarter when it increased fully 0.9 percent versus October-December. This provides early warning of a probable smaller contribution from the sector to real GDP this quarter and so underscores the need for the ECB to see out its QE programme in full.
er-6-12-7

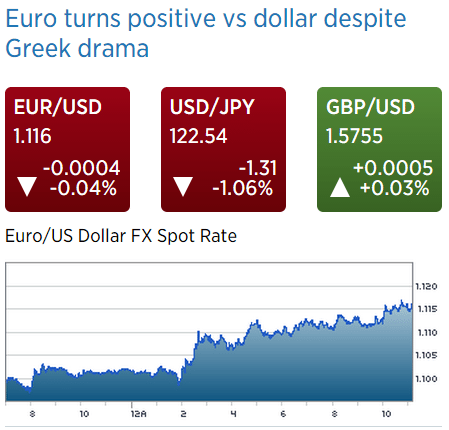
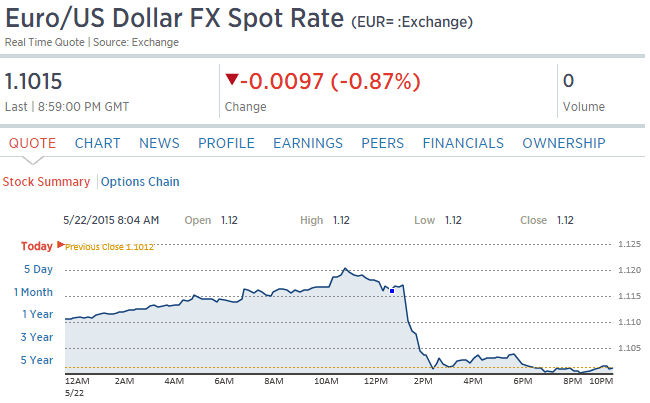
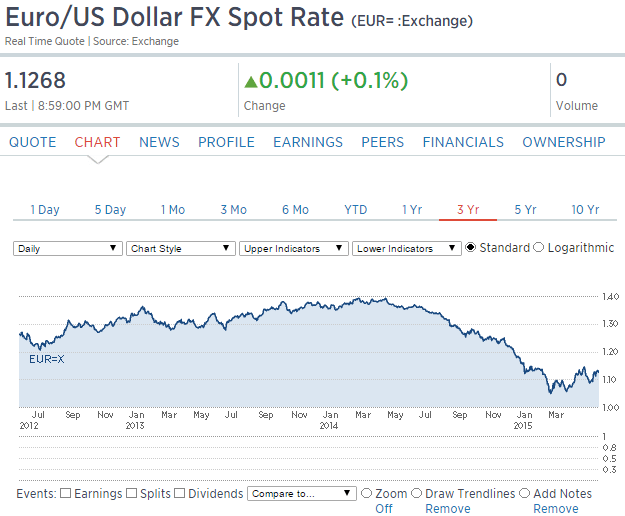
Portfolio selling from blind fear of QE and negative rates and Greece, etc. drove down the euro, but fundamentally inflation was falling and ‘competitiveness’ increasing so the trade surplus was pushed higher by the lower levels of the currency. Now it looks like the increasing trade flows are ‘winning’ and beginning drive the euro higher, with portfolios ‘sold out’ of euro, all of which should continue until the trade flows subside:
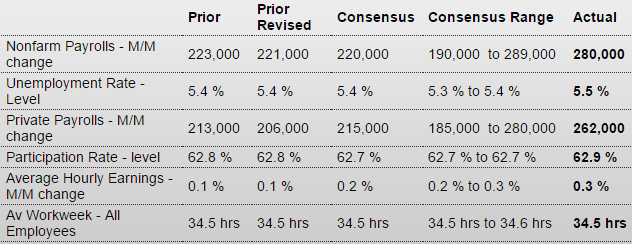
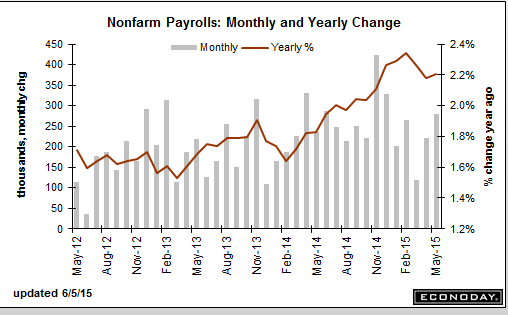
er-6-12-8
Back to the US:

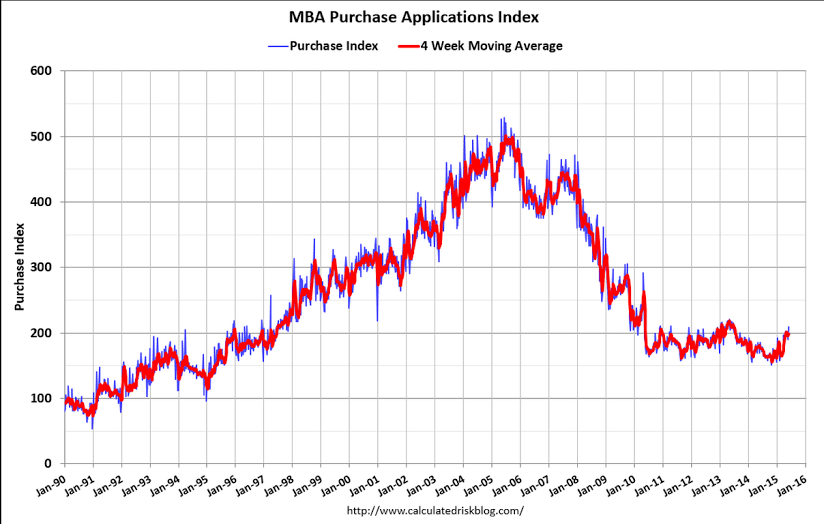
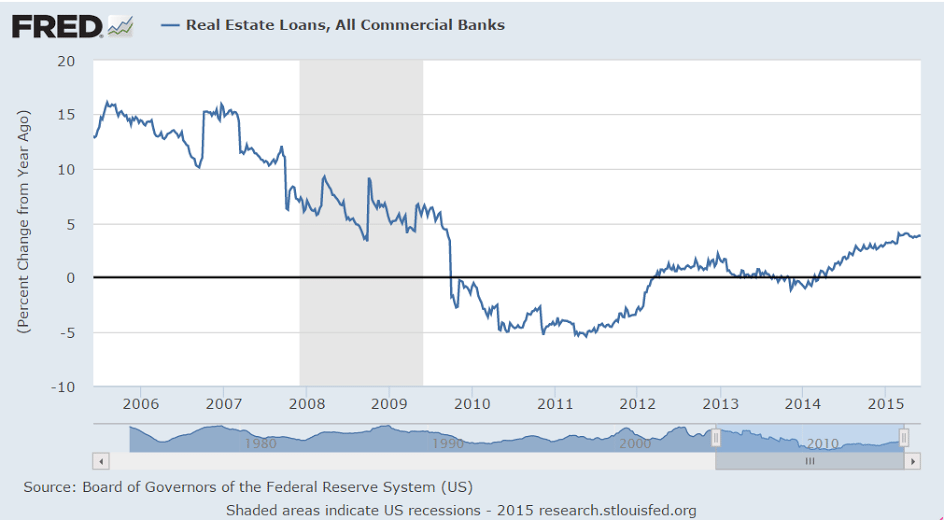
I see no sign of whatsoever of accelerating credit growth:
er-6-12-9
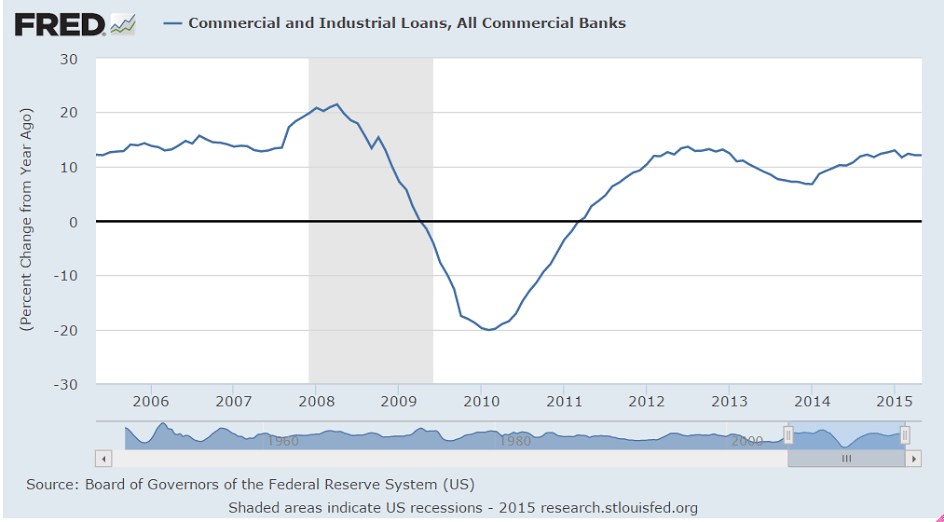
This got some attention when the growth rate was increasing, but not anymore since it rolled over and remains well below prior cycles:
er-6-12-10
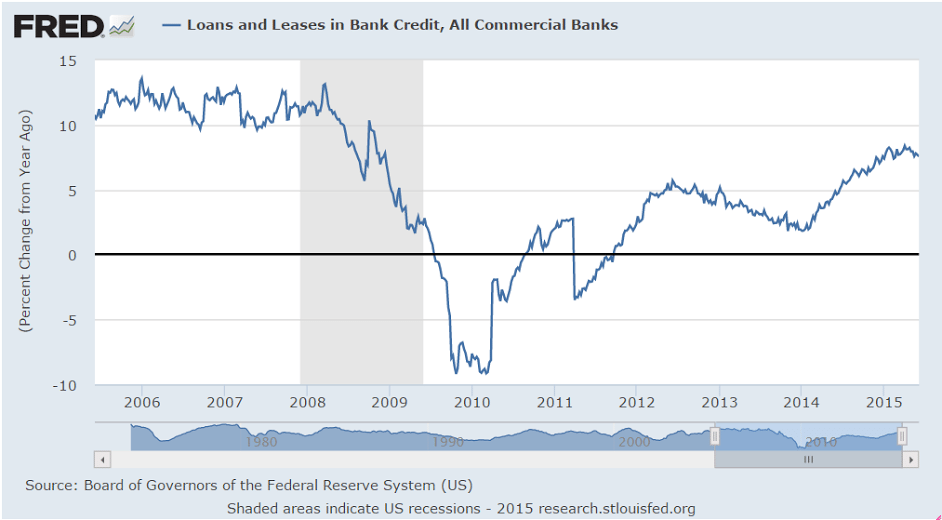
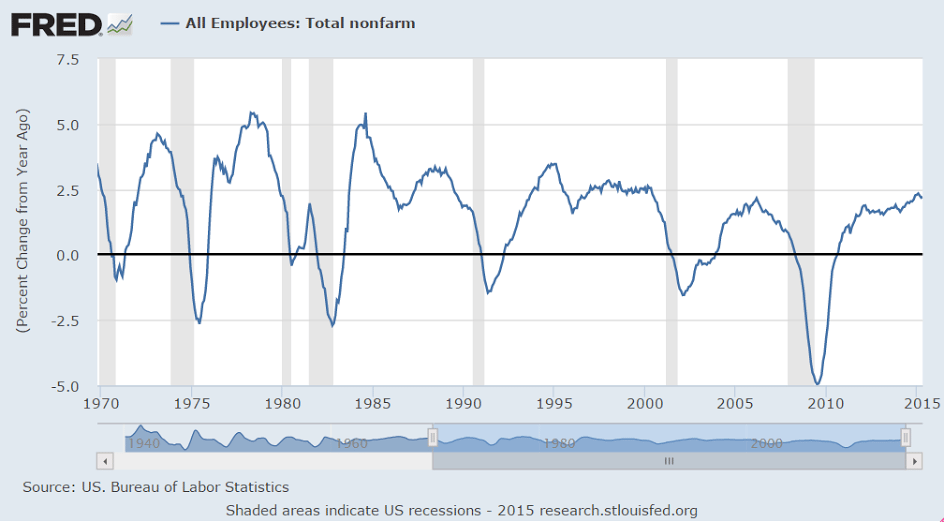
They make point of potential growth every time one of the little wiggles bends up, but just look at how low the growth rate actually is, especially compared to prior cycles:
er-6-12-11
er-6-12-12
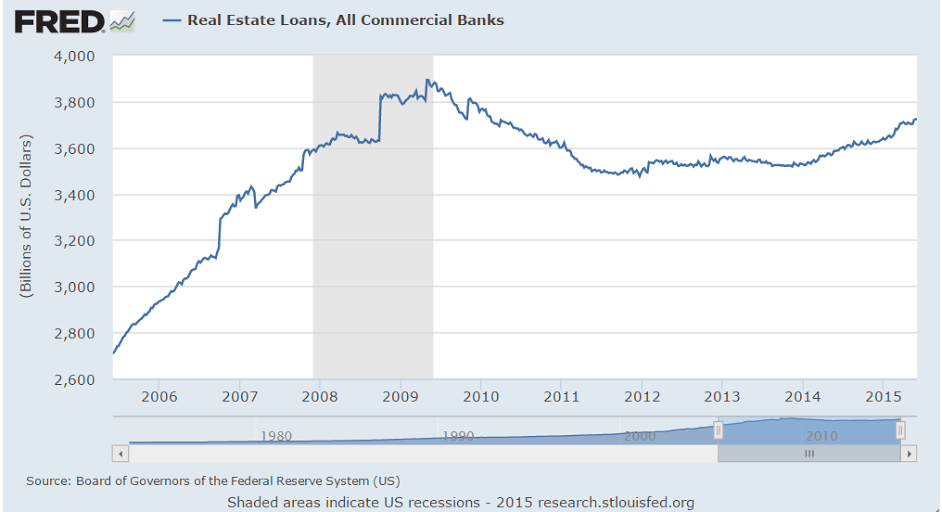
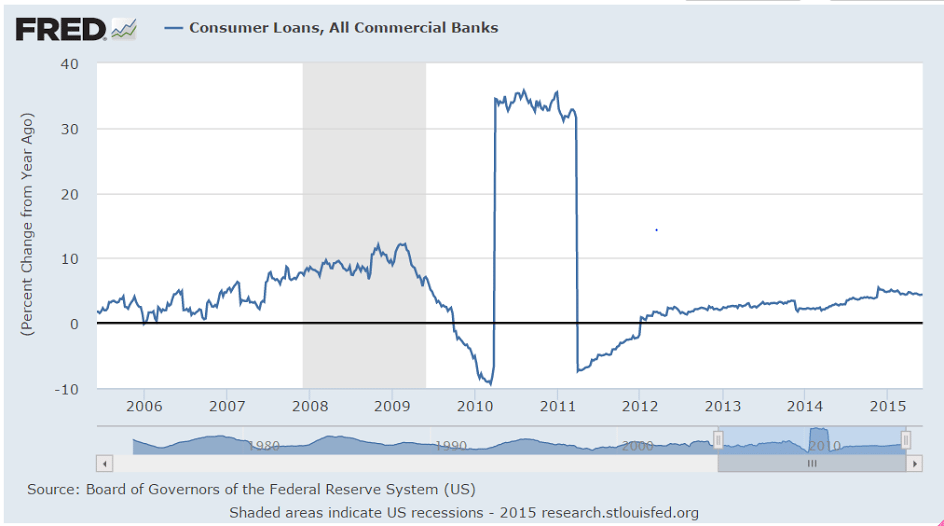
Nothing happening with consumer lending:
er-6-12-13
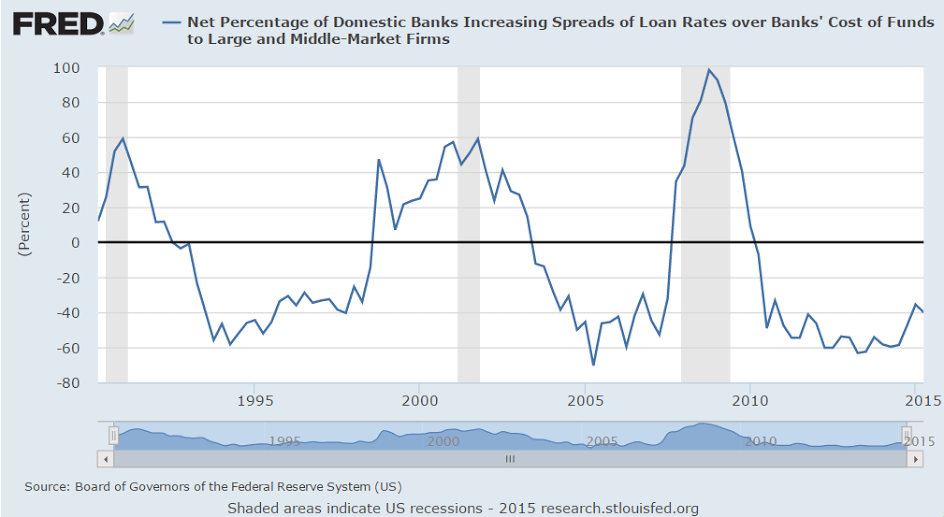
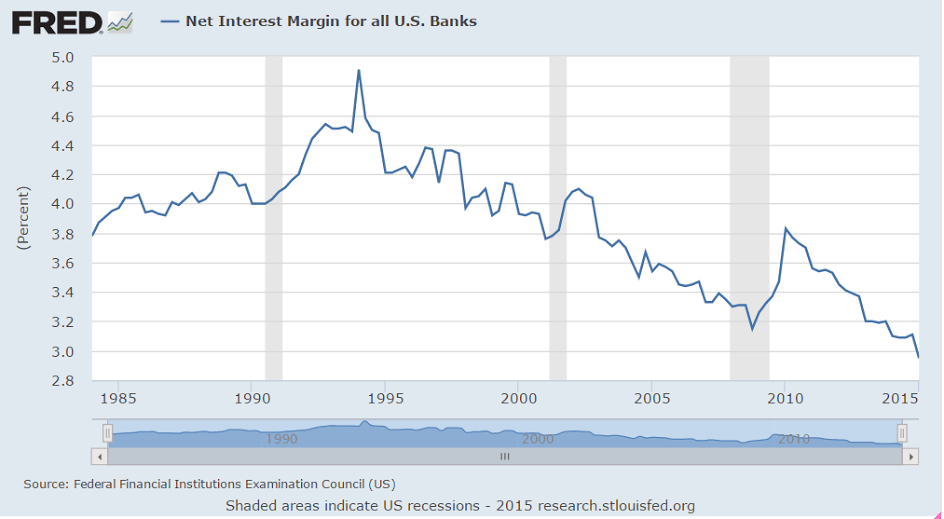
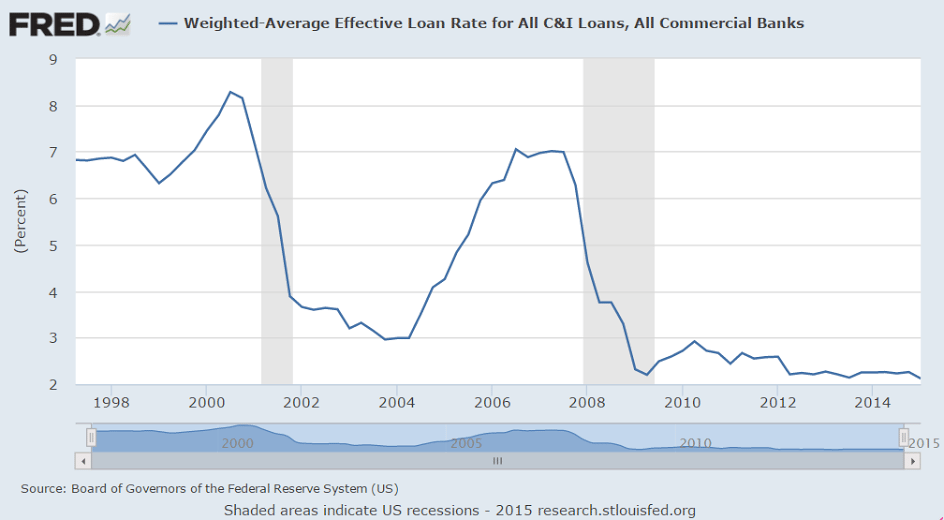
This shows how competitive banking is as banks compete by narrowing their spreads over their cost of funds:
er-6-12-14
er-6-12-15
er-6-12-16
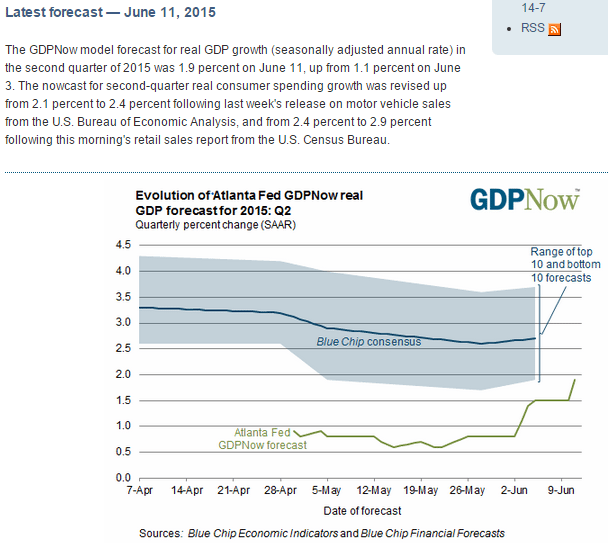
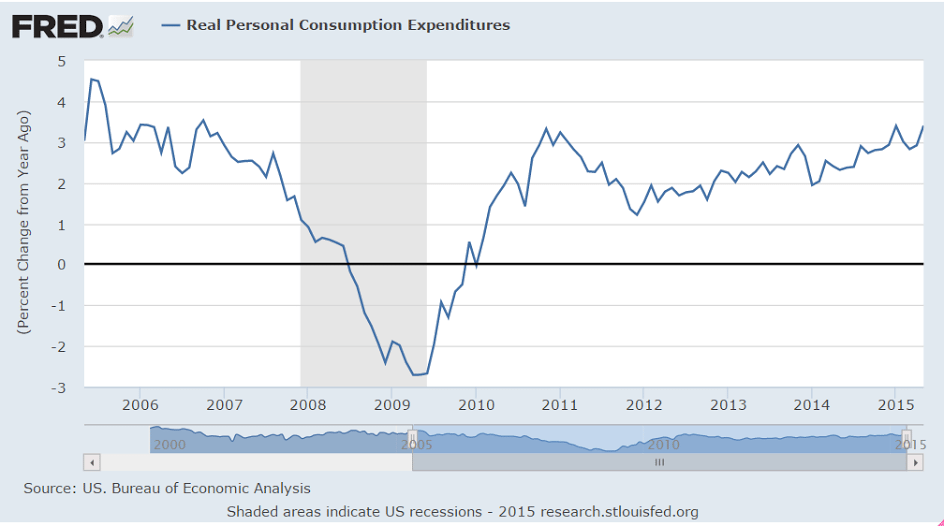
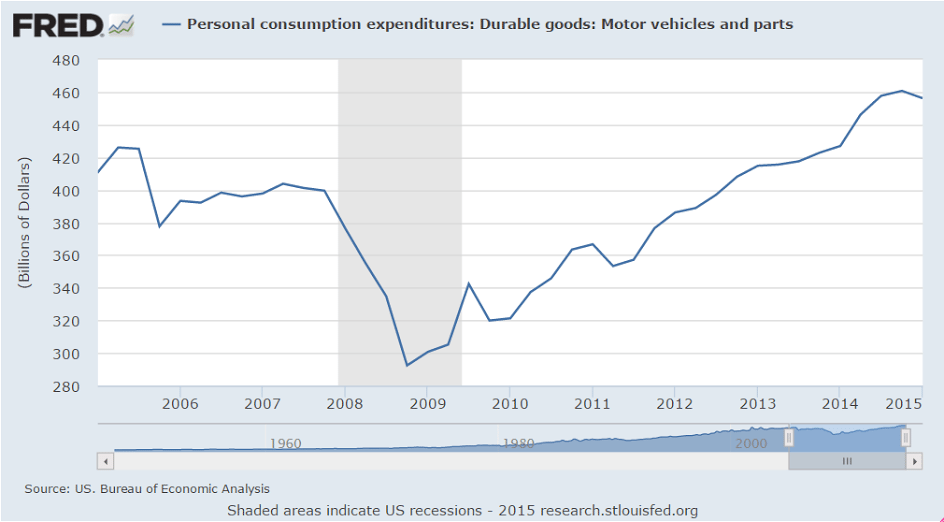
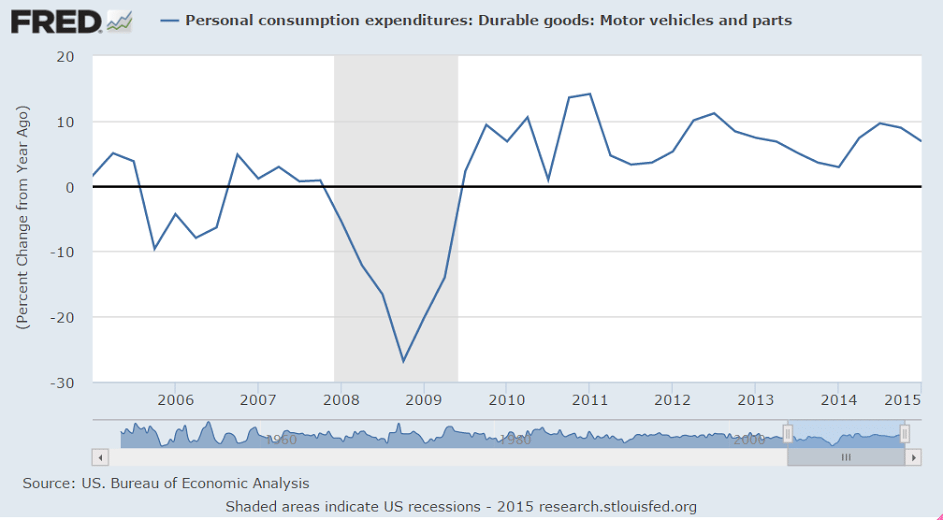
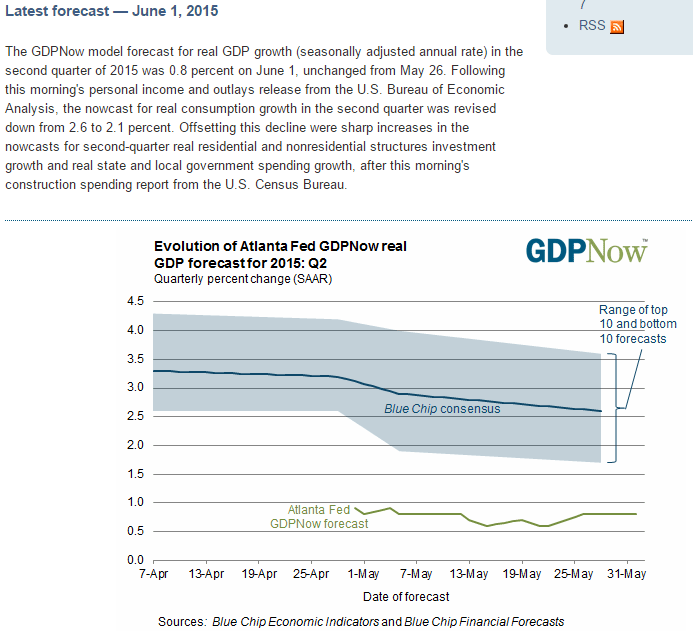
The Atlanta Fed forecast ticked up with the latest retail releases, but still remains well below mainstream forecasts and is also indicating what would be a very weak ‘bounce’ from the negative Q1 print, as the implied first half GDP growth rate would only be around .6%- very close to an ‘official’ recession. And as you’ve seen from the charts, those same releases indicated continued year over year deceleration of growth (including autos and retail sales) as well as elevated inventories, which doesn’t bode well for Q3 and Q4:
er-6-12-17

Consumer Sentiment, producer prices, summer jobs

Yes, it’s a bit of a rebound from last month, and being touted as proof of a strong recovery, but it also looks like the drift down may still be in progress, much like the consumer sales showed disturbingly declining rates of annual growth even though the recent release was an uptick:

Consumer Sentiment
er-6-12-1
Highlights
This week’s retail sales and consumer sentiment reports offer a one-two punch. Consumer sentiment is back on the climb, jumping nearly 4 points to 94.6 which is well above the Econoday consensus for 91.2. The gain is centered in the current conditions component, up 6.0 points to 106.8, which offers an early signal for June-to-May consumer strength. The expectations component shows a smaller but still healthy gain, up 2.6 points to 86.8. The gain here points to confidence in the jobs outlook.

Gas prices have been edging higher but are not affecting inflation expectations which ticked lower, down 1 tenth to 2.7 percent for both the 1-year and 5-year outlooks.
er-6-12-2

Headline Retail Sales “Improve” In May 2015. We Still See a Slowing Trend.

By Steven Hansen

Retail sales improved according to US Census headline data and were at expectations. We see a continued slowing of retail sales using the year-over-year unadjusted data. Consider that the headline data is not inflation adjusted and prices are currently deflating making the data better than it seems (but still not excellent and still decelerating).

‘Inflation’ remains well below Fed targets and no hard evidence its picking up:
er-6-12-3
er-6-12-4
er-6-12-5

mtg purchase apps, China comment

Mortgage purchase apps were up 10% for the week, leaving them about 15% higher than last year, which is where they’ve been for a while. However, cash sales are down sharply, so it seems that buyers have shifted from all cash to borrowing, leaving the total purchases about the same:

Weekly mortgage applications jump as rates surge

By Diana Olick

June 10 (CNBC) — Interest rates’ sharp jump to their highest level this year caused a sudden surge in mortgage applications. While that may seem counter-intuitive, there’s a reason: Fear that rates will move even higher.

Total mortgage application volume jumped 8.4 percent on a seasonally adjusted basis for the week ending June 5th from the previous week, according to the Mortgage Bankers Association (MBA). The previous week included an adjustment for the Memorial Day holiday.

“Mortgage application volume rebounded strongly…indicating that the holiday had a larger impact on business activity than originally assumed,” said Mike Fratantoni, MBA’s Chief Economist.

Refinance volume increased 7 percent week-to-week, and applications to purchase a home jumped 10 percent, both seasonally adjusted. Purchase volume is now 15 percent higher than the same week one year ago, but refinance volume is off nearly 5 percent. The weekly move higher in refinances was likely due to the holiday skewing the trend. Refinances are still lower than they were two weeks ago. This all comes as rates continue to climb.

The average contract interest rate for 30-year fixed-rate mortgages with conforming loan balances ($417,000 or less) increased to 4.17 percent, its highest level since November 2014, from 4.02 percent, with points increasing to 0.38 from 0.33 (including the origination fee) for 80 percent loan-to-value ratio loans, according to the MBA

While higher rates make home buying more expensive, sharp moves higher often have the immediate effect of getting potential buyers off the fence, before chilling the overall market in the longer term. That is especially true now, as the Federal Reserve is widely expected to increase interest rates in addition to what is happening in the U.S. bond market already.
er-6-10-1

China:

Confirms that their western educated economists’ believe ‘monetary policy’/rate cuts etc. work to increase output and employment, even though I think they are entirely wrong and backwards:

China’s economy to pick up in H2: Central bank economists

June 10 (CNBC) — Economists at China’s central bank have sharply lowered their 2015 inflation forecast even as they predicted that stabilising Chinese home prices and firmer foreign demand will drive a pick-up in the world’s second-biggest economy in the next six months.

In a report posted on the central bank’s website on Tuesday, economists at the People’s Bank of China (PBOC) said they had cut their 2015 inflation forecast for China to 1.4 percent, from an initial 2.2 percent.

The report, which said the estimates represented the view of the analysts and not that of the PBOC, contained other downward revisions to forecasts that underscored headwinds being faced by the slowing Chinese economy.

Yet, the economists were cautiously optimistic on the outlook.

The property market is “starting to stabilise” and the world economy should show further signs of a recovery in coming months, said the economists who were led by Ma Jun, the chief economist at the central bank.

Looser monetary policy conditions as a result of China cutting interest rates thrice since November were also expected to help shore up growth in coming months, the economists said.

“We estimate that our country’s gross domestic product growth in the second-half of the year will be higher than in the first-half,” they said, noting that it takes six to nine months for China’s economy to feel the effects of monetary policy easing.

The report showed the economists had shaved their forecast for China’s economic growth to 7.0 percent for 2015, from 7.1 percent previously.

The forecast for producer prices was also sharply revised to indicate deepening deflationary pressure. The producer price index is now expected to fall 4.2 percent for 2015, from an estimated decline of 0.4 percent previously.

payrolls, rail traffic

Most notable is the market reaction- rates up, stocks down, as markets discount higher odds of a Fed rate hike into what markets think is a relatively weak economy, and I tend to agree.

Employment Situation
er-6-5-1
Highlights
The hawks definitely have some ammunition for the June 16-17 FOMC meeting as the May employment report proved very strong led by payroll growth and, very importantly, an uptick in wage pressures. Non-farm payrolls rose 280,000, well above the Econoday consensus for 220,000 and near the top-end forecast of 289,000. Revisions added a net 32,000 to the two prior months.

Average hourly earnings came in at the high end of expectations, up 1 tenth to plus 0.3 percent. Year-on-year earnings are up 2.3 percent, a rate only matched twice during the recovery, the last time back in August 2013. Pressure here will be the focus of the hawks’ arguments.

Another sign of strength includes the labor participation rate, up 1 tenth to 62.9 percent. The unemployment rate did tick 1 tenth higher to 5.5 percent which is unexpected but the gain reflects a solid gain in the labor force for both those who found a job and especially those who are now looking for a job.

Private payrolls are up 262,000 vs expectations for 215,000 and also near the high-end forecast. By industry, professional business services once again leads the list, up 63,000 following a 66,000 gain in April. Within this industry, the closely watched temporary help services sub-component is up 20,000 after two prior gains of 16,000. The rise in temporary hiring points to permanent hiring in the months ahead. Trade & transportation is up 50,000 followed by retail trade at a solid 31,000. Construction is up 17,000 but follows a 35,000 surge in April. Manufacturing, where exports are hurting, continues to lag, up only 7,000. And mining, which is being clobbered by contraction in the energy sector, is down 17,000 to extend a long run of declines.

Today’s results probably aren’t enough to raise expectations for a rate hike at this month’s FOMC but will be enough to raise talk for a hike at the September meeting. The approach of a rate hike is a wildcard for the financial markets, likely raising volatility including for the Treasury market where turbulence has been very heavy the last month.

Can be said to be a minor rebound from the March dip when you average the last three months, and certainly not a sign of ‘acceleration’:
er-6-5-2
Not a lot of change, but the 6 month average is still bending down some:
er-6-5-3

These are still telling me there is still a very large amount of slack in the ‘labor market’ and the gains all along have been relatively small:
er-6-5-4

If you think of the recessions of ‘digging a hole’ that was subsequently ‘filled in’ you can see the magnitude of the hole dug in the last recession and how it remains ‘unfilled in’, as per the participation rates:
er-6-5-5
When you look at this age group in isolation, the decline is all about aggregate demand, and not about aging:
er-6-5-7
This doesn’t look so good when you take it back a few years, and considering this is not adjusted for inflation and there’s been a 0 rate policy for 7 years and $3.5 trillion of QE ;)
er-6-5-8
er-6-5-9

Rail Week Ending 30 May 2015: Contraction Further Worsens On Rolling Averages. May 2015 Month Totals Show Contraction Year-over-Year.

(Econintersect) — Week 21 of 2015 shows same week total rail traffic (from same week one year ago) declined according to the Association of American Railroads (AAR) traffic data. Intermodal traffic improved year-over-year, which accounts for half of movements – but weekly railcar counts continues deep into contraction. A quote from the AAR data release:

The degree to which coal carloads have fallen has been a surprise, and the relative weakness in other carload categories is a sign that the economy is probably not yet in bounce-back mode after a dismal first quarter.

Personal Income and outlays, ISM manufacturing, Construction spending, Atlanta Fed

Personal Income and Outlays
er-6-1-1
Highlights
The consumer started off the second quarter slowly, putting income into savings and not spending. Consumer spending was unchanged in April with deep declines in spending on both durable and nondurable goods, down 0.7 percent and down 0.5 percent respectively, offset by another incremental increase in spending on services of plus 0.2 percent. Personal income, boosted by rents and dividends, rose a solid 0.4 percent though the gain for wages & salaries was less strong at 0.2 percent. The savings rate rose 4 tenths in the month to 5.6 percent.

Inflation readings are very tame with the price index unchanged in the month and the core up only 0.1 percent. The core rate, unlike April’s 1.8 percent core reading for the CPI where weightings on housing and medical costs are greater, is showing less pressure, down slightly to 1.2 percent. Overall prices are barely up at all year-on-year, at plus 0.1 percent.

The April retail sales report first signaled trouble for second-quarter spending that today’s report confirms. The consumer, the economy’s bread-and-butter right now given weakness in manufacturing, is sitting on their hands. This report pushes back the outlook for the Fed’s first rate hike.
er-6-1-2

Construction Spending +2.2% in April

Seasonally adjusted annual rate of $1,006.1 billion, 2.2% above the revised March estimate of $984.0 billion. The April figure is 4.8% above the April 2014 estimate of $960.3 billion. During the first 4 months of this year, construction spending amounted to $288.7 billion, 4.1% above the $277.3 billion for the same period in 2014.

These surveys are ‘one company one vote’ and the drop in oil capex hurts a small number of the total initially even as GDP growth fades before it spreads to the rest, which could take a while as slowing employment gains reduce demand in general, etc. And note the continued reference to export softness, which is partly dollar related, but also a function of the drop in gobal oil capex.

ISM Mfg Index
er-6-1-3
Highlights
May was a modestly positive month for ISM’s manufacturing sample with the headline index rising 1.0 point to a better-than-expected 52.8 which is near Econoday’s high-end forecast. New orders are the highlight of the report, up 2.3 points to 55.8 which is the best reading of the year. Contraction in export orders has been pulling down total orders in many reports but exports were unchanged at 50.0 in this report.

Employment moved back over 50 to 51.7 for a 3.4 point gain while production looks solid at 54.5. Backlog orders, at 53.5, are back over 50 for the first time since February. Supplier deliveries show very little change, at 50.7 vs 50.1 in the prior report to suggest that snags tied to the first-quarter port slowdown have unwound. Price data show slightly lower costs for raw materials.

The 52.8 headline for this report may be better-than-expected but it’s still very soft. The manufacturing sector appears to be stumbling through the second quarter.
er-6-1-4

Up nicely, though mainly due to state and local govt increases. And more importantly, year over year growth a bit better but still very low.

Construction Spending
er-6-1-5
Highlights
Construction spending is showing life, up 2.2 percent in April which is well above Econoday’s consensus for plus 0.7 percent and Econoday’s high-end forecast of 1.6 percent. Spending on residential construction rose 0.6 percent with strong gains posted for both single-family and multi-family homes. The gain here is no surprise and follows April’s big surge in housing starts & permits.

Private non-residential spending looks very strong in this report, up 3.1 percent and led by gains out of the power and office sectors. Pubic spending is also strong led by an outsized gain for highways & streets and including a large gain for educational building. The gain in public spending came entirely from the state and local governments as federal construction spending declined for a second straight month.

Adding to the positive news are big upward revisions, to plus 0.5 percent from an initial reading of minus 0.6 percent for March and no change from minus 0.6 percent in February. This will help boost the next revision to first-quarter GDP. And construction should give a badly needed lift to second-quarter growth which isn’t getting much help from the consumer, evidenced by this morning’s personal income & outlays report, nor from manufacturing, underscored by mostly soft readings in both this morning’s PMI index and ISM index.
er-6-1-6

After factoring in today’s numbers the Atlanta Fed GDP forecast remains at .8% annualized for Q2:
er-6-1-7

Stephanie Kelton, Rail cars, Econintersect forecast, Italy comment, corp profits

Professor Kelton hit the ground running in January and has been making serious inroads!

This article has the usual misrepresentations, of course, but now Stephanie’s position gives her the opportunity to respond publicly and decisively.

U.S. Senate economist explains why deficits aren’t always evil: Walkom

By Thomas Walkom

Stephanie Kelton is part of a new generation of economists trying to figure out how things work in our grim, new world.

Rail Week Ending 23 May 2015: Contraction Worsens On Rolling Averages

(Econintersect) — Week 20 of 2015 shows same week total rail traffic (from same week one year ago) declined according to the Association of American Railroads (AAR) traffic data. Intermodal traffic improved year-over-year, which accounts for half of movements – but weekly railcar counts continues deep into contraction.


June 2015 Economic Forecast: Significant Decline In Our Economic Index

By Steven Hansen

(Econintersect) — Econintersect’s Economic Index continues to weaken. Most tracked sectors of the economy are relatively soft with most expanding well below rates seen since the end of the Great Recession. When data is this weak, it is not inconceivable that a different methodology could say the data is recessionary. The significant softening of our forecast this month was triggered by marginal declines in many data sets which are dancing closer and closer to zero growth.

The currency depreciation a while back took away real spending power as did the tax increase, shifting income from people to businesses, and helping exports as well:

Japan : Household Spending
er-5-28-1
Highlights
April household spending was down 1.3 percent from a year ago. This was the thirteenth consecutive month of decline. The retreat in spending began when the sales tax was increased from 5 percent to 8 percent in April 2014. Consumers went on a spending frenzy prior to the enactment of the increase and shut off the spending spigot when it was introduced. The weak consumption figures could threaten to keep inflation subdued in the months ahead, though recent commentary from the BoJ suggests the bank is optimistic about the economy’s resilience.

First they credit reforms and THEN oil and the euro:

Italy:

Early efforts with labor and bank reform show progress and Italy’s economy is showing signs of life, expanding 0.3 percent in the first quar ter – the first uptick since the third quarter of 2013 — as a weaker euro and lower oil prices help push the country out of its longest recession on record.

The economic figures tie with recent business confidence data and yet unemployment is still ticking higher – hitting 13 percent in March. As one Italian worker told me in Milan: “If recovery is happening, it isn’t happening fast enough.”
er-5-28-2

Revised lower as expected. The question is q2 which so far isn’t looking so good.

GDP
er-5-28-3

er-5-28-4

CPI

Today’s markets reacted entirely to the .3 increase in core CPI which was actually 0.26 which rounded to 0.3. This, for example, caused the dollar to gap up for the day vs the euro, as traders and portfolio managers acted on the beliefs that it made a Fed hike more likely to come earlier, and that higher rates would fundamentally support the dollar.

However, fundamentally, inflation is in fact a redefinition of a currency downward, as the same number of $ buy less. Likewise, higher domestic costs are a force that reduces exports and higher domestic incomes increases imports, both contributing to trade flows that weaken the currency in line with the loss of value due to inflation. And with floating exchange rates, changes in rates alter the difference between spot and forward price, but not the ‘general level’ of the currency. But no matter, in the near term technicals rule over potential longer term changes to trade flows and the dollar went up.
er-5-23-1

Consumer Price Index
er-5-23-2
Highlights
Pull forward that rate hike is what some of the hawks are thinking after reading today’s consumer price report where a benign looking headline, up only 0.1 percent in April, masks rising pressure through many components.

Excluding food and energy, core prices rose 0.3 percent which doesn’t seem that much but is outside Econoday’s high-end forecast for 0.2 percent. It is also the highest since January 2013. The year-on-year rate for the core is plus 1.8 percent which, after dipping to 1.6 percent earlier in the year, is closing in on the Fed’s general inflation target of 2.0 percent.

Readings showing pressure are outside energy including medical costs (up a very steep 0.7 percent in the month) and education costs (up 0.5 percent). Shelter costs, reflecting rising rents, came in at plus 0.3 percent for the 3rd time in 4 months which is the hottest streak for this reading since way back in late 2006 and early 2007. Also standing out are gains in furniture (up 1.3 percent) and used cars (up 0.6 percent).

Oil prices have been on the rise but not energy costs, at least in the April report which fell a heavy 1.3 percent. Gasoline fell 1.7 percent in the month. Two other readings also showed downward pressure: airfares (minus 1.3 percent) and apparel (minus 0.3 percent). Food costs were flat.

The headline CPI is down 0.2 percent year-on-year which looks downright deflationary. But the lack of pressure is due entirely to energy which is down a very deflationary 19.4 percent year-on-year. Energy prices are bound to firm given the recent move in oil from the high $40s for WTI to $60. That and emerging price pressures through the bulk of the consumer economy raise the risk that inflation may be brewing after all.
er-5-23-3