ISM, Construction spending, Bank loans, HK chart, Headlines, CEO departures

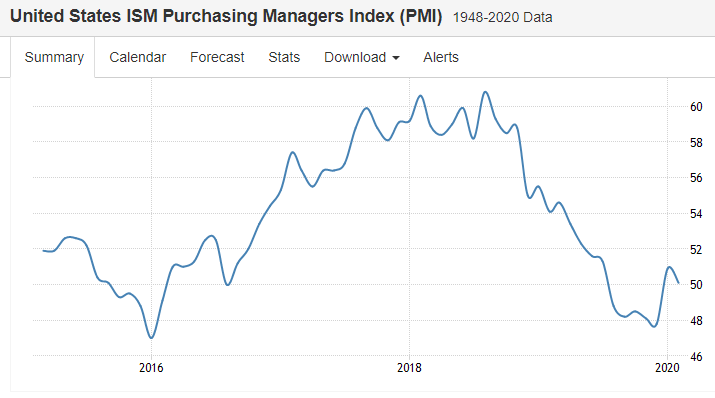
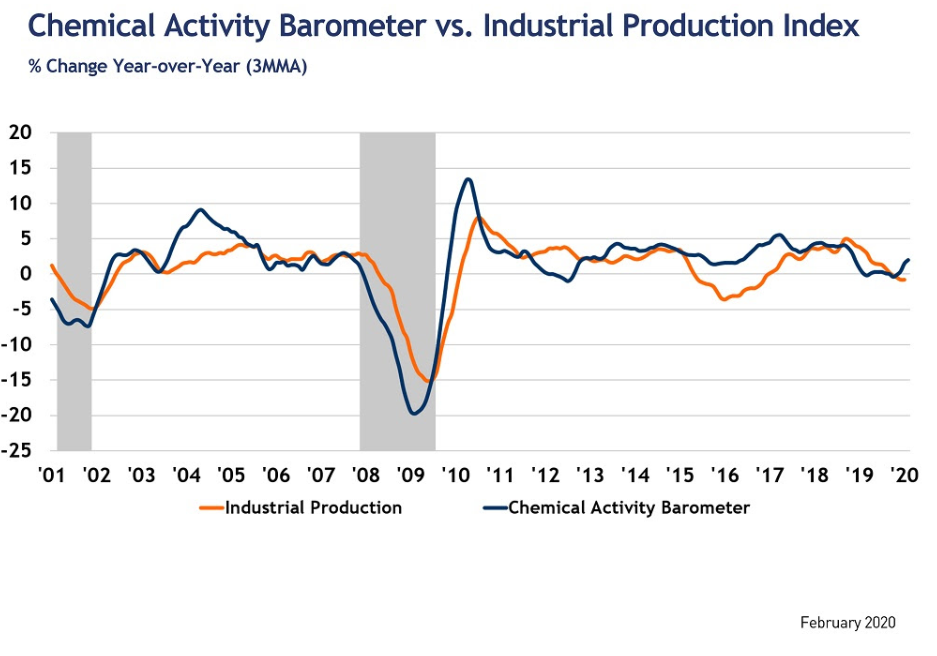
Another one of those brief moves up after the long slide seems to be reversing:

The ISM Manufacturing PMI for the US declined to 50.1 in February of 2020 from 50.9 in January and below market expectations of 50.5. New orders contracted (49.8 from 52), production slowed (50.3 from 54.3) and both employment (46.9 from 46.6) and inventories (46.5 from 48.8) continued to fall. Also, price pressures declined (45.9 from 53.3). Global supply chains are impacting most, if not all, of the manufacturing industry sectors.

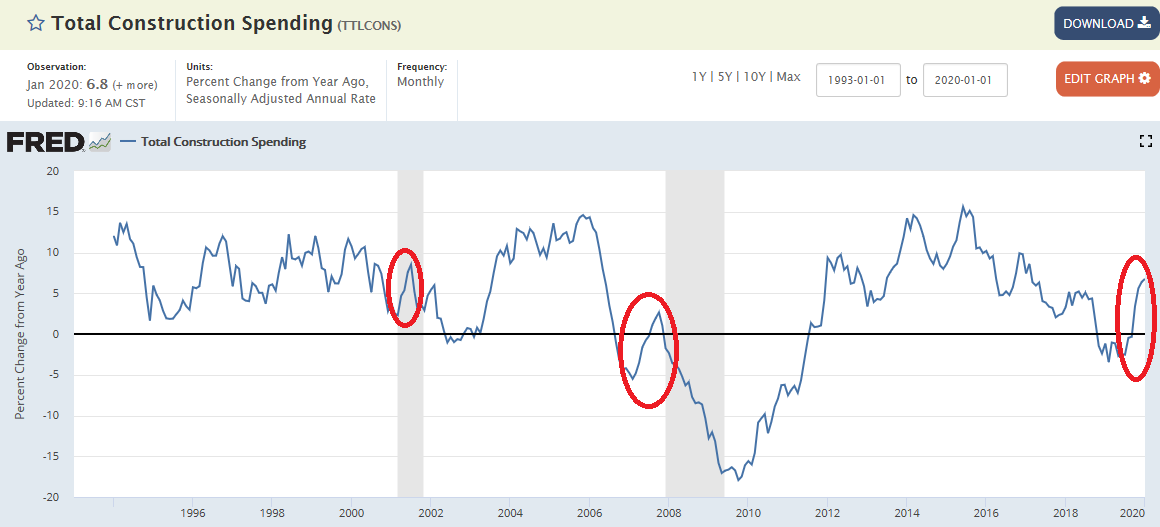
Construction spending mover up a bit, but that was January with its warmer than average weather immediately after rates fell and pre virus. And note similar moves up in prior cycles:


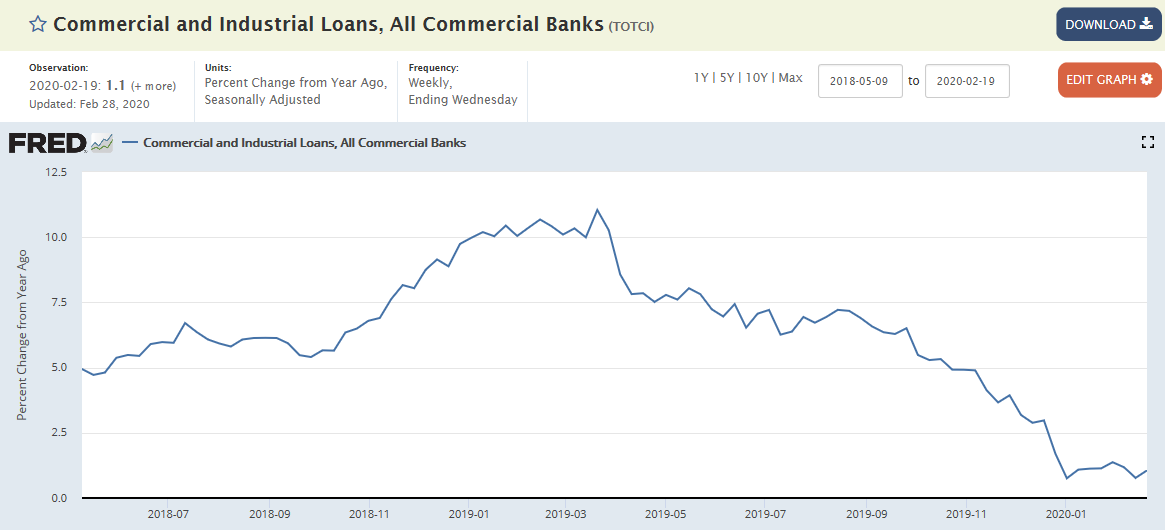
Commercial and industrial loan growth remains depressed at near 0:


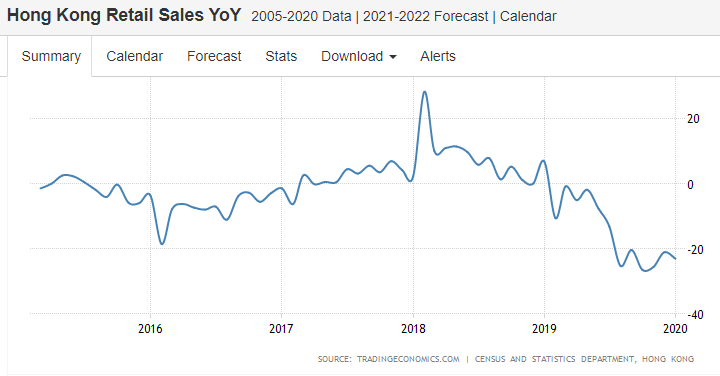
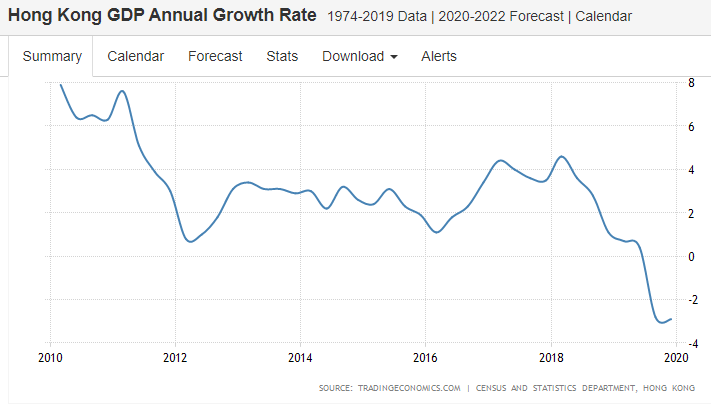
Glimpse into China:


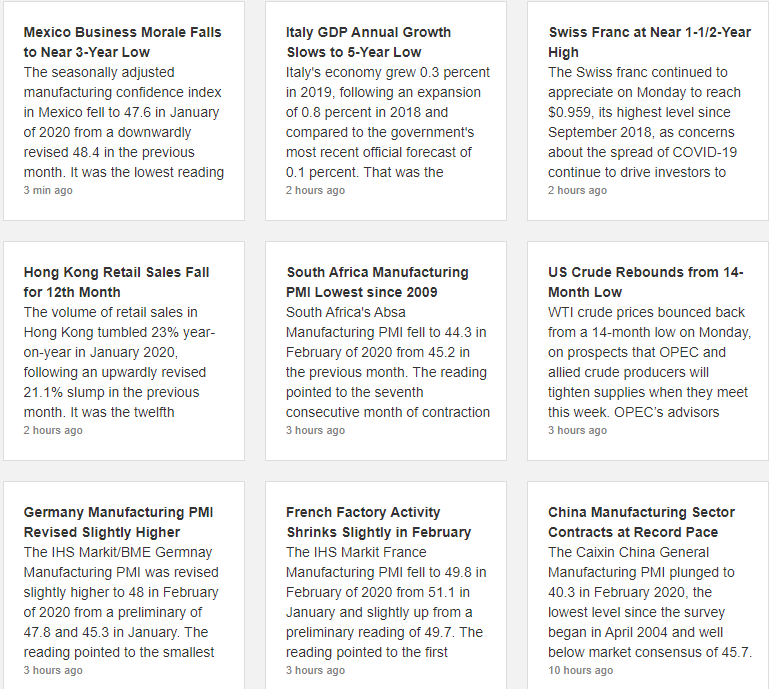
Headline snapshot:


Not a good sign:

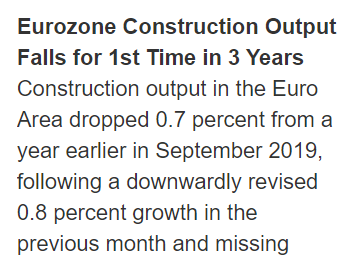
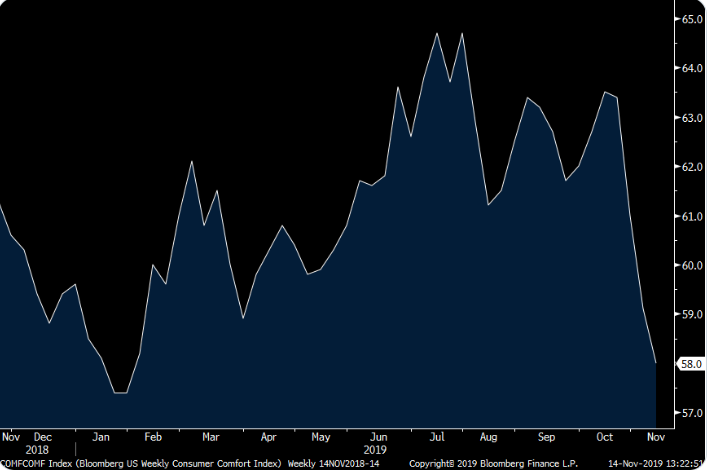
Housing, Eurozone construction, Singapore, Consumer comfort, Air freight

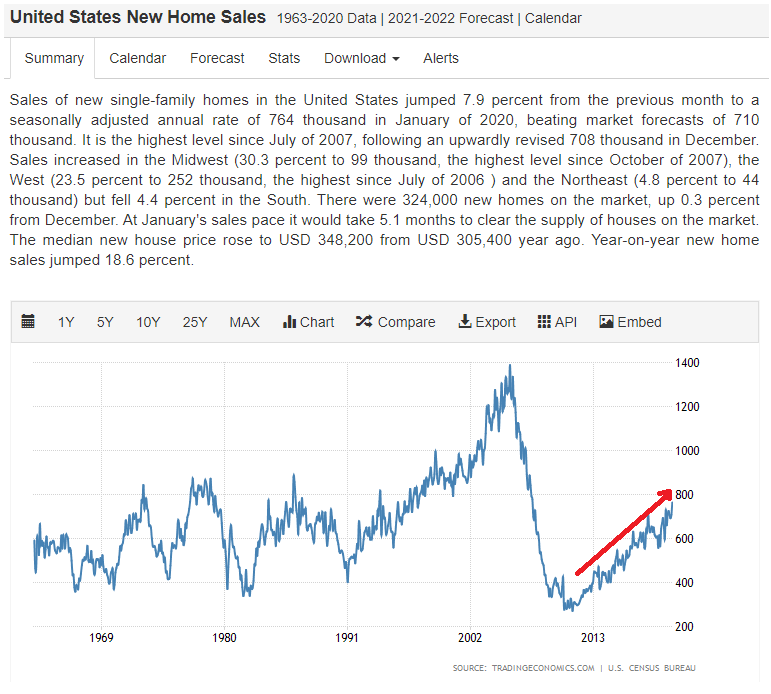
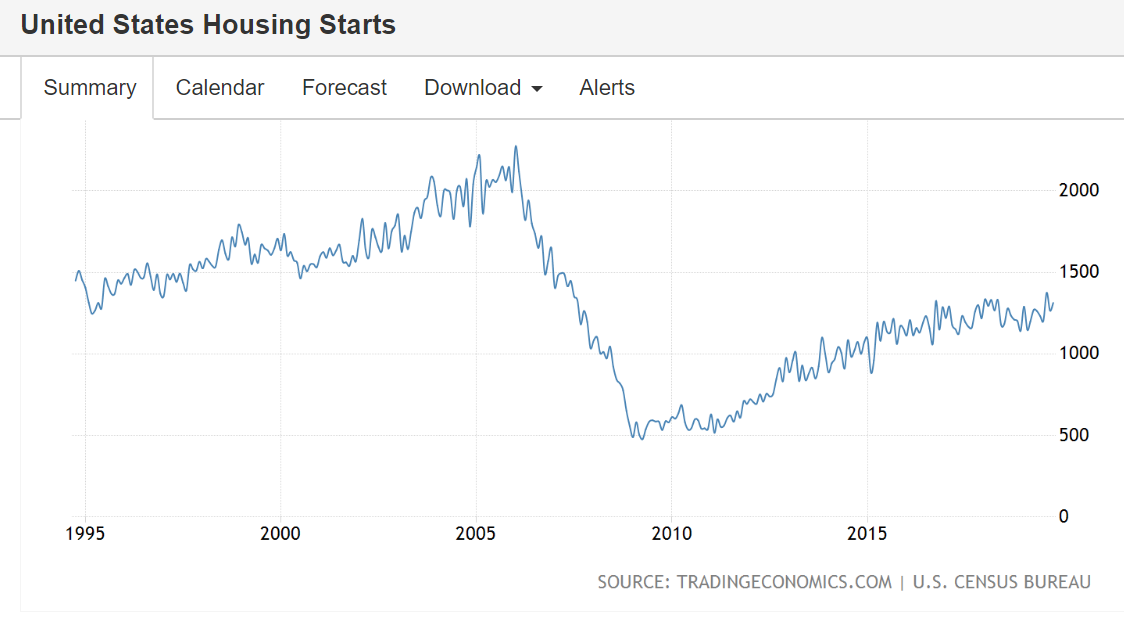
You can see from the charts how depressed this cycle has been, and how housing has stalled out overall for the last few years, and all with ultra low mortgage rates:


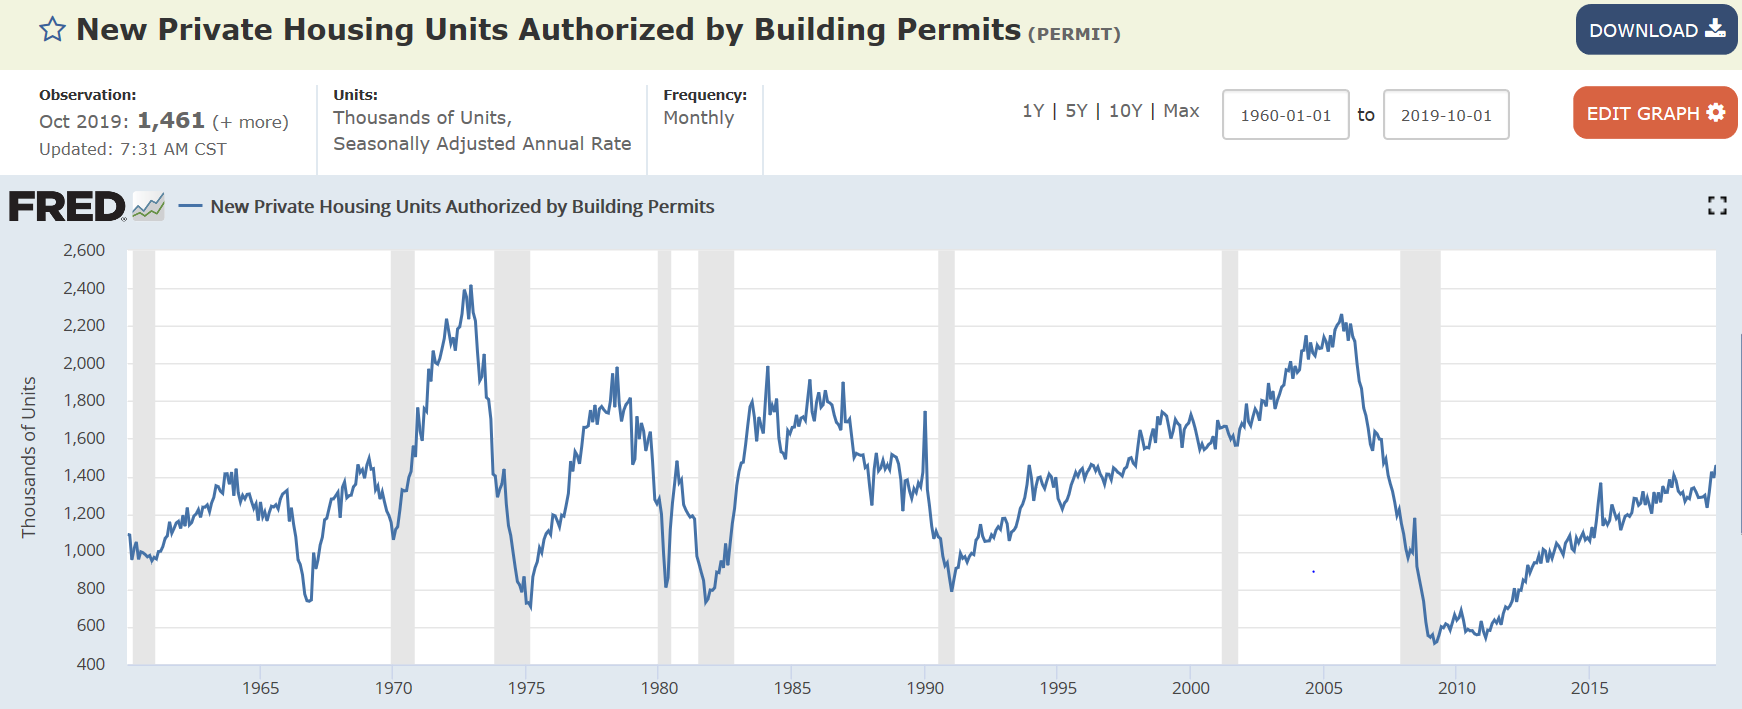
Permits which are more volatile have ‘spiked’ back to 1965 levels when the population was about half:

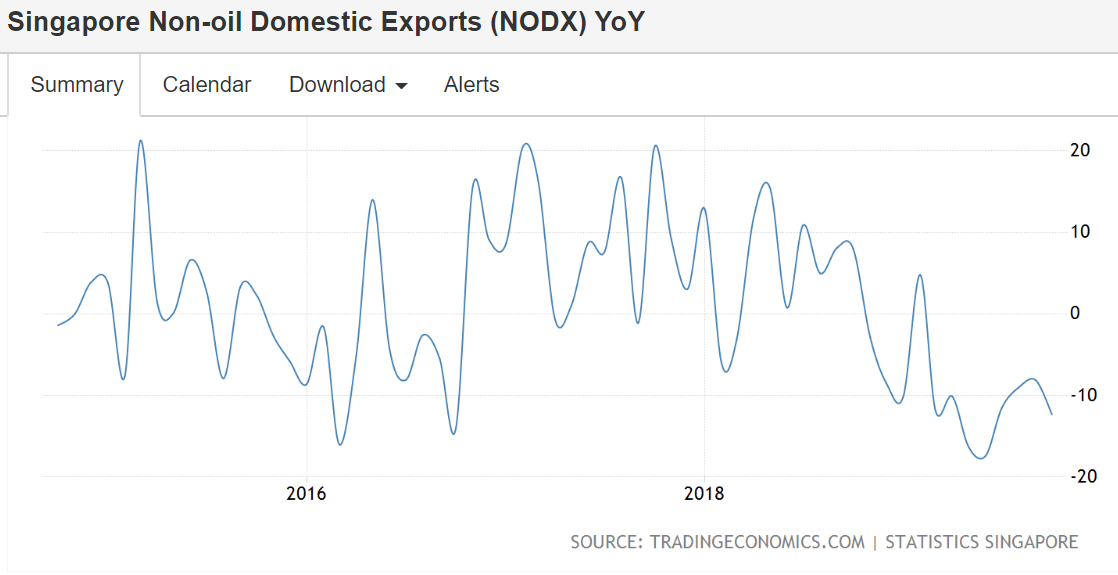
A relatively small economy but the drop in exports is telling:

Singapore’s non-oil domestic exports (NODX) tumbled 12.30 percent year-on-year in October 2019, following an 8.1 percent drop in September and compared with market consensus of a 10.40 percent decrease. It was the eighth straight month decline in NODX and the steepest drop since June, as sales of non-electronics products fell faster (-11.0 vs -2.3% in September), of which primary chemicals (-47.3%); pharmaceuticals (-36.0%), and petrochemicals (-19.2%). Meantime, sales of sales of electronics continued to declined (-16.4 vs -24.8%), including ICs (-17.2%), parts of ICs (-31.3%), and telecommunications equipment (-15.7%).Meanwhile, sales of. Among major trading partners, exports dropped to China (-21.3%); Taiwan (-23.8%); Hong Kong (-13.6%); Japan (-30.3%); Indonesia (-7.3%); Malaysia (-3.6%); the US (-3.1%); South Korea (-12.6%), and the EU (-39.6%), while increased to Thailand (1.5%). Domestic Exports of Non Oil (nodx) (%yoy) in Singapore averaged 9.90 percent from 1977 until 2019, reaching an all time high of 70 percent in February of 1980 and a record low of -34.90 percent in January of 2009.


Largest 3 month drop in 8 years:

Employment, US PMI’s, Factory orders, Japan sales tax, HK, MMT comments

Headline number looks promising. The question is whether employment will lag the other indicators that are decelerating, or provide the support that turns them around. And note the .1 drop in the work week is equivalent to maybe to something over 100,000 jobs:
Highlights

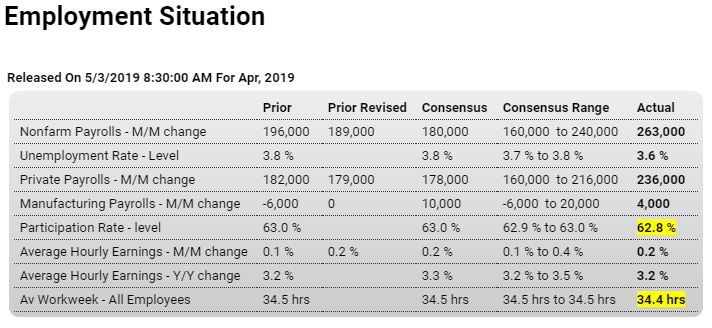
That sound you hear is the economy revving up. Nonfarm payroll growth easily beat expectations at 263,000 in April as did the unemployment rate with an outsized 2 tenths decline to a 49-year low of 3.6 percent. Wages didn’t show any immediate jolt from the strength, coming in as expected for the monthly rate, at 0.2 percent, and 1 tenth under expectations for the year-on-year rate at 3.2 percent.

Tightening conditions are the signal from the pool of available workers which continues to be drained, down nearly 500,000 in the month to 10.9 million. The participation rate, reflecting the decline, fell 2 tenths to a lower-than-expected 62.8 percent.

Payrolls are headed by a second sharp gain for construction, up 33,000 in April after 20,000 in March, for a sector where scarcity of labor especially skilled labor has been an ongoing theme. Perhaps topping construction for April’s payroll highlight is a 76,000 surge in professional & business services that includes an 18,000 jump in temporary help. The strength here, which adds to prior gains, indicates that businesses, in an effort to get the people they need immediately, are turning to contractors to fill slots. Government payrolls are also very strong, up 27,000 in April.

The latest unemployment drop was for the wrong reason

The nation’s unemployment rate sank in April to the lowest rate since December 1969, but the milestone comes with a big caveat: The decline stemmed from more people quitting their search for work.

The jobless rate slipped to 3.6% last month from 3.8% in March, continuing a long downward arc from a 27-year high of 10% in 2009. Yet that doesn’t mean there aren’t some potential trouble spots.

Take the size of the labor force. It contracted in April by nearly half a million people and fell for the fourth straight month.

The last time the labor force fell four months in a row was during the waning stages of the 2007-2009 Great Recession. And before that one has to go back to 1950.

As a result, the so-called labor-force participation rate slipped to 62.8% from a six-year high of 63.2% in January. That is, every 63 of 100 able-bodied Americans 16 or older either have a job or are seeking one.

The shrinking labor force “is the primary factor behind the unexpected decline in the unemployment rate,” noted chief economist Richard Moody of Regions Financial.

This is from the household survey. The two surveys tend to converge over time, and the payroll survey is much larger and less subjective:

The household survey shows employment is down for the year:


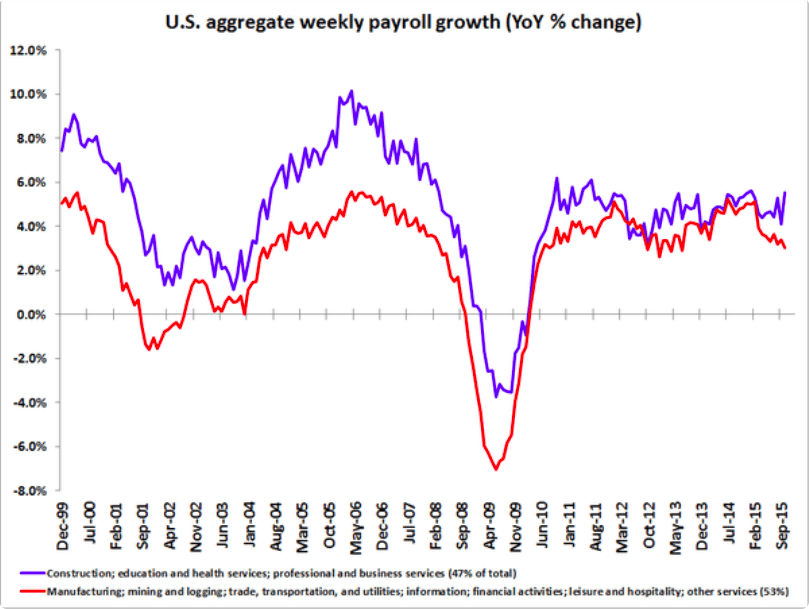
Up nicely for the month, but year over year growth still heading south, as per the chart:

Highlights

Factory orders rose 1.9 percent in a March report that is widely mixed yet fundamentally favorable. The least favorable reading in the report is a modest 0.3 percent rise when excluding transportation durables where however gains for aircraft, especially during the 737 Max grounding, are very welcome as was a strong gain in car and truck orders. The best news in the report is a 1.4 percent surge in orders of core capital goods (nondefense ex-aircraft) that hints strongly at second-quarter acceleration for business investment.

Inventories rose 0.4 percent in the month and though shipments jumped 0.7 percent, the inventory-to-sale ratio held unchanged at 1.36. Unfilled orders rose 0.2 percent and though a modest rate, is nevertheless welcome given what has been a long flat trend for this reading.

The strength of this report was signaled last week by advance data on the durables side of the manufacturing sector, where March orders growth is revised down 1 tenth to a nevertheless very sharp 2.6 percent gain. Nondurables are the fresh information in the report and they rose a strong 1.1 percent in March in a gain tied in part to higher prices for petroleum and related products.

The President’s tariff war initiated to enhance manufacturing seems to instead be undermining it:

Here we go again. The exporters remain firmly in control, looking to depress domestic consumption and keep wages in check by fear mongering about the public debt has not abated:

Japan sales tax to rise as planned

(Nikkei) Japan will raise the 8% consumption tax to 10% as scheduled in October, barring a major financial crisis, a top official in the ruling party told Nikkei. “I haven’t heard anyone say that we could see something on the scale of the Lehman shock,” Katsunobu Kato, head of the Liberal Democratic Party’s General Council, said Wednesday. “It’s appropriate for us to proceed as planned.” Prime Minister Shinzo Abe decided to delay planned increases in 2014 and 2016. This time, he has said the government will go through with the increase, barring a disruption on par with the 2008 crisis.

Global trade deceleration:

Hong Kong’s Q1 growth slips to slowest in a decade

(Nikkei) Hong Kong’s real gross domestic product rose 0.5% on the year in the January-March quarter. The economy expanded at the slowest rate since July-September 2009, and decelerated markedly from a 1.2% increase reported for the fourth quarter of 2018. Consumption edged up 0.1% on the year last quarter, compared with a 2.7% gain in October-December. Exports of goods fell 4.2%, while imports dropped 4.6%. Rapid growth in January-March 2018, which came to 4.6%, also left less room for improvement, according to the spokesperson.

How about this!!!

https://www.perdue.senate.gov/imo/media/doc/MMT%20Resolution.pdf

Car sales, HK, China default, capex, EU business lending, EU sentiment, Credit card data

Chinese state company defaults offshore, first time in 20 years

(FT) A Chinese state-owned enterprise from the country’s remote north-west has failed to repay a US dollar bond in Hong Kong, the first offshore default in 20 years and the latest sign investors can no longer rely on Chinese authorities to bail out state groups. Qinghai Provincial Investment Group defaulted on a $10.9m interest payment due on the Hong Kong note on Friday, then missed a separate principal and interest payment on a Rmb20m ($3m) onshore renminbi bond that matured on Monday, according to Caixin.

Tariff Fears Led U.S. Manufacturers to Trim Spending

(WSJ) Private-sector companies said increased tariffs and trade tensions have led them to reduce capital expenditures by an average of 1.2%, according to the Survey of Business Uncertainty. For manufacturers, the impact was larger, with a 4.2% impact on capital expenditures, according to the survey. The Atlanta Fed study finds that a rising proportion of businesses are trimming spending in response to tariff concerns, with 52% either postponing or dropping spending plans in the January survey, compared with 31% in a July questionnaire.

Euro zone business lending growth slows sharply: ECB

(Reuters) Corporate lending expanded by 3.3 percent in January, well below December’s 3.9 percent reading and its post-crisis peak of 4.3 percent hit in September. Credit growth to households meanwhile held steady at 3.2 percent, the ECB data showed. The ECB last month warned that the growth outlook is deteriorating quickly, suggesting that the bloc’s biggest slowdown in half a decade may be longer and deeper than feared. The annual growth rate of the M3 measure of money supply, which often foreshadows future activity, slowed to 3.8 percent from 4.1 percent in December.

Wealth share, Vehicle sales, US retail sales, US trade, German trade, HK index, UK, US Consumer credit

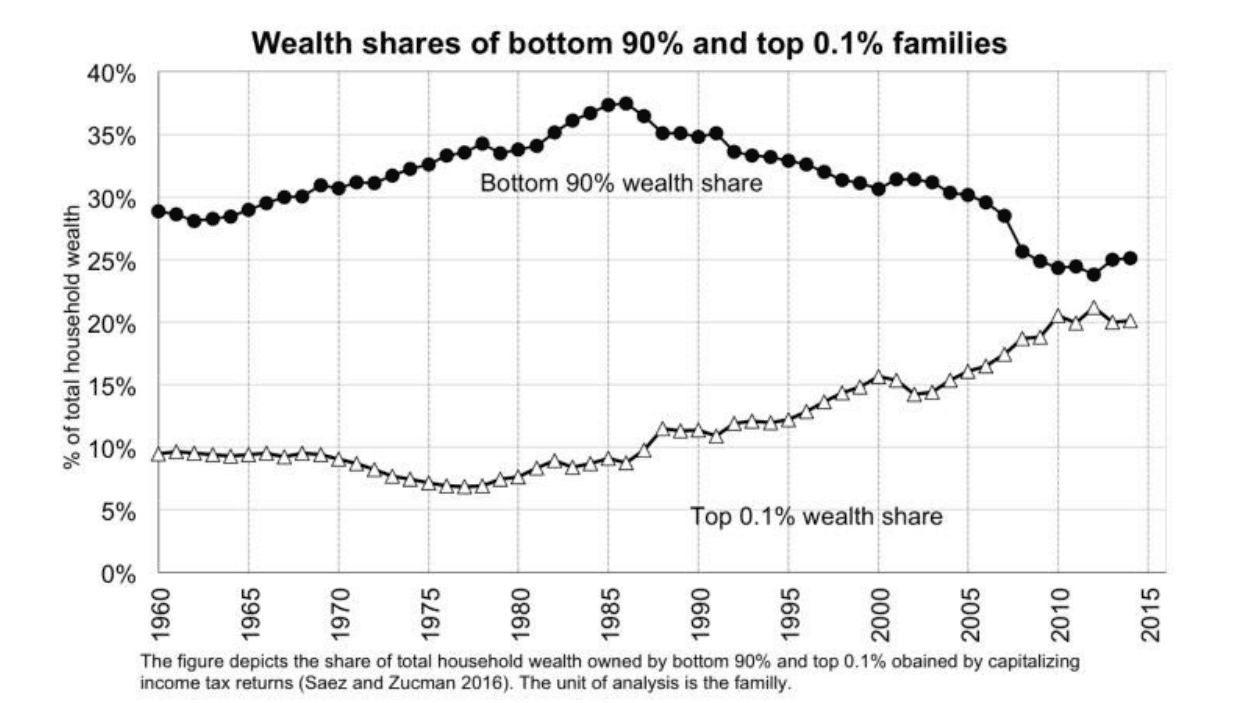
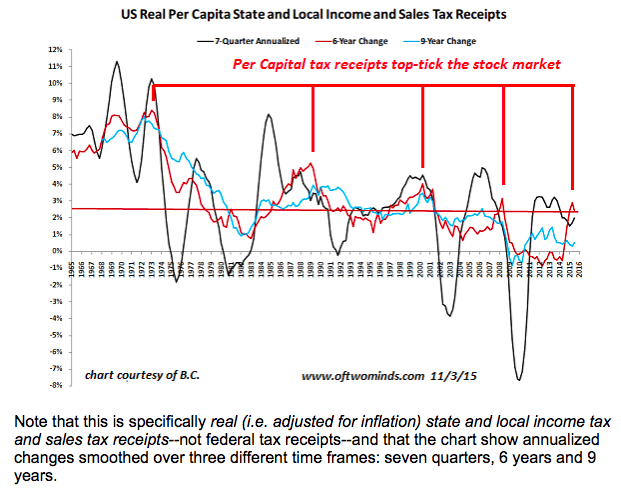
The ‘labor market’ is not a ‘fair game’ as people need to work to eat, and business only needs to hire if it likes the return prospects, so real wages should be expected to remain depressed without some form of outside support, which broke down in the 80’s with globalization policies, and the share of GDP going to capital began to rise:


General weakness continues:


US imports way down, as reflected in general global weakness, and same for weak US exports. And also indicative of US weakness:

Highlights

A sharp pull back in imports, not strength in exports, led a much sharper-than-expected fall in November’s trade deficit to $49.3 billion. Imports, reflecting price declines for petroleum as well as a $4.3 billion drop in consumer goods especially cell phones, fell $7.7 billion in the month while exports also fell, down $1.3 billion and largely reflecting oil-related declines for supplies and materials.

Germany Balance of Trade

The German trade surplus decreased to EUR 13.9 billion in December 2018 from EUR 18.4 billion in the same month a year earlier. It was the smallest trade surplus since January 2016, mainly due to a sharp decline in exports.

Hong Kong Private Sector PMI

The seasonally adjusted Nikkei Hong Kong PMI inched higher to 48.2 in January 2019 from 48.0 in the previous month and marking the tenth straight month of contraction. New orders fell again, accompanied by lower sales to overseas markets, including China. At the same time, output continued to decline, while firms scaled back on purchasing activity and hiring.

Bank of England sees weakest UK outlook since 2009 on Brexit, global slowdown

The Bank of England said Britain faces its weakest economic growth in a decade this year as uncertainty over Brexit mounts and the global economy slows.

United States Consumer Credit Change

Consumer credit in the United States went up by USD 16.55 billion in December 2018, down from an upwardly revised USD 22.41 billion gain in the previous month and slightly below market expectations of a USD 17.0 billion rise. It was the lowest increase in three months. Revolving credit including credit card borrowing climbed USD 1.7 billion, compared to an upwardly revised USD 4.9 billion advance in November. Meantime, non-revolving credit including loans for education and automobiles jumped by USD 14.9 billion, after rising an upwardly revised USD 17.5 billion in the prior month.

News headlines- weakness continues, Mtg apps, Pending home sales, Confidence, ADP employment, MMT articles

Apple says China sales fell 27% last quarter

(Nikkei) Apple’s net sales in greater China, including the mainland, Hong Kong and Taiwan, fell 27% on the year to $13.17 billion for the three months ended Dec. 29 in results announced Tuesday. This marked the first downturn there in six quarters. Combined sales elsewhere, including the U.S., Europe and Japan, grew 1% to $71.1 billion, pointing to China as the central cause of the sluggish quarterly results. Greater China as a share of Apple’s sales shrank to 16% from 20%. Total sales for the quarter dropped 5% to $84.3 billion.

3M Lowers Profit Outlook for 2019

(WSJ) “Some of the things that we were expecting on tariffs haven’t turned out quite as bad as what we were estimating,” Financial Chief Nick Gangestad said. 3M now expects $70 million in higher raw material costs this year, including the effect of tariffs, compared with $100 million previously. But 3M said it was seeing a slowdown in some important markets including China and weaker demand globally in industries such as car and electronics production. The company expects potentially lower revenue growth and earnings of $10.45 to $10.90 a share this year, compared with its prior goal of $10.60 to $11.05 a share.

U.S. auto sales seen down in January: J.D. Power, LMC

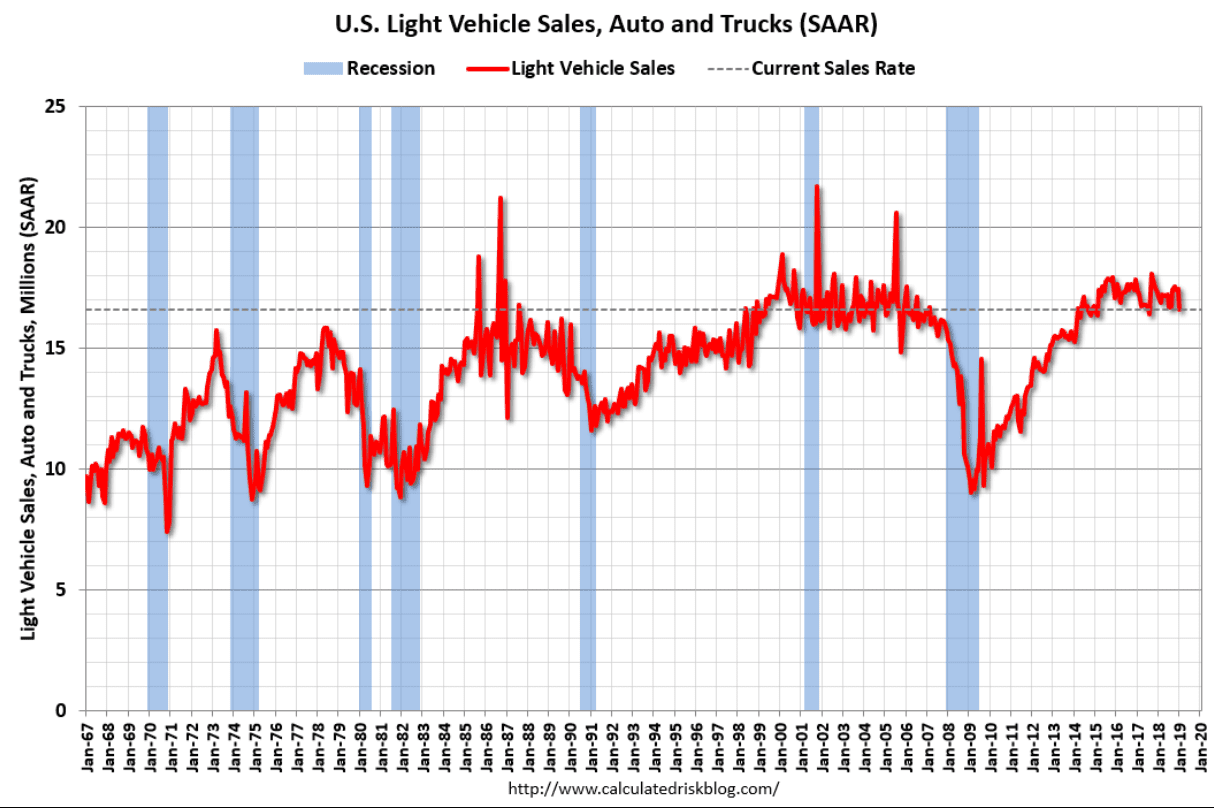
(Reuters) U.S. auto sales in January are expected to fall about 1 percent from the same month in 2018, partly due to uncertainty around government shutdown causing some customers to delay purchases, according to industry consultants J.D. Power and LMC Automotive. Total vehicle sales in January are estimated to be about 1,141,300 vehicles, the consultancies said on Tuesday. Retail sales are expected to fall 2.4 percent to 864,300 vehicles in January, while the overall total seasonally adjusted annualized rate for vehicles is expected to be about 16.8 million vehicles, down 2.3 percent from a year ago.

Highlights

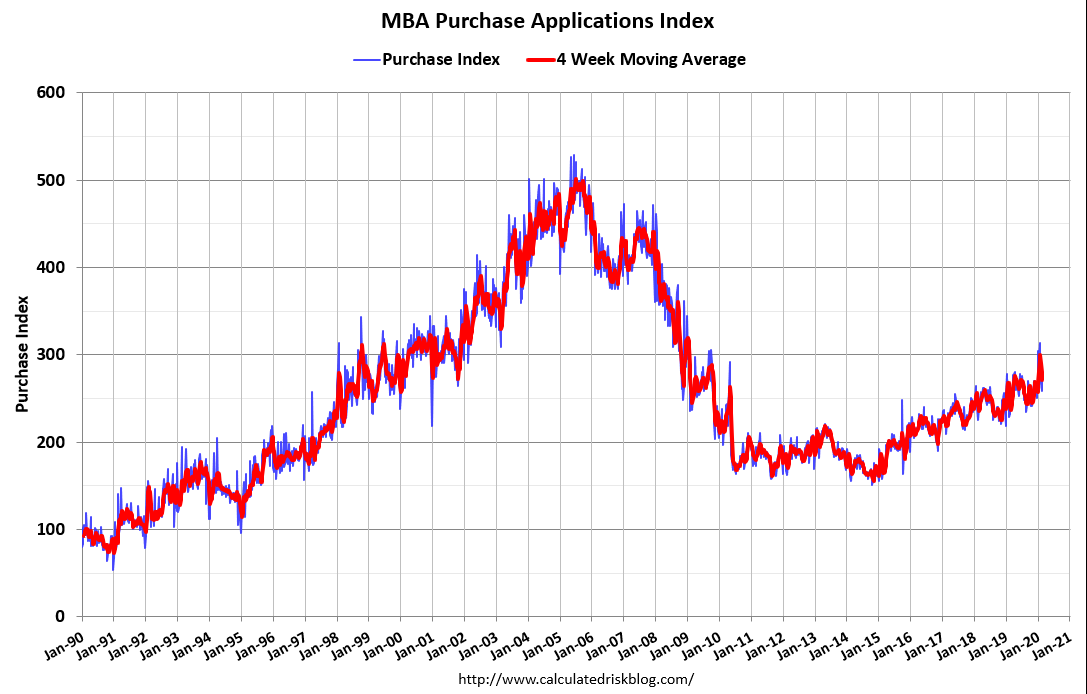
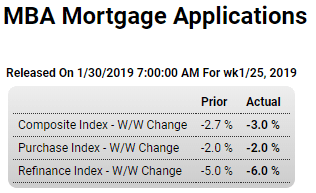
Purchase applications for home mortgages fell a seasonally adjusted 2 percent in the January 25 week, continuing the prior week’s cooling from the highest volume since 2010 seen at the start of the year. Year-on-year, unadjusted purchase applications gave up a 13 percent gain recorded in the prior week and plunged back into negative territory to a level 7 percent lower than a year ago. Applications for refinancing fell 6 percent from the prior week, pulling down the refinance share of mortgage activity by 2.5 percentage points to 42.0 percent. The average interest rate for 30-year fixed rate conforming mortgages ($484,350 or less) rose 1 basis point from the prior week to 4.75 percent. Note that results for the week were affected by the Martin Luther King Jr. Holiday, for which adjustments were made but which may still have distorted some comparisons. Despite the cooling in the last 2 weeks, purchase applications remain about 6 percent above the long term average and could give a boost to the housing market in the upcoming spring buying and selling season.

Way below expectations:

NAR: Pending Home Sales Index Decreased 2.2% in December

Still high but softening rapidly:


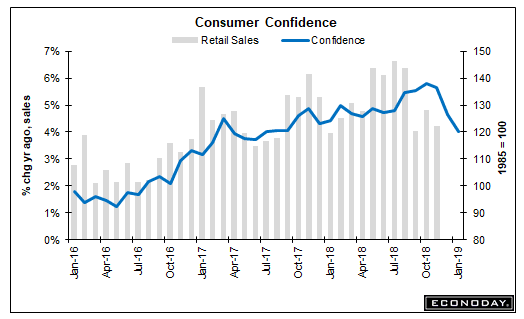
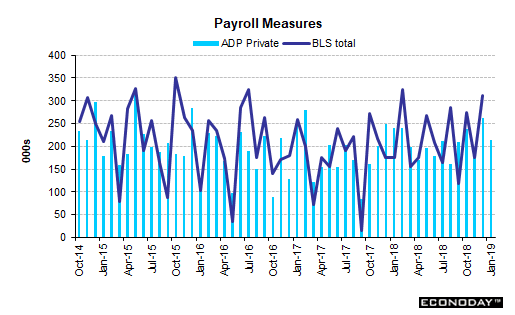
This forecast for Friday’s employment report is down from last month but still reasonably strong:

Highlights

ADP estimates that private payroll growth in Friday’s employment report for January will rise a higher-than-expected 213,000. Forecasters pegged ADP’s January estimate at 174,000 and see Friday’s private payrolls coming in at 160,000 vs 301,000 in December.

These seem to be popping up everywhere, with none of them getting it right… ;)

The Flamboyant Absurdity of ‘Modern Monetary Theory’

Modern Monetary Theory: A Cargo Cult

MMT Or Bust – A Big Government Fantasy For Leftists

Employment chart, China trade, SNB

The red line tends to drag down the blue line, often when deficit spending gets too low:
er-11-9-1

er-11-9-2

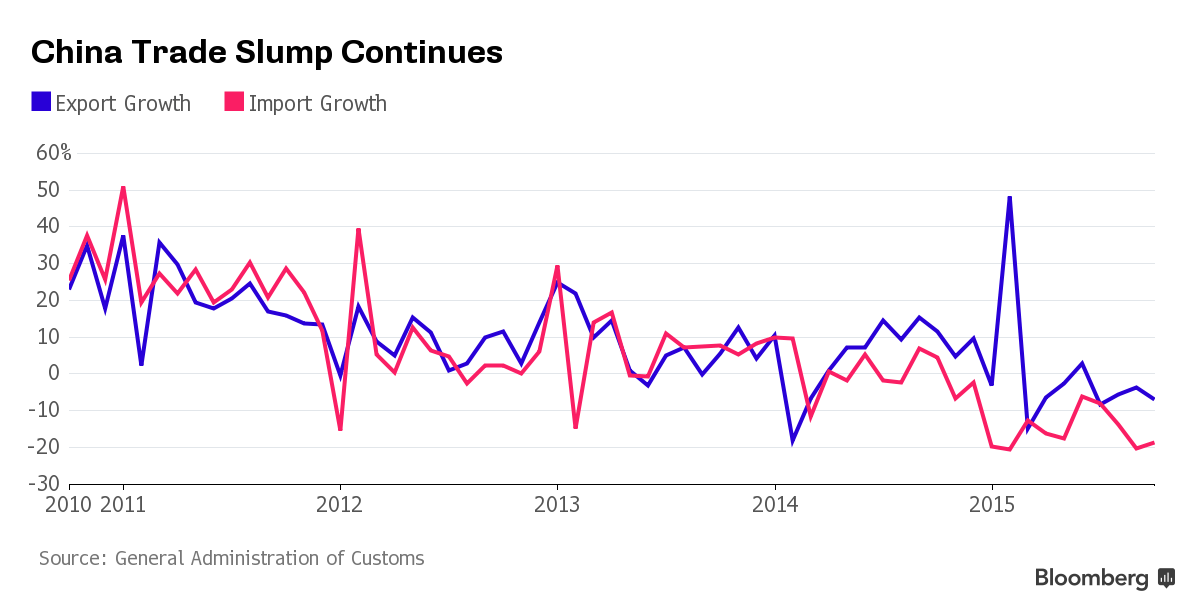
Exports drop again, imports drop more, so the trade surplus grows, and the US should see more imports and fewer exports, while euro zone imports are down which adds to their trade surplus:

China’s Trade Drop Means More Stimulus Measures Are Coming

Exports drop for a fourth month, import declines match record

Trade surplus to help ease currency depreciation pressure

China’s exports fell for a fourth straight month and imports matched a record stretch of declines, signaling that the mounting drag from slower global growth will push policy makers toward expanding stimulus.

Overseas shipments dropped 6.9 percent in October in dollar terms, the customs administration said Sunday, a bigger decline than estimated by all 31 economists in a Bloomberg survey. Weaker demand for coal, iron and other commodities for China’s declining heavy industries helped drag imports down 18.8 percent in dollar terms, leaving a record trade surplus of $61.6 billion.
er-11-9-3
Fiscal stimulus this year includes more infrastructure spending and expanding the lending capacity for the China Development Bank and other policy banks. The PBOC has also made repeated reductions to the amount of reserves required of lenders.

Exports to Japan slumped 9 percent in the first 10 months from a year earlier, while those to the European Union declined 3.7 percent. Shipments to Hong Kong dropped 11.7 percent during the same period.

Slowing Growth

Exports to the U.S., China’s largest trading partner, jumped 5.8 percent in the first 10 months from a year earlier, while those to the Association of Southeast Asian Nations increased 4.2 percent. Shipments to India rose 8.9 percent.

Imports from all 10 of the major trade partners listed by the customs administration declined in the first 10 months. Imports from Australia, a major source of China’s iron ore during the real estate boom, plunged 25.7 percent.

The record trade surplus helped spur a surprise increase in foreign-exchange reserves in October despite an erosion of holdings after the PBOC intervened to boost the yuan. The central bank’s stockpile rose to $3.53 trillion last month from $3.51 trillion at the end of September, the PBOC said Saturday.

“The large trade surplus could offset capital outflow” and curb expectations for the yuan’s depreciation, Liu Ligang, chief Greater China economist at Australia & New Zealand Banking Group Ltd. in Hong Kong, wrote in a note.

Looks like the Swiss National Bank, with about 550 billion in reserves in its portfolio obtained selling it’s currency for euro to hold the peg, may have been selling some of those euro to buy $ to buy US stocks:

SNB’s Stake in Apple, Microsoft, Exxon Rose in Third Quarter

By Catherine Bosley

Nov 4 (Bloomberg) — The Swiss National Bank owned more shares of Apple Inc., Microsoft Corp. and Exxon Mobil Corp. in the third

quarter, taking its U.S. equity portfolio to $38.95 billion.

Switzerland’s central bank held 10.3 million shares in the iPhone maker on Sept. 30, according to a regulatory filing made to the U.S. Securities and Exchange Commission and published on Wednesday. That compares with 9.4 million shares at the end of June, an increase of nearly 10 percent.

The SNB’s stake in Exxon rose by a similar extent, while in Microsoft it registered an increase of just over 9 percent.

labor market index, consumer credit, China trade, BIS on oil and debt

This is the Fed’s new indicator:

Labor Market Conditions Index
lm-conditions
Definition
The U.S. labor market is large and multifaceted. Often-cited indicators such as the unemployment rate or payroll employment, measure a particular dimension of labor market activity. It is not uncommon for different indicators to send conflicting signals about labor market conditions. The Fed’s research department has created a labor market conditions index (LMCI) based on 19 labor market indicators. It is not an official report. However, the monthly publication is carefully noted by Fed Chair Janet Yellen and has gained market attention.

Misleading at best as the two month average was just that, average:

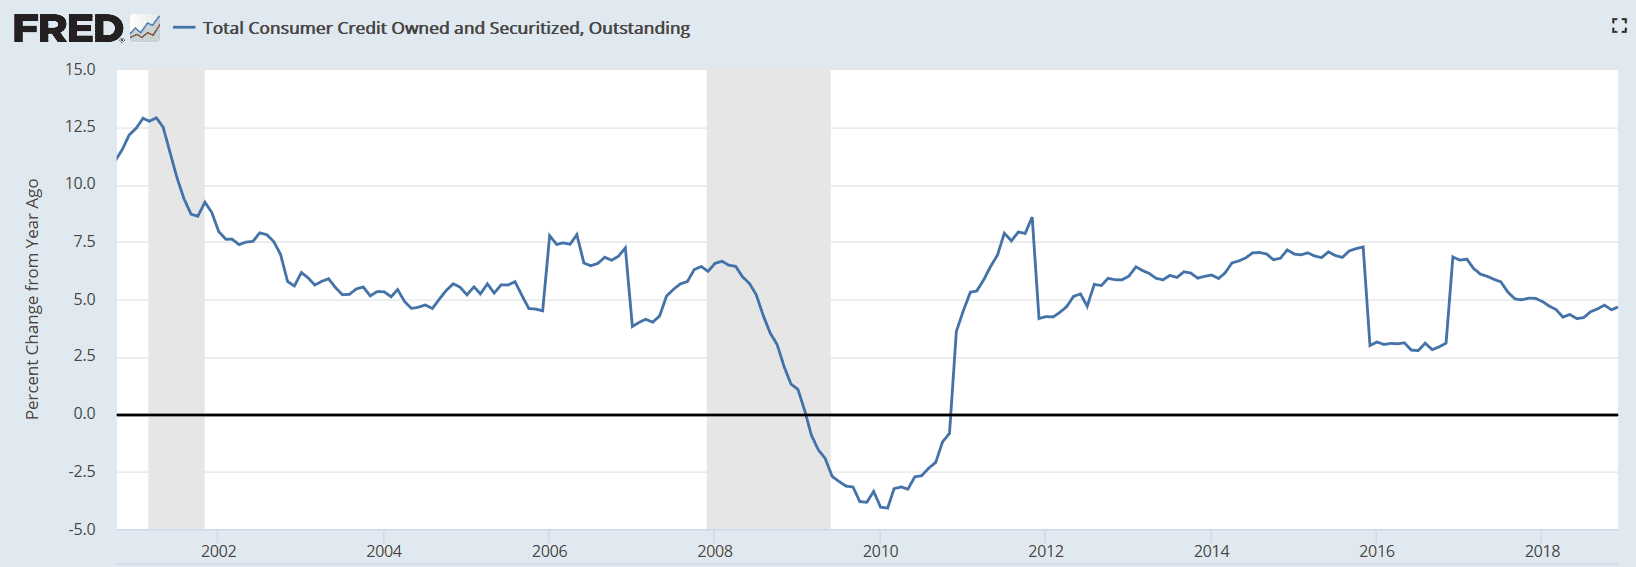
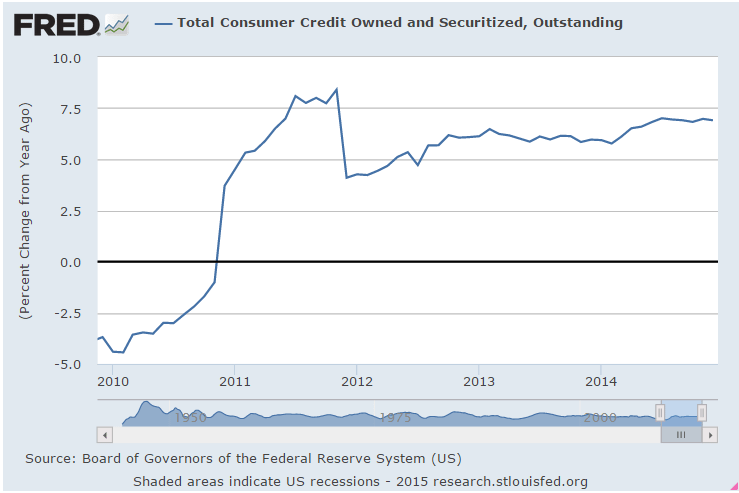
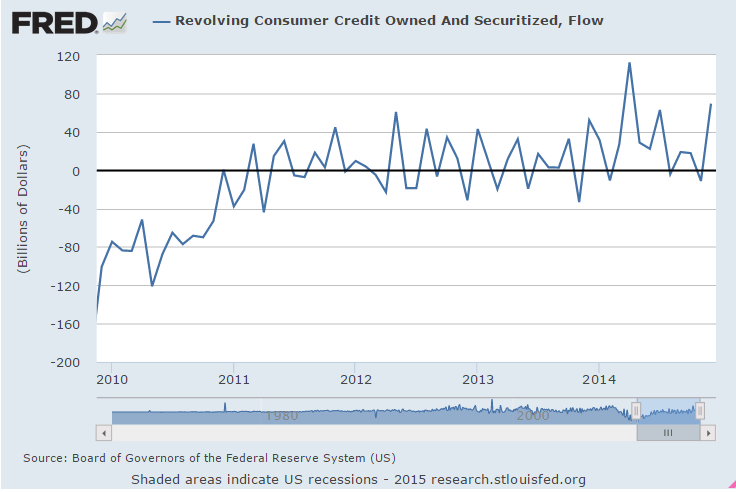
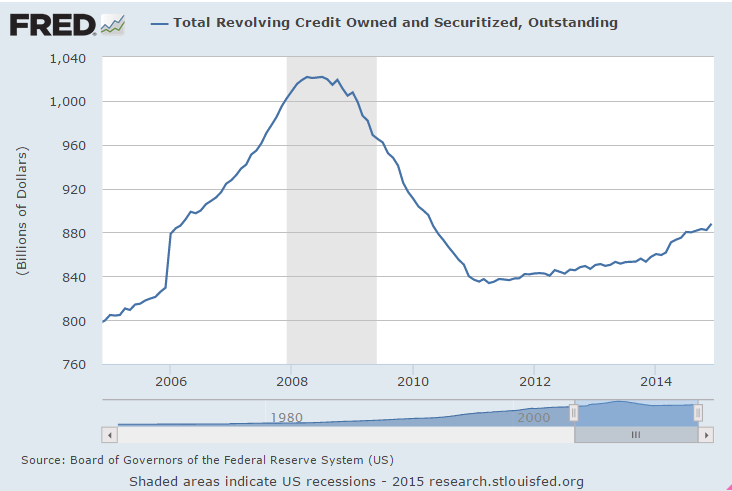
Consumers swipe way to largest increase in revolving credit since March (WSJ) Total outstanding consumer credit expanded at a 5.37% seasonally adjusted annual rate to $3.31 trillion in December. That was a slight acceleration from November’s 4.92% gain. Revolving credit grew at a 7.85% pace in December, a turnaround from November’s 1.28% decline. December’s expansion in revolving credit was the largest since March. Nonrevolving credit, such as auto and student loans, grew at a 4.46% pace during the month, the smallest monthly increase since October 2011. November’s nonrevolving balances grew 7.21%. Revolving credit tends to be volatile, but nonrevolving credit has consistently expanded since August 2011.

No acceleration in growth whatsoever:
cc-2-9-1
The revolving is volatile but doesn’t look to be going anywhere:
cc-2-9-2

cc-2-9-3

January data always suspect but sometimes indicative:

China’s imports slump, capping dismal January trade performance (Reuters) China exports fell 3.3 percent in January from year-ago levels while imports tumbled 19.9 percent. Last year the new year holiday idled factories and financial markets for a week in January, but this year the holiday comes in late February and January was a full month of business as usual. Coal imports dropped nearly 40 percent to 16.78 million tonnes, down from December’s 27.22 million tones. Crude oil imports slid by 7.9 percent in volume terms. While exports to the United States rose by 4.8 percent year-on-year to $35 billion, exports to the European Union slid 4.6 percent to $33 billion in the same period. Exports to Hong Kong, South Korea and Japan were also down, with exports to Japan slumping over 20 percent.

China’s Exports Post Surprise Drop in January (WSJ) Exports fell 3.3% in January from a year earlier, a sharp deterioration from December’s 9.7% rise. In January, exports to Southeast Asia and the U.S. were stronger, while shipments to the European Union, Japan and Hong Kong were all weaker in dollar terms. In a statement accompanying the trade data, China’s customs authorities said that a survey showed weaker confidence among exporters for the fourth consecutive month. “This shows that exports will be facing downward pressure in the first quarter as well as the beginning of the second quarter,” the statement said. Year-ago data for January may have been inflated by over-invoicing by exporters. Exports climbed nearly 11% year over year in January last year.

This is a lot more threatening than I had been led to believe:

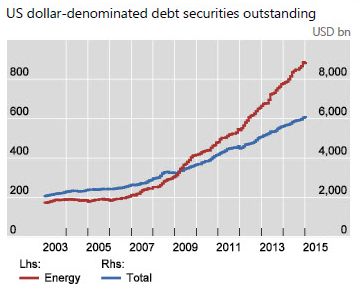
Box: Oil and debt

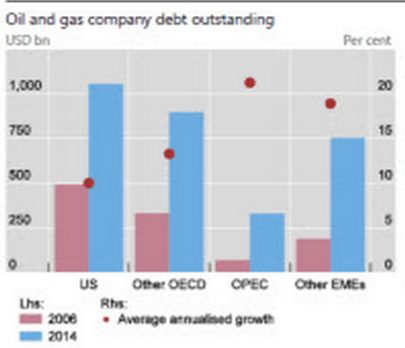
Note the rate of energy debt growth over the last few years, and that these charts don’t include all energy related debt. Looks to have been about 1% of GDP and added about that much plus ‘multipliers’, filling in for the tax hikes and sequesters of 2013.

And now it’s over.

Two things as price fell in half from $100/barrel.

1. Credit expansion slows and maybe reverses.

2. The value of the collateral behind the loans has been halved, which is highly problematic for the lenders.
cc-2-9-4
cc-2-9-5
These are just initial BIS findings. The full report comes out in March.

And not to forget there’s now a new King of Saudia Arabia who decides what the price will be.