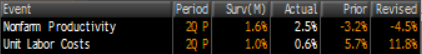
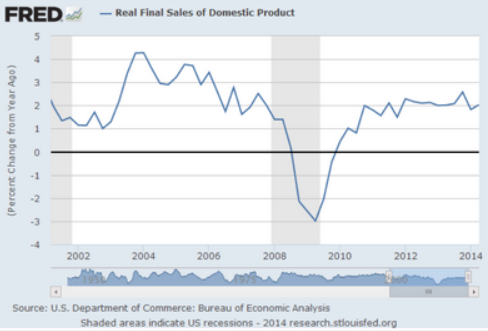
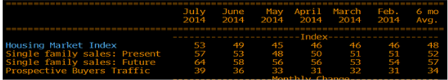
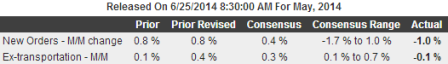
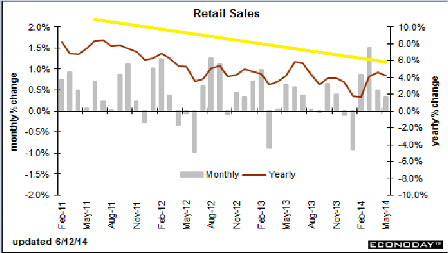
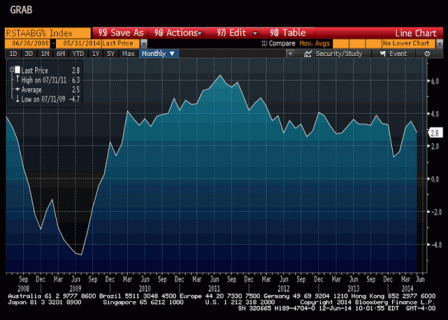
Growth decelerating for 3 consecutive months:
Highlights
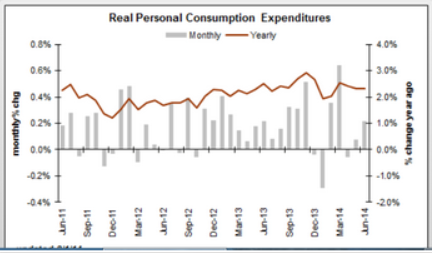
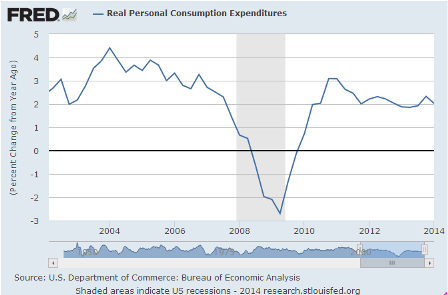
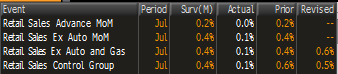
Retail sales disappointed for a second month in a row. Retail sales were flat in July, following a 0.2 percent gain the month before (originally up 0.2 percent). Analysts forecast for a 0.2 percent rise in July.Motor vehicles slipped 0.2 percent, following a decrease of 0.3 percent in June. Excluding motor vehicles, sales edged up 0.1 percent, following an increase of 0.4 percent in June. Forecasts were for 0.4 percent. Excluding motor vehicles and gasoline, sales nudged up 0.1 percent in July after jumping 0.6 percent the prior month. The median market forecast for July was for 0.3 percent.
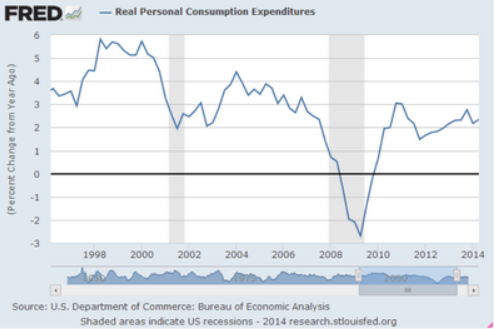
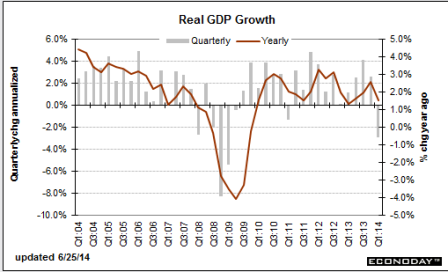
While consumer spending was healthy in the second quarter, that does not appear to be the case for the third quarter based on July data.
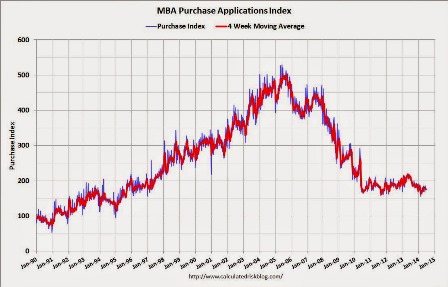
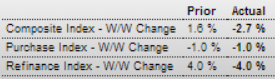
Mtg purchase apps down for the week and down 10% year over year:
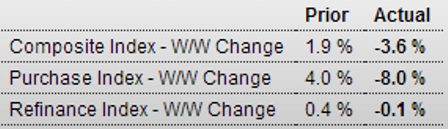
MBA Purchase Applications
Demand for purchase applications remained flat in the August 8 week, down 1.0 percent for the second straight week. Year-on-year, purchase applications are down 10.0 percent. Demand for refinancing is also weak, down 4.0 percent in the week. The declines come despite a dip in mortgage rates where the average 30-year mortgage rate for conforming loans ($417,500 or higher) fell 2 basis points to 4.24 percent.
Home Price Growth Slowdown a Mixed Trend for Economy (WSJ) Single-family housing prices rose 4.4% in the year that ended in the second quarter, the slowest annual pace since 2012, according to a report released Tuesday by National Association of Realtors. The association found that median prices for existing single-family homes grew year-over-year in 122 of 173 metropolitan areas it tracked, while prices declined in 47 metro areas. Only 19 areas showed double-digit year-over-year price increases, a substantial drop from the 37 cities that showed such increases in the first quarter.While the median existing single-family home price between the second quarters of 2013 and 2014 rose 7.3% in the West to $297,400, home prices in the Northeast fell 0.9% to $255,500, the report said.
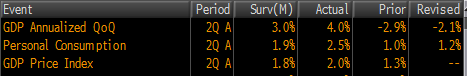
Japan GDP shrinks sharper than after 1997 tax hike (Nikkei) The Cabinet Office said in a preliminary report Wednesday that real gross domestic product for April-June contracted at an annualized rate of 6.8% from the previous quarter. The decline was steeper than in the same quarter of 1997, after sales tax was raised from 3% to 5%. At that time, the economy shrank 3.5%. Economic and Fiscal Policy Minister Akira Amari was unfazed by the big contraction. “The backlash will ease down the road,” he said at a news conference after the GDP results were announced. He said the economy will return to a mild recovery path after summer. “Production shifts to overseas are well underway,” said Amari, indicating that the export decline this time is a long-term structural trend.
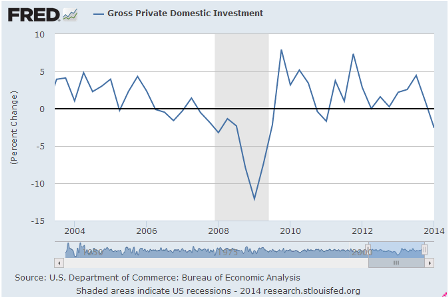
China July property investment slows, sales drop sharply (Reuters) Property investment grew 13.7 percent in the first seven months from a year ago, down from an annual rise of 14.1 percent in the first half. Newly started property construction dropped 12.8 percent in the January to July period from the same time a year ago, though the decline easing from an annual drop of 16.4 percent in the first six months. Meanwhile, property sales dropped 16.3 percent in July in terms of floor space, according to Reuters calculations based on official data. That compared with a 0.2 annual drop in June. The NBS data showed mortgage loans fell 3.7 percent in the first seven months of 2014, unchanged from the first half.
Surprisingly weak China July money data cast doubts on recovery’s durability (Reuters) China’s total social financing (TSF) aggregate fell to 273.1 billion yuan ($44.34 billion) in July, about one seventh of that in June. The People’s Bank of China took the unusual step of issuing a statement immediately after the data, reassuring markets that credit and financing growth was still reasonable and that it had not changed its monetary policy. Non-performing loans have now risen for 11 straight quarters, the central bank’s statement said. Chinese banks made 385.2 billion yuan ($62.53 billion) worth of new yuan loans in July, down sharply from 1.08 trillion yuan in June and well below expectations of 727.5 billion yuan, central bank data showed on Wednesday.–
Overly tight fiscal globally continues to put the squeeze on output and employment.
This email is going to pmc donors in advance of being posted on my website.
If you wish to be removed from this list just let me know thanks!