Visa on consumer spending, GDP, Consumer sentiment, Greece update, Personal income, Employment costs

Visa quantifies impact to consumer spending from lower gas prices (from its earnings call Thurs night) –

US fuel prices are down ~30% since June. The drop amounts to ~$60/month for the avg. consumer according to our survey. Approximately 50% of the savings are being saved, 25% is being used to pay down debt & ~25% is being spent in other discretionary categories including grocery, clothing & restaurants. As we look forward, we would anticipate the savings will accumulate & ultimately we’ll see more spend in the discretionary categories including higher ticket items (i.e. home improvement, electronics, travel and entertainment)

No sign of ‘acceleration’ here but continues to be operating under the previously discussed macro constraint with regard to the need for agents spending more than their incomes to offset those spending less than their incomes in the context of lower federal deficits. Moreover, the drop in oil prices that has led to a drop in capital expenditures removes what had been the marginal support for even the modest growth we’ve been seeing, and not the reversal of data I highlighted previously as subject to reversal, and the Q4 inventory build should reverse in Q1:

GDP
eco-release-1-30-1
Highlights
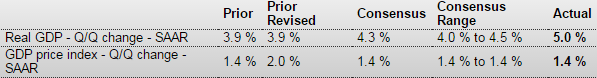
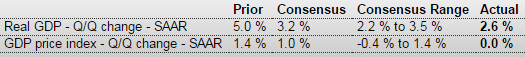
The advance estimate for fourth quarter GDP growth disappointed with a 2.6 percent figure versus analysts’ estimate of 3.2 percent and following 5.0 percent for the third quarter.

Final sales of domestic product slowed to 1.8 percent, following a 5.0 percent jump in the third quarter. Final sales to domestic purchasers eased to 2.8 percent from 4.1 percent in the third quarter.

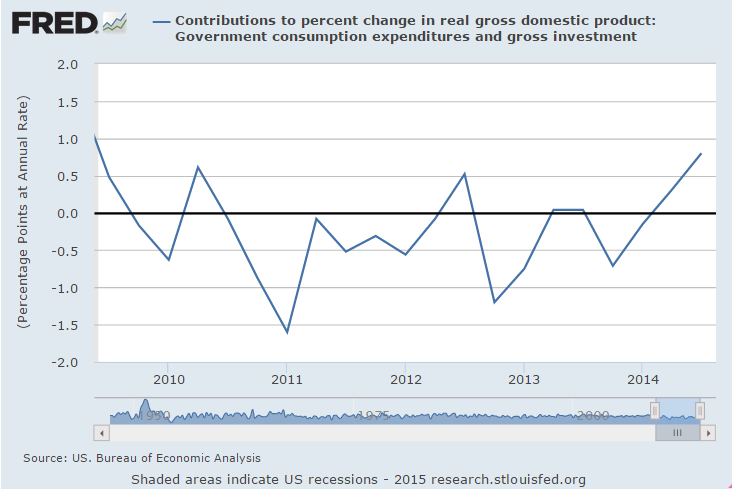
The increase in real GDP in the fourth quarter reflected positive contributions from personal consumption expenditures, private inventory investment, exports, nonresidential fixed investment, state and local government spending, and residential fixed investment that were partly offset by a negative contribution from federal government spending. Imports, which are a subtraction in the calculation of GDP, increased.

The deceleration in real GDP growth in the fourth quarter primarily reflected an upturn in imports, a downturn in federal government spending, and decelerations in nonresidential fixed investment and in exports that were partly offset by an upturn in private inventory investment and an acceleration in PCEs. PCE growth posted at 4.3 percent in the fourth quarter versus 3.2 percent the prior quarter. Inventories rose $113.1 billion, compared to $82.2 billion in the third quarter.

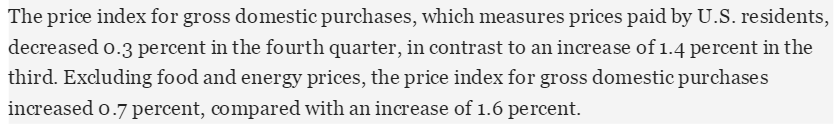
On the price front, the chain-weighted price index was unchanged, compared to the1.4 percent rise in the third quarter. Market expectations were for a 1.0 percent gain. The core chain index, excluding food and energy, eased to 0.7 percent from 1.7 percent in the third quarter.

From the BEA:

eco-release-1-30-15

eco-release-1-30-2
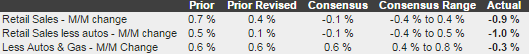
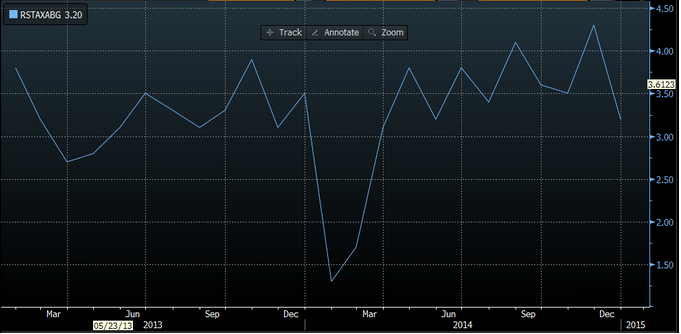
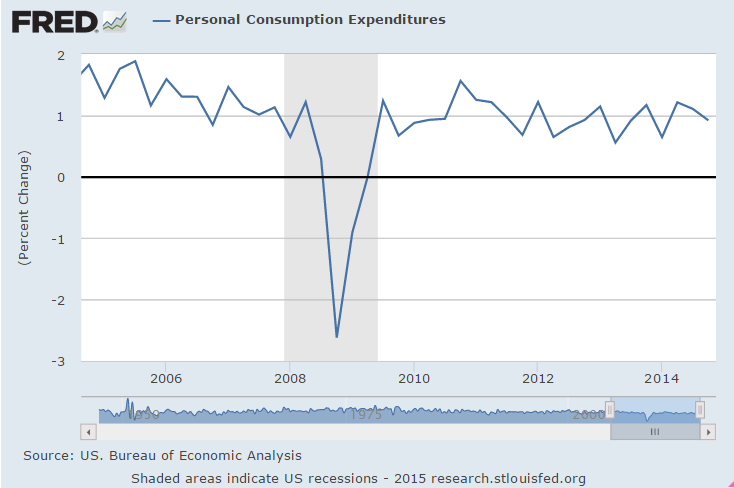
The growth of actual $ spent by people in fact grew at a lower rate, reinforcing the narrative that the ‘consumer savings’ was not being spent. But it also further reinforces my narrative that at the macro level there is no net savings, as for every agent spending less there are other agents getting exactly that much less income.

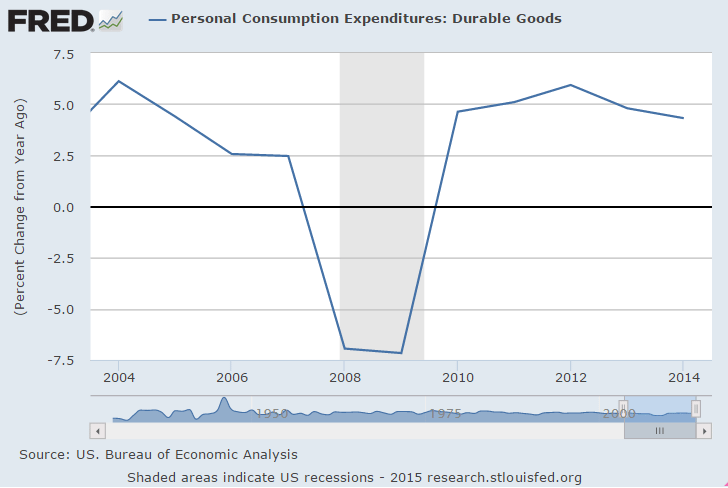
The first chart is the change in actual $ spent:
eco-release-1-30-3
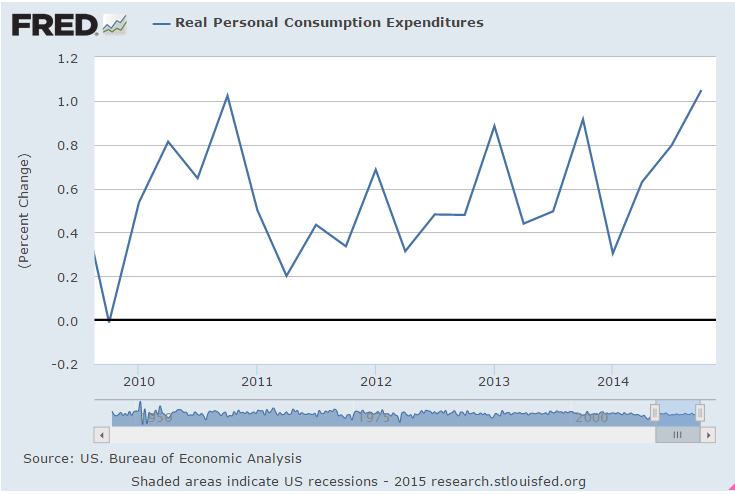
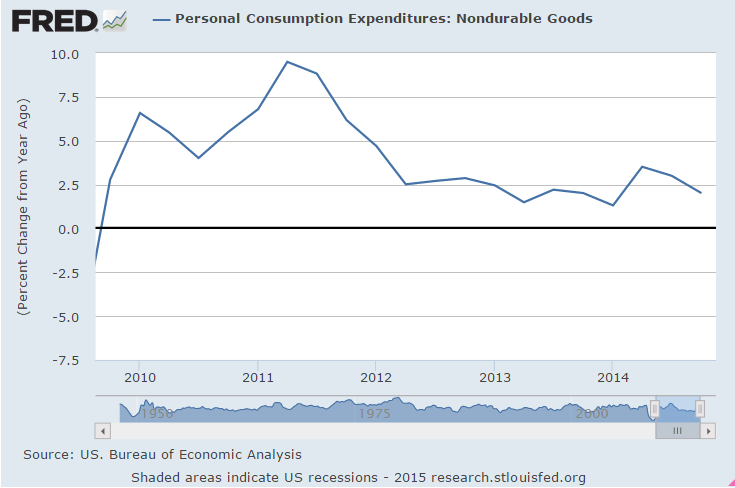
This second chart is adjusted for inflation, indicating the slower growth in actual dollars spent none the less resulted in a faster growth of ‘real’ purchases. Keep in mind, however, the inflation adjustment methodology is necessarily highly problematic at best with quite a bit of volatility in the short term, so Q1 will likely show a similar reduction in the growth of ‘real’ PCE if oil prices stabilize at current levels:
eco-release-1-30-4
eco-release-1-30-5
eco-release-1-30-6
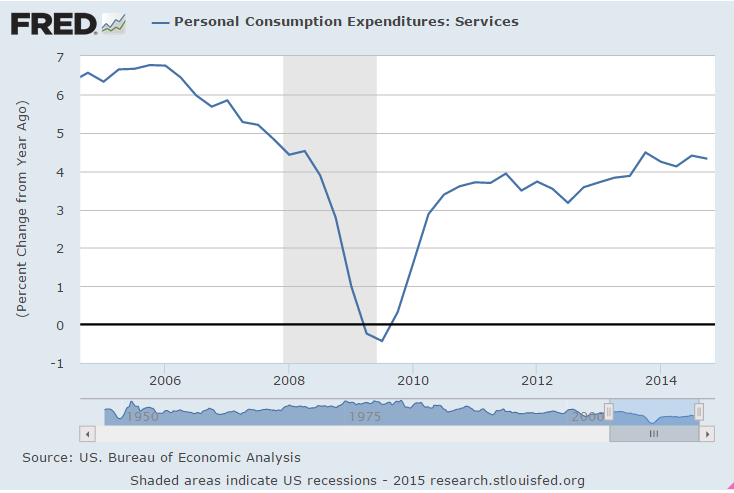
It’s service prices that tend to be ‘sticky’ so they show ‘real’ increases when the price deflator falls, so interesting how the annual growth rate actually came down some:
eco-release-1-30-7
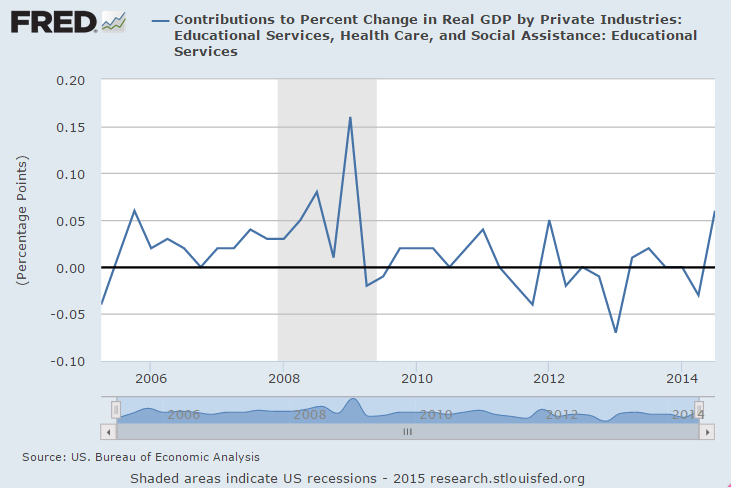
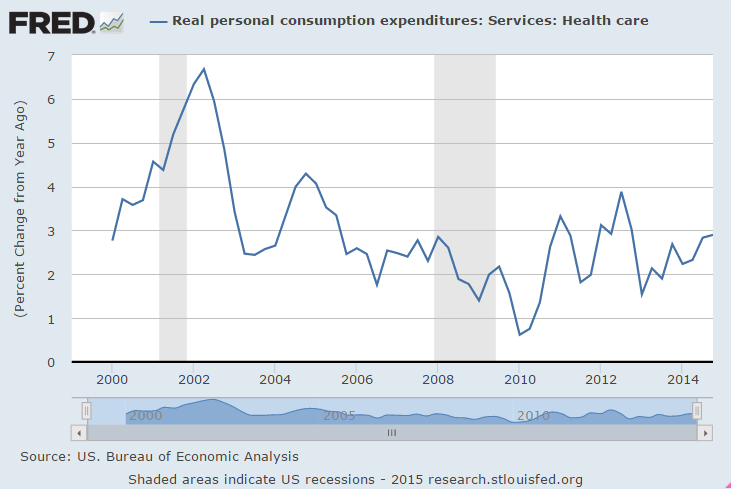
And spending growth on health care remains low enough to not be a political issue:
eco-release-1-30-8
Again, this is one man one vote, not one dollar one vote, and while more people are saving on fuel than are losing income, which is what is driving the chart, the income losses = the income gains:
eco-release-1-30-9
Regarding Greece, I have no idea how this translates into actual policy proposals:

Varoufakis said he had assured Dijsselbloem that Athens planned to implement reforms to make the economy more competitive and have balanced budgets but that it would not accept a “self-fed crisis” of deflation and non-viable debt.

eco-release-1-30-10
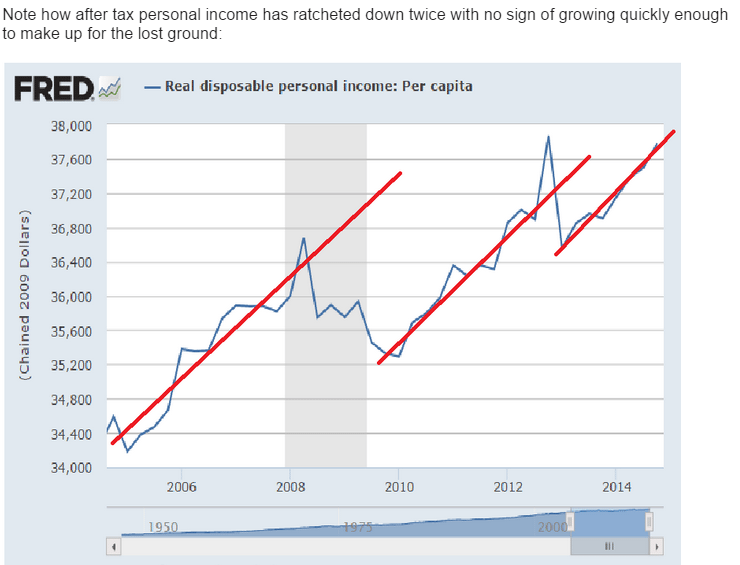
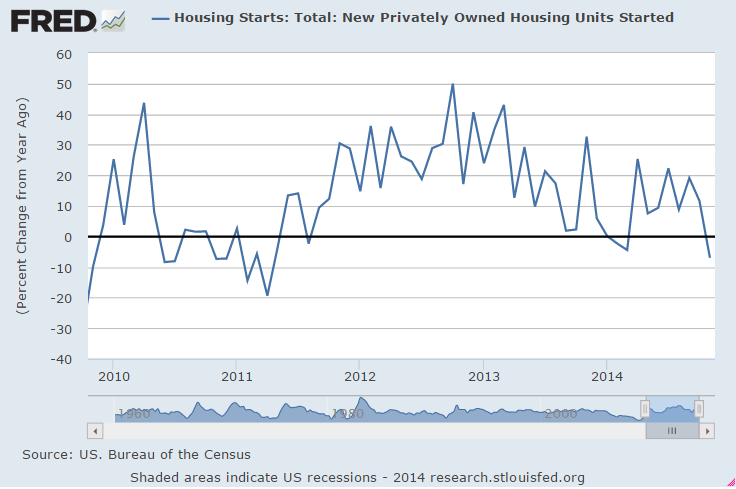
Yes, the growth rate is almost about what it was before, but it would have to grow faster to make up for the lost ground shown above.
eco-release-1-30-12
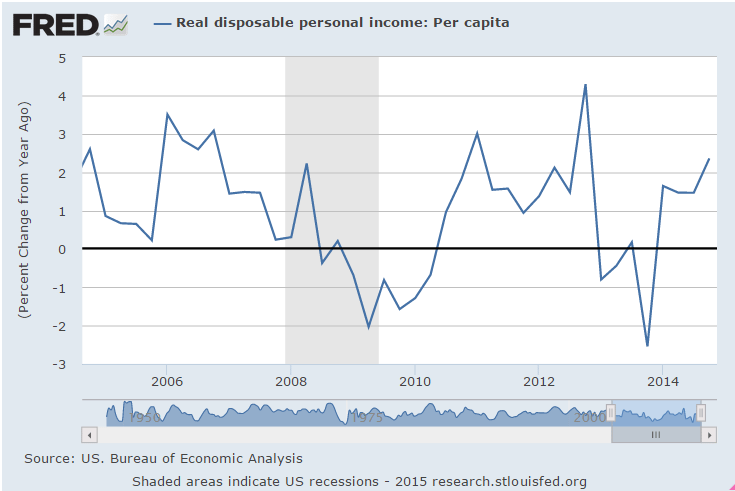
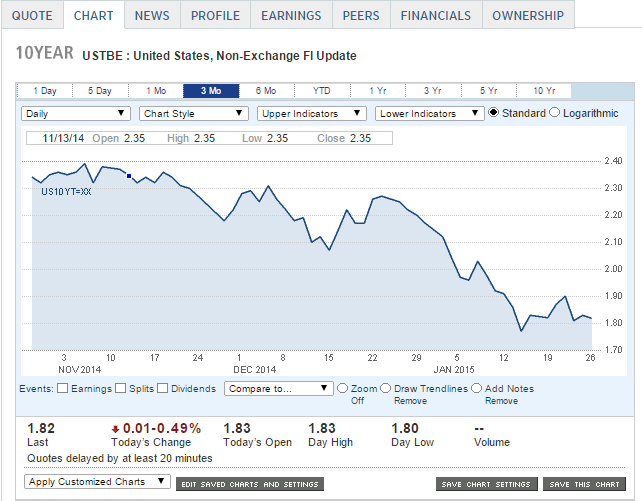
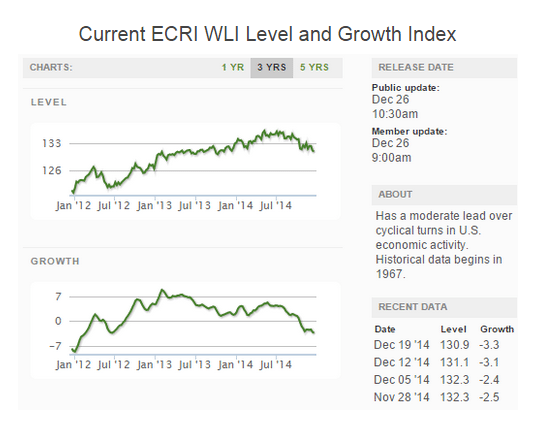
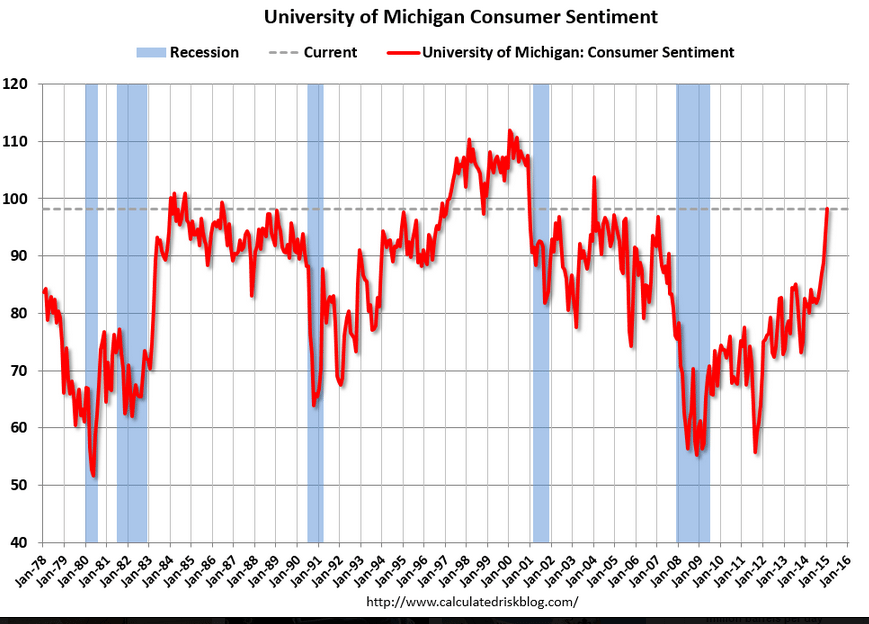
The only cause for alarm is how low this is:

eco-release-1-30-13

eco-release-1-30-14

durable goods, Case Shiller, new home sales, Consumer Confidence, Richmond Fed, PMI services flash, GDP comments, 10 yr vs Fed

Down hard and revisions down hard as well, and year over year growth up less than 1%:

Durable Goods Orders
eco-release-1-27-1
Highlights
Durables orders unexpectedly fell 3.4 percent in December after dropping 2.1 percent in November. Analysts projected a 0.7 percent rise.

Excluding transportation, the core slipped 0.8 in December following a decline of 1.3 percent in November. Market expectations were for a 0.8 percent boost in December. Transportation plunged a monthly 9.2 percent after dropping 3.9 percent in November. Motor vehicles rose 2.7 percent, nondefense aircraft plunged 55.5 percent, and defense aircraft fell 19.9 percent.

Outside of transportation, weakness was mixed. Industries posting gains were fabricated metals, electrical equipment, and “other.” Declines were seen in primary metals, machinery, and computers & electronics.

Nondefense capital goods orders excluding aircraft dropped 0.6 percent after a decline of 0.6 percent in November. Shipments of this series eased 0.2 percent in December after dropping 0.6 percent the month before.

Overall, manufacturing is soft. The outlook is questionable with the recently sharp boost in the value of the dollar.

Equity futures dropped very sharply on the news. However, earnings concerns also weighed on futures.
eco-release-1-27-2

Housing still looking like it’s rolling over?
eco-release-1-27-3

eco-release-1-27-4

New home sales better than expected!

New Home Sales
eco-release-1-27-5

Consumer confidence up as well! But don’t forget this is about ‘head count’. That is, consumer confidence can be up for the hundreds of millions saving $11/week on gas, while the cutbacks from those losing high paying jobs and from capex reductions reduce the confidence of far fewer people initially, but the spending lost to the economy is far higher.

Consumer Confidence
eco-release-1-27-6

Richmond Fed- DC area doing better than Texas…

Richmond Fed Manufacturing Index
eco-release-1-27-7
Recent History Of This Indicator
The Richmond Fed manufacturing index for December picked up to 7 from 4 in November. New orders showed relative strength, at 4 versus November’s 1, but were still on the soft side. Order backlogs, however, showed outright contraction for a second month, at minus 5 vs minus 2 in November. Shipments showed relative strength to November, at 5 vs 1, but, like new orders, were still on the soft side. A definitive sign of strength, however, came from employment which was up 3 points to a very solid 13 in a reading that points to underlying confidence among the region’s manufacturers. Price data were soft in line with declining fuel costs.

PMI Services Flash
eco-release-1-27-8
Highlights
Growth in the nation’s service sector is accelerating but only very slightly this month based on Markit’s sample where the flash index is at 54.0 vs December’s final reading and 10-month low of 53.3 and December’s flash reading of 53.6. The report ties the gain in part to a pick up in consumer spending though new business growth this month continues to moderate and is at a new low in the 5-year history of the report. Amid the slowing, service providers in the sample continue to add to payrolls though at the slowest rate in 9 months. Growth in backlogs is at a 6-month low. Price data show only fractional pressure for inputs and only fractional pricing power for outputs.

Look what spiked up in Q3, and could come down in Q4?
eco-release-1-27-9

eco-release-1-27-10

eco-release-1-27-11
And the 10 year note is now down to 1.75%, which you could say is at odds with the Fed’s forecasts for higher rates.

Wonder who will be correct?

eco-release-1-27-12

FYI:
eco-release-1-27-13

eco-release-1-27-14

Norfolk Southern Revenue Slips on Coal Weakness (WSJ) Norfolk Southern Corp. profit totaled $511 million, off from $513 million in the same quarter a year earlier. Demand for electricity in the railroad’s territory fell 1% last year, executives said. The railroad’s coal revenue fell 15% to $543 million, while its coal volume declined 6%. In the fourth quarter, Norfolk Southern’s fuel-surcharge revenue declined $45 million compared with the same quarter in 2013.

Siemens Profit Hurt by Weak Economy, Oil (WSJ) Net profit in the three months to Dec. 31 fell to €1.08 billion ($1.21 billion) from €1.43 billion in the same period last year, Siemens said on Tuesday. Revenue rose 5% to €17.42 billion, helped by the euro’s weakness against major currencies. Siemens reiterated that it expects to notch up 15% growth in earnings per share in the year to end-September on unchanged revenue. Still, an 11% decline in new orders to €18.01 billion underscored the pressure Siemens is facing as customers placed fewer large orders at its mobility, wind power and renewables business as well as its process industries and drives unit. The power and gas division’s profit margin shrank to 11.3% from 18.2% in the same period last year, Siemens said.

Aso seeks swift passage of extra budget to expand economy (Kyodo) Finance Minister Taro Aso on Monday called for swift passage of the fiscal 2014 supplementary budget to eradicate prolonged deflation and allow Japan’s economy to move onto an expansionary path. “The economy remains on a moderate recovery track, but weakness can be seen in private spending and economic recovery is uneven across regions,” Aso said in a speech. “Immediate passage of the extra budget is necessary,” Aso said, pledging to spur domestic demand by bolstering local economies and supporting households — both plagued by price rises following last April’s consumption tax hike and the weaker yen.

retail sales, import and export prices, business inventories, airline stocks, ECB QE comment

This is not supposed to happen with falling gas prices…

Retail Sales
retail-sales-dec
Highlights
Retail sales disappointed for December. Retail sales in December fell 0.9 percent after posting a 0.4 percent gain in November and a 0.3 percent rise in October. Expectations were for a 0.1 percent decline. The December decrease is the largest negative since January 2014. Both November and October were revised down. Excluding autos, sales decreased 1.0 percent after rising 0.1 percent in November. Analysts expected a 0.1 percent decrease. Excluding both autos and gasoline sales declined 0.3 percent after advancing 0.6 percent in November. Expectations were for a 0.6 percent boost.

The motor vehicle component was weak as expected from the unit new auto sales report. Motor vehicles dipped 0.7 percent in December, following a 1.6 percent gain the month before. Gasoline station sales fell again on lower prices. Sales dropped a sharp 6.5 percent after a 3.0 percent drop in November.

Within the core weakness was broad based, led by miscellaneous store retailers (down 1.9 percent), building materials & garden supplies (down 1.9 percent), electronics & appliance (down 1.6), and general merchandise (down 0.9 percent). Notable gains were seen in furniture & home furnishings (up 0.8 percent) and food services & drinking places (up 0.8 percent).

Today’s retail sales report is a surprise on the downside. But it also is a quandary. Consumer confidence is up and discretionary income is up with gasoline prices down. It is possible that more money is going to services which do not show up in the retail sales report. Probably the biggest positive in the report is the boost in food services & drinking places which is a very discretionary spending item-suggesting a positive mood for the consumer. But looking at the numbers technically, fourth quarter GDP forecasts likely are being shaved.
retail-sales-dec-graph

‘Control Group’: Retail Sales ex food, gas, building materials, auto dealers:
control-group

Retail Sales decreased 0.9% in December

The decrease in December was well below consensus expectations of a 0.1% decrease. Both October and November were revised down.

This was a weak report even after removing the impact of lower gasoline prices.

Import and Export prices:
imp-exp-prices

For November:

business-inventories

Airlines not flying as high as expected either:

airlines

Car sales weaker than expected

This is not good.

Q4 GDP estimates will be revised lower:

Motor Vehicle Sales
dec-vehicle sales
Highlights
Vehicle sales are coming in weaker than expected for December. With the bulk of automakers having already reported, sales of North American made cars and light trucks are tracking at an annual rate of 13.3 million for the month, well down from November’s 14.0 million rate and below the low end of the Econoday consensus of 13.5 million. Please check back at day’s end for the final tallies.

Posted in GDP

ecri still negative

As previously discussed, this is dismissed because of a prior false recession alarm. At that time the deficit was, in my opinion, high enough to support positive growth.

Today’s a different story. The economy always requires deficit spending from some agent to offset the tendency to not spend income (demand leakages). Looks like it’s been the high cost energy sector doing the deficit spending (new bank loans, new bonds, new equity, etc.) to support the modest growth we’ve had, picking up the slack as govt deficit spending receded. And now it looks like the energy related deficit spending is falling as the price of oil falls.

Not good for GDP!
ecri-12-26

Q3 personal income comments

GDP Astounds with 5% Estimate for 3Q 2014

And as mentioned above, real per-capita annual disposable income was revised downward by $29 per year. The new number represents an annualized growth rate of 1.25%. Real disposable income is still down a material -$373 per year from the fourth quarter of 2012 (before the FICA rates normalized) and it is up only 2.23% in total since the second quarter of 2008 — a miserable 0.35% annualized growth rate over the past 6 and a quarter years.

Posted in GDP

Durable Goods orders, Q3 gdp revision

Durables not good, as Q4 deterioration continues:

Durable Goods Orders
dg-nov
dg-nov-graph

GDP for Q3 revised up to 5%. Lots of volatile bits blipped up above their trend growth at the same time, which tends to reverse the next quarter.

Defense was up 16% from Q2, exports of goods up 7.5%, durable goods up 9.2%, and gross private domestic investment up 7.2% for example, while Q3 disposable personal income growth fell to 3.3% from 3.6% in the prior Q3 release.

GDP

gdp-q3-table

gdp-q3-graph

Posted in GDP

Surveys suddenly weakening

Philadelphia Fed Survey
philly-dec

Highlights
Growth is still very strong in the Philly Fed manufacturing region but just not as strong as November’s great surge. The Philly Fed’s general conditions index slowed to 24.5 from 40.8 in November. Outside of November, the latest reading is the strongest since March 2011.

But details in the report do show across-the-board slowing including for new orders, at 15.7 vs November’s 35.7, unfilled orders at 1.5 vs 7.1, employment at 7.2 vs 22.4, and shipments, at 16.1 vs November’s 31.9. It was this 31.9 reading that first signaled what proved to be a great month for manufacturers based on Monday’s November industrial production report where the manufacturing component surged 1.1 percent.

But November looks to be an impossible comparison for the manufacturing sector this month though the rate of growth is still very strong. Other details in today’s report include steady and muted readings for prices and a steady reading for inventories. The 6-month outlook remains very strong though once again less strong than November, at 51.9 vs 57.7.

Today’s report follows Monday’s contractionary reading in the Empire State report and Tuesday’s slowing in the PMI manufacturing flash, a report that offered very similar indications to this report. Watch tomorrow for the manufacturing report from the Kansas City Fed.

PMI Services Flash
pmi
Highlights
Markit’s sample of US service providers reports abrupt slowing in growth so far in December, to 53.6 vs 56.2 in the final November reading and 56.3 in the mid-month November reading. December’s flash is the lowest reading since the heavy weather of February.

Growth in this sample peaked in June and has been slowing the past 6 months, underscored by further moderation this month in new business. The rise in backlog work is the slowest in 5 months. Markit’s sample is still hiring though job creation is the weakest in 8 months. Price pressures are muted reflecting lower fuel-related costs for inputs and lack of pricing power for prices charged.

Today’s report points to tangible slowing for the bulk of the economy going into year end, and it follows weak indications so far this month from the manufacturing economy posted on Monday by the Empire State report and on Tuesday by Markit’s manufacturing sample.

macro update

Let’s look at the Saudi price cuts in the context of the accounting identity that states that for everyone who spent less than his income, another must must have spent more than her income or that much output would not have been sold. ;)

The price cut itself shifts income from producers to consumers. And to the extent that consumers have a higher propensity to spend that gain than the amount the producers will cut spending more output will get sold. So the analysts who are forecasting a net gain for the US economy are hanging their hats on consumers spending more of their fuel savings than producers who lose that much income cutting back on their spending. Not to forget the potential loss of US exports that are sold to non residents spending their incomes earned from oil production, and the new US consumer spending that will be spent on imports. In other words, there may not be a whole lot of difference in total spending.

And there is another factor. While new oil related investment was partially financed from earnings it was also funded via agents ‘spending more than their incomes’ through bank loans and other forms of debt.

That is, part of the ‘spending more than income’ that was critical to the support of US domestic demand was coming from the energy sector. And much of that support is fading fast, as reports of reduced capex, falling rig counts, etc. continue to accelerate.

Additionally, to the same point, a deflationary environment tends to subdue bank lending, as previously discussed. And housing prices, for example, were already softening prior to the oil price cuts.

Therefore, to the extent that the ‘borrowing to spend’ falls back more than the oil consumers vs producers propensity to spend increases, aggregate demand/sales/GDP/employment falls.

Not to mention the oil price itself goes into the GDP calculation to the extent the oil price drop exceeds the GDP deflator.

I was already looking for a weak Q4 and beyond due to the deficit being too small for the current degree of credit expansion, and now this makes it a whole lot worse…

Housing starts, Japan discussion, China, US pmi, store sales

Looks bad to me. Remember, for GDP to grow at last year’s rate, all the pieces on average have to contribute that much. And, as previously discussed, hard to see how starts and sales can grow with cash buyers and mtg purchase apps declining year over year.

The charts look like we are well past this cycle’s peak and headed into negative territory. Not to mention multifamily had been leading the way and those units tend to be smaller/cheaper, so if you were to look at the $ being invested vs prior cycles it would look even worse.

Housing Starts
housing-starts-nov
Highlights
Housing remains on a flat trajectory. Single-family starts and multifamily starts moved in opposite directions. Housing starts dipped 1.6 percent after rebounding 1.7 percent in October. Analysts projected a 1.038 million pace for November. The 1.028 million unit pace was down 7.0 percent on a year-ago basis.

November strength was in the volatile multifamily component. Multifamily starts rebounded 6.7 percent after declining 9.9 percent in October. In contrast, single-family starts fell 5.4 percent in November after gaining 8.0 percent in October.

Housing permits declined a monthly 5.2 percent, following a 5.9 percent jump in October. The 1.035 million unit pace was down 0.2 percent on a year-ago basis. Market expectations were for 1.060 million units annualized.

Overall, recent housing numbers have oscillated notably. October was relatively good but November was not. On average, housing growth appears to be flat to modestly positive.

hs-nov-1

hs-nov-2

hs-nov-3
And how about this headline? Make any sense to you?

hs-headline

Japan’s got issues, but ability to ‘service it’s yen debt’ isn’t one of them, as it’s just a matter of debiting securities accounts at the BOJ/by the BOJ and crediting member bank accounts also at the BOJ. But markets don’t seem to quite believe that:

jgb-cds

Meanwhile, Japan’s ‘depreciate your currency to prosperity’ policy combined with tax hikes on domestic consumers- about as ‘pro exporter at the expense of most everyone else’- is producing the outcomes previously discussed. They include falling real domestic incomes/real standards of living, increased exporter margins/sales/profits, etc. And more to come, seems, under the ‘no matter how much I cut off it’s still too short, said the carpenter’ mantra now practiced globally.

A few anecdotes:

The day after his ruling coalition secured more than two-thirds of the seats in parliament’s lower house, Mr. Abe acknowledged at a news conference that higher stock prices and corporate profits under his administration have yet to translate into worker gains.

“As I toured around the nation during the election, I heard the opinions of ordinary citizens who are suffering from price increases and small-business owners in difficulties due to price hikes in raw materials,” Mr. Abe said, adding that he will draft an economic stimulus package by the end of the year.

For the second year in a row, the conservative prime minister and his historically pro-business Liberal Democratic Party find themselves in the position of imploring corporations to cut into their profits and give workers more. Mr. Abe said he would summon executives and labor leaders to a meeting Tuesday to make his pitch ahead of next spring’s annual wage talks.

The reason: If wages don’t rise as quickly as prices, households could cut back on spending, endangering an economic recovery. There have only been four months since Mr. Abe took power in December 2012 when real wages—the value of paychecks after accounting for inflation—have risen. A weaker yen has made imported food and other goods more expensive, and a rise in the national sales tax to 8% in April from 5% hit consumers further.

While wages have gone up in nominal terms this year, rising prices — partly the result of a consumption tax hike in April — have negated those gains. Adjusted for inflation, total cash earnings fell 2.8% on the year in October, dropping for a 16th straight month. Unions hope that with this month’s lower house election shaping up to be partly a referendum on Abenomics, the prime minister’s plan for ending deflation, Japan will see a serious debate on wage growth.

The corporate sector is coming to terms with the need to raise pay to some degree next spring.

“What is important is escaping the deflation that has persisted for 15 years,” Sadayuki Sakakibara, chairman of the Keidanren business lobby, told reporters Wednesday.

“Companies that have succeeded in growing their profits ought to reflect that success in their wage increases,” he added.

For the second year in a row, Keidanren will explicitly encourage member companies to raise wages in its guidance for the spring’s “shunto” negotiations.


But even as big export-driven manufacturers cruise toward record profits, many smaller companies, particularly those dependent on domestic demand, are suffering the side effects of a weak yen and still waiting for consumer spending to recover from the tax hike.

China continues to go down the tubes and the western educated hot shots keep pushing the tight fiscal and what they think is ‘loose monetary’ policy that’s failed every time it’s been tried in the history of the galaxy:

Operating conditions deteriorate for the first time since May

(Markit) — Flash China Manufacturing PMI slipped to 49.5 in December from 50.0 in November. Manufacturing Output Index ticked up to 49.7 from 49.6. New Orders decreased while New Export Orders increased at a faster rate. “The HSBC China Manufacturing PMI dropped to a seven-month low of 49.5 in the flash reading for December, down from 50.0 in November. Domestic demand slowed considerably and fell below 50 for the first time since April 2014. Price indices also fell sharply. The manufacturing slowdown continues in December and points to a weak ending for 2014. The rising disinflationary pressures, which fundamentally reflect weak demand, warrant further monetary easing in the coming months.”

Not good here either:

PMI Manufacturing Index Flash
dec-pmi

And this came out. Note the year over year trend.

icsc-goldman-dec