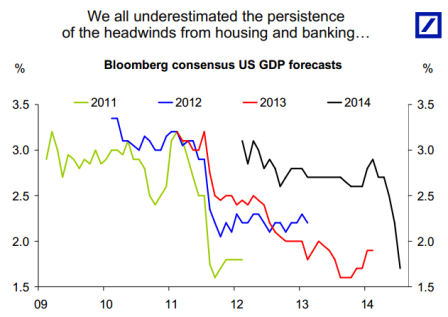
The above chart is real final demand. Finally back to long term average.
A few charts below that show what’s happened to govt under Obama.
A capex related charts not looking so good.
And the auto industry has a bit of inventory to work off.

The above chart is real final demand. Finally back to long term average.
A few charts below that show what’s happened to govt under Obama.
A capex related charts not looking so good.
And the auto industry has a bit of inventory to work off.
Nothing happening on the credit expansion side of consequence that I can detect:
Seems the CBO should stick to simple reporting:
CBO Presents Options for Reducing the Deficit: 2015 to 2024
from the Congressional Budget Office
The Congress faces an array of policy choices as it confronts the prospect of large annual budget deficits and further increases in the already-large government debt that are projected to occur in coming decades under current law. To help inform lawmakers about the budgetary implications of changing federal policies, CBO periodically issues volumes of policy options and their effects on the federal budget, of which this is the most recent. The agency also issues separate reports that present policy options in particular areas.
The bulk of the boost is coming from state and municipal governments. After tightening their budgets for three years following the end of the recession, they began stepping up spending in 2013 and continued to do so this year
Except state taxes are growing faster, a headwind for the private sector.
But income taxes down- not sure why.
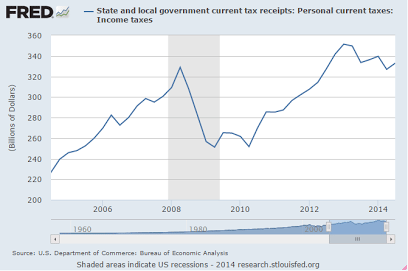
Not sure what this is about either:
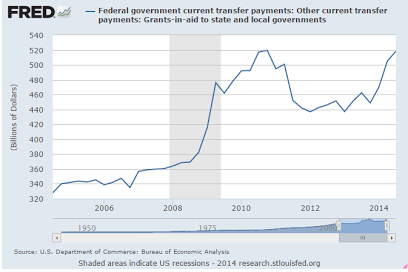
Total tax collections still rising:
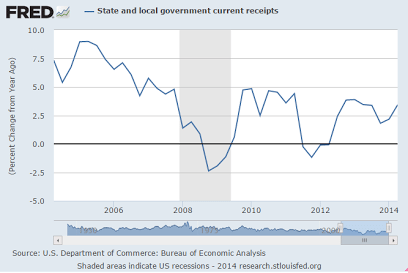
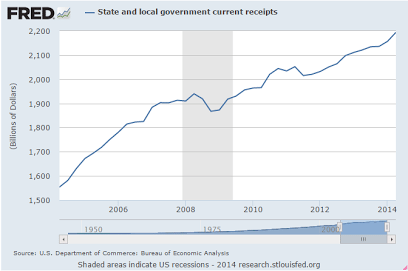
Up some but still historically low:
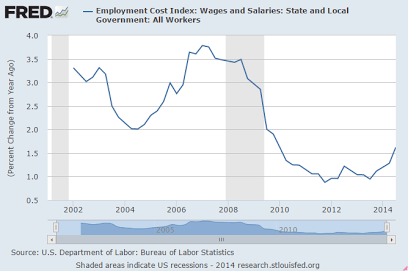
Very minor increases here:
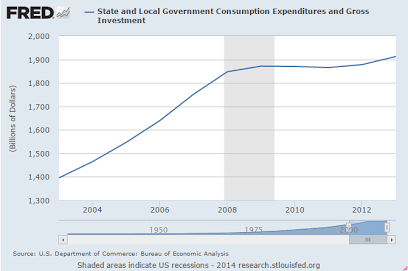
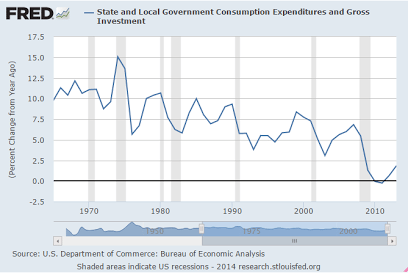
Overall the states are still running deficits and are motivated eliminate them:
Seems universally agreed the labor market is ‘improving’ even as the jobs chart has been downward sloping since the peak in April, wage growth has softened from relatively low levels, and the work week fell back some.
It’s all screaming ‘lack of aggregate demand’ in no uncertain terms. That is, the deficit is too small. And the new Congress is heck bent on deficit reduction and the majority supports the balanced budget amendment to the constitution that needs only a few more states to pass.
So the recent data shows export growth fading, credit expansion fading, housing soft and housing prices in decline, car sales past their peak, retail sales fading, and even industrial production fading.
Not to mention the Saudi price cutting that could easily wipe out the energy related investment component of GDP.
Highlights
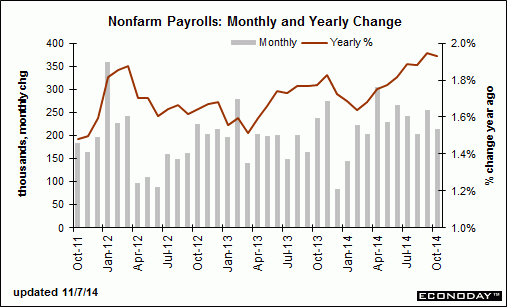
The October employment situation was mixed. Payroll jobs advanced but below expectations. The unemployment rate ticked down again. But wages remained soft. The data will let the Fed remain loose.
Nonfarm payroll jobs advanced 214,000 in October after gaining 256,000 September and 203,000 in August. Net revisions for August and September were up 31,000. The median market forecast for October was for a 240,000 boost.
The unemployment rate dipped to 5.8 percent in October from 5.9 percent in September. Expectations were for 5.9 percent.
Going back to the payroll report, private payrolls grew 209,000 after advancing 244,000 in September. Analysts projected 235,000.
Average hourly earnings edged up 0.1 percent after no change in September. Market forecasts were for 0.2 percent. Average weekly hours ticked up to 34.6 hours versus 34.5 hours in September. Projections were for 34.6 hours.
Essentially, the labor market is improving but slowly and remains soft. Based on today’s data and unless the numbers strengthen faster the Fed likely will not rush increases in policy rates.
A couple of things stand out for either revision or reversal next quarter.
There is no right time for the Fed to raise rates!
Introduction
I reject the belief that economy is strong and operating anywhere near full employment. I also reject the belief that a zero-rate policy is inflationary, supports aggregate demand, or weakens the currency, or that higher rates slow the economy and reduce inflation. Additionally, I reject the mainstream view that employment is materially improving, the output gap is closing, and inflation is rising and returning to the Fed’s targets.
What I am asserting is that the Fed and the mainstream have it backwards with regard to how interest rates interact with the economy. They have it backwards with regard to both the current health of the economy and inflation, and, therefore, their discussion of appropriate monetary policy is entirely confused and inapplicable.
Furthermore, while I recognize that raising rates supports both aggregate demand and inflation, I am categorically against raising rates for that purpose. Instead, I propose making the zero-rate policy permanent and supporting demand with a full FICA tax suspension. And for a stronger price anchor than today’s unemployment policy, I propose a federally funded transition job for anyone willing and able to work to facilitate the transition from unemployment to private sector employment. Together these proposals support far higher levels of employment and price stability.
So when is the appropriate time to raise rates? I say never. Instead, leave the fed funds rate at zero, permanently, by law, and use fiscal adjustments to sustain full employment.
Analysis
My first point of contention with the mainstream is their presumption that low rates are supportive of aggregate demand and inflation through a variety of channels, including credit, expectations, and foreign exchange channels.
The problem with the mainstream credit channel is that it relies on the assumption that lower rates encourage borrowing to spend. At a micro level this seems plausible- people will borrow more to buy houses and cars, and business will borrow more to invest. But it breaks down at the macro level. For every dollar borrowed there is a dollar saved, so any reduction in interest costs for borrowers corresponds to an identical reduction for savers. The only way a rate cut would result in increased borrowing to spend would be if the propensity to spend of borrowers exceeded that of savers. The economy, however, is a large net saver, as government is an equally large net payer of interest on its outstanding debt. Therefore, rate cuts directly reduce government spending and the economy’s private sector’s net interest income. And looking at over two decades of zero-rates and QE in Japan, 6 years in the US, and 5 years of zero and now negative rates in the EU, the data is also telling me that lowering rates does not support demand, output, employment, or inflation. In fact, the only arguments that they do are counter factual- the economy would have been worse without it- or that it just needs more time. By logical extension, zero-rates and QE have also kept us from being overrun by elephants (not withstanding that they lurk in every room).
The second channel is the inflation expectations channel. This presumes that inflation is caused by inflation expectations, with those expecting higher prices to both accelerate purchases and demanding higher wages, and that lower rates will increase inflation expectations.
I don’t agree. First, with the currency itself a simple public monopoly, as a point of logic the price level is necessarily a function of prices paid by government when it spends (and/or collateral demanded when it lends), and not inflation expectations. And the income lost to the economy from reduced government interest payments works to reduce spending, regardless of expectations. Nor is there evidence of the collective effort required for higher expected prices to translate into higher wages. At best, organized demands for higher wages develop only well after the wage share of GDP falls.
Lower rates are further presumed to be supportive through the foreign exchange channel, causing currency depreciation that enhances ‘competitiveness’ via lower real wage costs for exporters along with an increase in inflation expectations from consumers facing higher prices for imports.
In addition to rejecting the inflation expectations channel, I also reject the presumption that lower rates cause currency depreciation and inflation, as does most empirical research. For example, after two decades of 0 rate policies the yen remained problematically strong and inflation problematically low. And the same holds for the euro and $US after many years of near zero-rate policies. In fact, theory and evidence points to the reverse- higher rates tend to weaken a currency and support higher levels of inflation.
There is another aspect to the foreign exchange channel, interest rates, and inflation. The spot and forward price for a non perishable commodity imply all storage costs, including interest expense. Therefore, with a permanent zero-rate policy, and assuming no other storage costs, the spot price of a commodity and its price for delivery any time in the future is the same. However, if rates were, say, 10%, the price of those commodities for delivery in the future would be 10% (annualized) higher. That is, a 10% rate implies a 10% continuous increase in prices, which is the textbook definition of inflation! It is the term structure of risk free rates itself that mirrors a term structure of prices which feeds into both the costs of production as well as the ability to pre-sell at higher prices, thereby establishing, by definition, inflation.
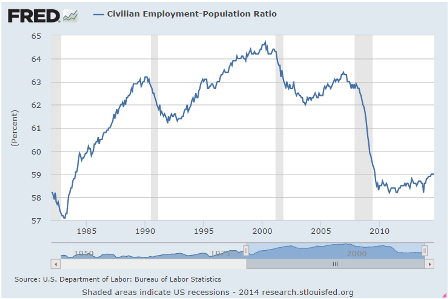
Finally, I see the output gap as being a lot higher than the mainstream does. While the total number of people reported to be working has increased, so has the population. To adjust for that look at the percentage of the population that’s employed, and it’s pretty much gone sideways since 2009, while in every prior recovery it went up at a pretty good clip once things got going:
The mainstream says this drop is all largely structural, meaning people got older or otherwise decided they didn’t want to work and dropped out of the labor force. The data clearly shows that in a good economy this doesn’t happen, and certainly not to this extreme degree. Instead what we are facing is a massive shortage of aggregate demand.
Conclusion
There is no right time for the Fed to raise rates. The economy continues to fail us, and monetary policy is not capable of fixing it. Instead the fed funds rate should be permanently set at zero (further implying the Treasury sell only 3 month t bills), leaving it to Congress to employ fiscal adjustments to meet their employment and price stability mandates.
First this, supporting what I’ve been writing about all along:
Here’s Proof That Congress Has Been Dragging Down The Economy For Years
By Shane Ferro
Oct 8 (Business Insider) — In honor of the new fiscal year, the Brookings Institution released the Fiscal Impact Measure, an interactive chart by senior fellow Louise Sheiner that shows how the balance of government spending and tax revenues have affected US GDP growth.
The takeaway? Fiscal policies have been a drag on economic growth since 2011.
Full size image
And earlier today it was announced that August wholesale sales were down .7%, while inventories were up .7%. This means they produced the same but sold less and the unsold inventory is still there. Not good!
Unfortunately the Fed has the interest rate thing backwards, as in fact rate cuts slow the economy and depress inflation. So with the Fed thinking the economy is too weak to hike rates, they leave rates at 0 which ironically keeps the economy where it is. Not that I would raise rates to help the economy. Instead I’ve proposed fiscal measures, as previously discussed.
Fed Minutes Show Concern About Weak Overseas Growth, Strong Dollar (WSJ) “Some participants expressed concern that the persistent shortfall of economic growth and inflation in the euro area could lead to a further appreciation of the dollar and have adverse effects on the U.S. external sector,” according to the minutes. “Several participants added that slower economic growth in China or Japan or unanticipated events in the Middle East or Ukraine might pose a similar risk.” “Several participants thought that the current forward guidance regarding the federal funds rate suggested a longer period before liftoff, and perhaps also a more gradual increase in the federal funds rate thereafter, than they believed was likely to be appropriate given economic and financial conditions,” the minutes said.
The case for patience strengthens yet further by a consideration of the risks around the outlook. Across GS economics and markets research, we have recently cut our 2015 growth forecasts for China, Germany, and Italy, noted the continued weakness in Japan, and made a further upgrade to our already-bullish dollar views. So far, our analysis suggests that the spillovers from foreign demand weakness and currency appreciation only pose modest risks to US growth and inflation. But at the margin they amplify the asymmetric risks facing monetary policy at the zero bound emphasized by Chicago Fed President Charles Evans. If the FOMC raises the funds rate too late and inflation moves modestly above the 2% target, little is lost. But if the committee hikes too early and has to reverse course, the consequences are potentially more serious given the limited tools available at the zero bound for short-term rates.
Germany not looking good:
German exports plunge by largest amount in five-and-a-half years (Reuters) German exports slumped by 5.8 percent in August, their biggest fall since the height of the global financial crisis in January 2009. The Federal Statistics Office said late-falling summer vacations in some German states had contributed to the fall in both exports and imports. Seasonally adjusted imports falling 1.3 percent on the month, after rising 4.8 percent in July. The trade surplus stood at 17.5 billion euros, down from 22.2 billion euros in July and less than a forecast 18.5 billion euros. Later on Thursday a group of leading economic institutes is poised to sharply cut its forecasts for German growth. The top economic priority of Merkel’s government is to deliver on its promise of a federal budget that is in the black in 2015.
UK peaking?
London house prices fall in Sept. for first time since 2011: RICS (Reuters) The Royal Institution of Chartered Surveyors said prices in London fell for the first time since January 2011. The RICS national balance slid to +30 for September from a downwardly revised +39 in August. The RICS data is based on its members’ views on whether house prices in particular regions have risen or fallen in the past three months. British house prices are around 10 percent higher than a year ago, and house prices in London have risen by more than twice that. Over the next 12 months, they predict prices will rise 1 percent in London and 2 percent in Britain as a whole. Over the next five years, it expects average annual price growth of just under 5 percent.
British Chambers of Commerce warns of ‘alarm bell’ for UK recovery (Reuters) “The strong upsurge in manufacturing at the start of the year appears to have run its course. We may be hearing the first alarm bell for the UK,” said British Chambers of Commerce director-general John Longworth. The BCC said growth in goods exports as well as export orders for goods and services was its lowest since the fourth quarter of 2012. Services exports grew at the slowest rate since the third quarter of 2012. Manufacturers’ growth in domestic sales and orders slowed sharply from a record high in the second quarter to its lowest since the second quarter of 2013. However, sales remained strong in the services sector and confidence stayed high across the board.
Not to forget the stock market is a pretty fair leading indicator.
Some even say it causes what comes next:

Several years ago I began using the analogy of the 10th plague of the Old Testament, the idea being that the EU wouldn’t move away from austerity until it brought down Germany itself. It’s looking like that day is getting a whole lot closer, as austerity has not only damaged Germany’s export markets in the rest of the EU, but has also caused the rest of the EU to become more competitive vs Germany in the external markets, which have themselves been weakened by their own austerity policies.
German industry output plunges most in over 5 years
Oct 7 (Reuters) — German industrial output fell far more than expected in August and posted its biggest drop since the financial crisis in early 2009, Economy Ministry data showed on Tuesday, the latest figures to raise question marks about Europe’s largest economy.
The 4.0 percent month-on-month drop missed the consensus forecast in a Reuters poll for a 1.5 percent decrease and came short even of the lowest forecast for a 3.0 percent fall. It was the biggest drop since a 6.9 percent fall in January 2009.
And they still are?
The idea that the deficit is too small remains a non starter for the mainstream. In the face of all evidence to the contrary, including over 2 decades of it in Japan, they continue to believe ‘monetary policy’/low rates and QE supports aggregate demand.
