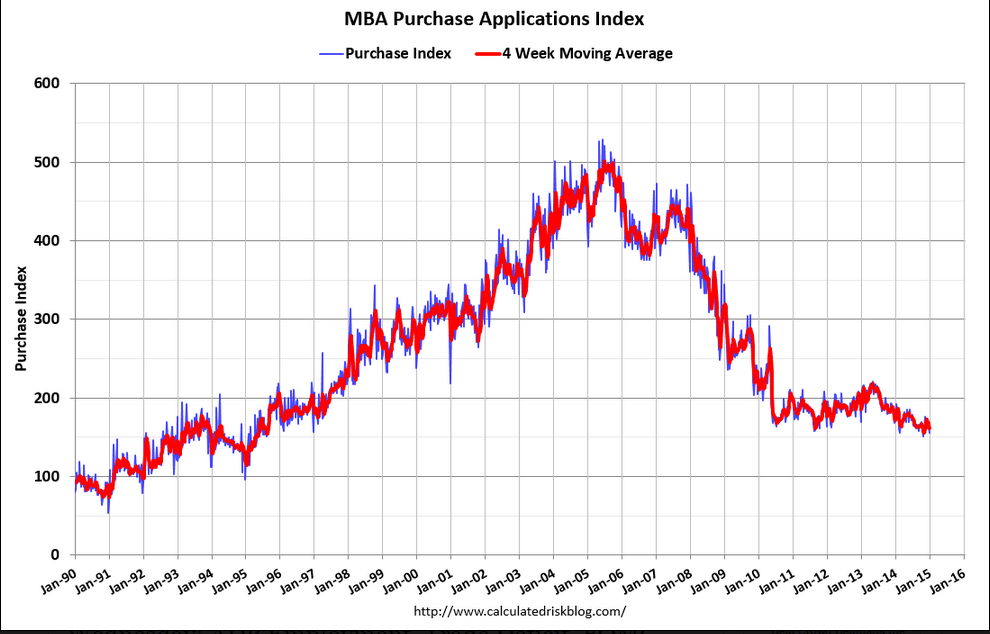
Weaker, and down 8% year over year, even with much lower rates.
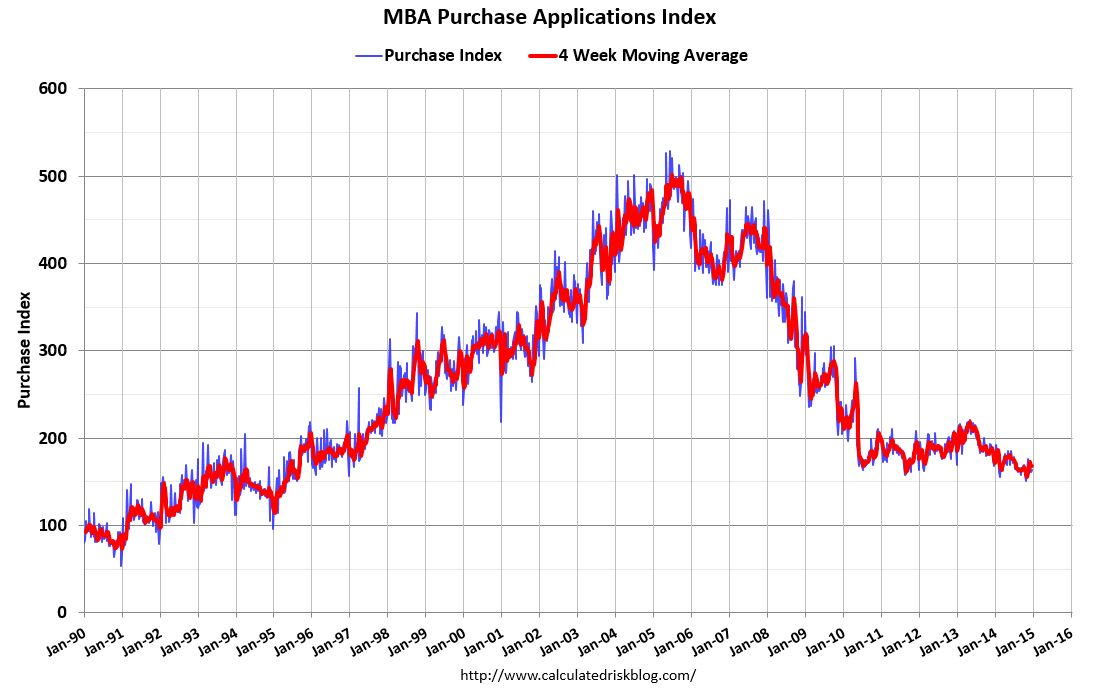
MBA Purchase Applications
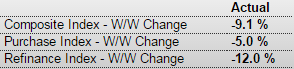
Highlights
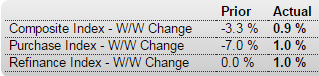
Mortgage application activity fell sharply in the 2 weeks to January 2, down 5.0 percent for purchase applications and down 12.0 percent for refinancing applications. The trend for purchase applications, which offers an indication on underlying home purchases, is clearly negative, at a year-on-year minus 8.0 percent.
The declines come despite low mortgage rates with the average 30-year rate down slightly in the 2-week period to 4.01 percent for conforming loans ($417,000 or less). Note that today’s report covers not the usual 1-week period but, due to a holiday for MBA, a 2-week period.
Remember, this is now a forecast of Friday’s number, and not the ‘core’ ADP employment itself.
ADP Employment Report

Highlights
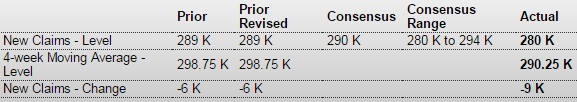
ADP’s estimate for private payroll growth for December is 241,000 vs the Econoday consensus for 235,000 and against ADP’s upwardly revised 227,000 for November (initial estimate 208,000). Turning to government data, the corresponding Econoday consensus for Friday’s jobs report is 238,000 vs November’s 314,000.
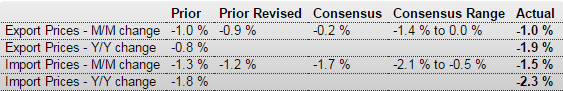
Imports down, but exports down as well, which could be a trend as surveys have been indicating deceleration.
International Trade

Highlights
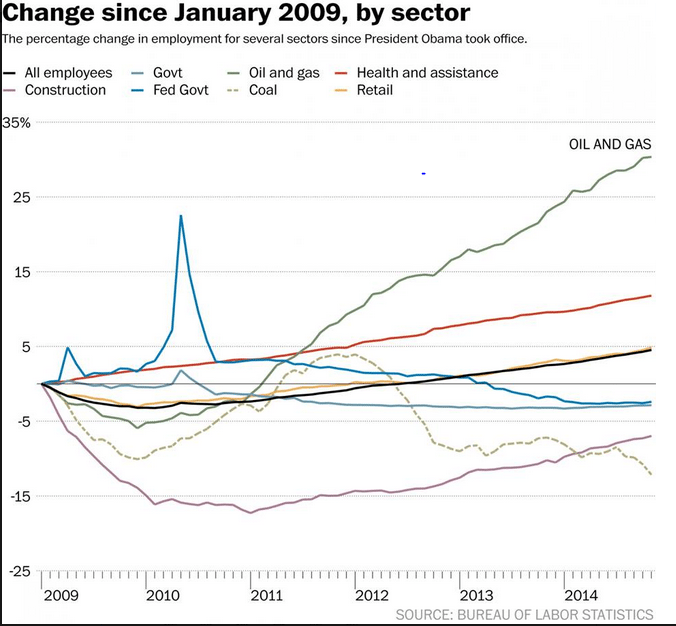
The U.S. trade balance again narrowed and more than expected. And again, improvement was largely due to lower oil prices.
In November, the U.S. trade gap narrowed to $39.0 billion from a revised $42.2 billion in October. Market expectations were for the deficit to narrow to $41.5 billion. Exports were down 1.0 percent after gaining 1.6 percent the month before. But imports declined a sharp 2.2 percent after rising 0.7 percent in October.
Shrinkage in the overall gap was led by the petroleum goods trade gap which dropped to $11.4 billion from $15.2 billion in October. Petroleum imports were down 11.9 percent while exports rose 5.9 percent.
The goods excluding petroleum gap increased to $45.7 billion from $45.2 billion in October. The services surplus was essentially unchanged at $40.4 billion.
On a seasonally adjusted basis, the November figures show surpluses, in billions of dollars, with South and Central America ($4.3) and Brazil ($0.6). Deficits were recorded, in billions of dollars, with China ($29.8), European Union ($12.7), Germany ($6.3), Japan ($5.6), Mexico ($4.4), South Korea ($2.9), Italy ($2.3), India ($1.7), France ($1.6), OPEC ($1.6), Canada ($1.4), Saudi Arabia ($1.3), and United Kingdom ($0.2).
Overall, the November number will likely bump up estimates for fourth quarter GDP growth.