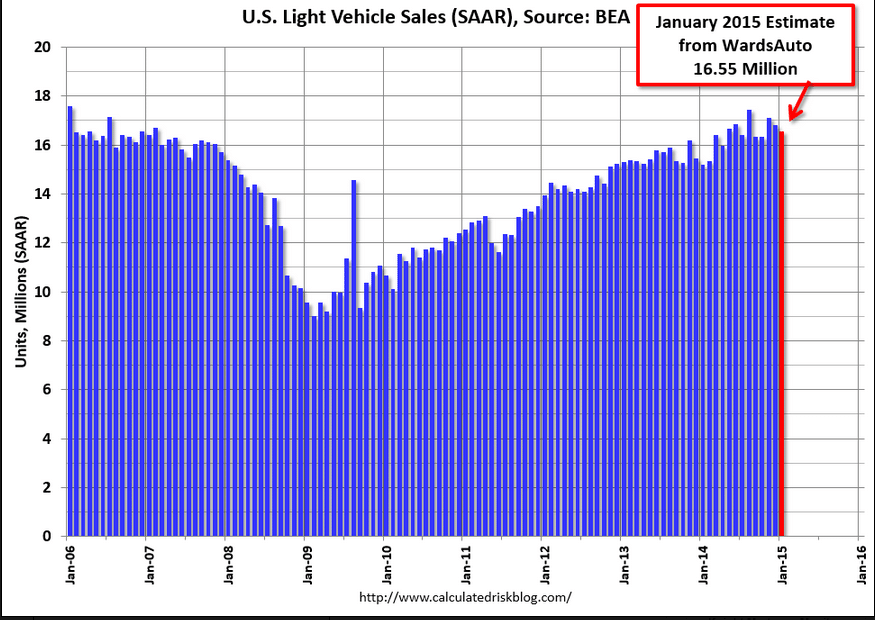
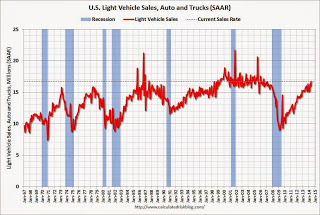
Note the recent downward slope into January when the consumer spending on autos was expected to pick up due to lower fuel prices…
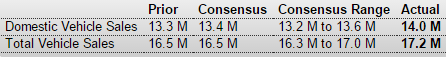
U.S. Light Vehicle Sales decrease to 16.6 million annual rate in January
By Bill McBride

Note the recent downward slope into January when the consumer spending on autos was expected to pick up due to lower fuel prices…
U.S. Light Vehicle Sales decrease to 16.6 million annual rate in January
By Bill McBride
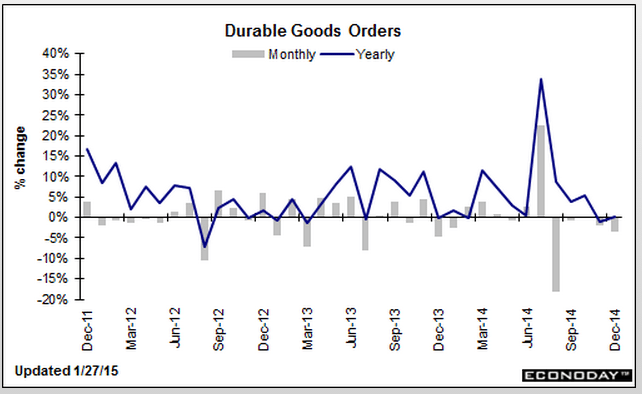
Down hard and revisions down hard as well, and year over year growth up less than 1%:
Durable Goods Orders
Highlights
Durables orders unexpectedly fell 3.4 percent in December after dropping 2.1 percent in November. Analysts projected a 0.7 percent rise.
Excluding transportation, the core slipped 0.8 in December following a decline of 1.3 percent in November. Market expectations were for a 0.8 percent boost in December. Transportation plunged a monthly 9.2 percent after dropping 3.9 percent in November. Motor vehicles rose 2.7 percent, nondefense aircraft plunged 55.5 percent, and defense aircraft fell 19.9 percent.
Outside of transportation, weakness was mixed. Industries posting gains were fabricated metals, electrical equipment, and “other.” Declines were seen in primary metals, machinery, and computers & electronics.
Nondefense capital goods orders excluding aircraft dropped 0.6 percent after a decline of 0.6 percent in November. Shipments of this series eased 0.2 percent in December after dropping 0.6 percent the month before.
Overall, manufacturing is soft. The outlook is questionable with the recently sharp boost in the value of the dollar.
Equity futures dropped very sharply on the news. However, earnings concerns also weighed on futures.
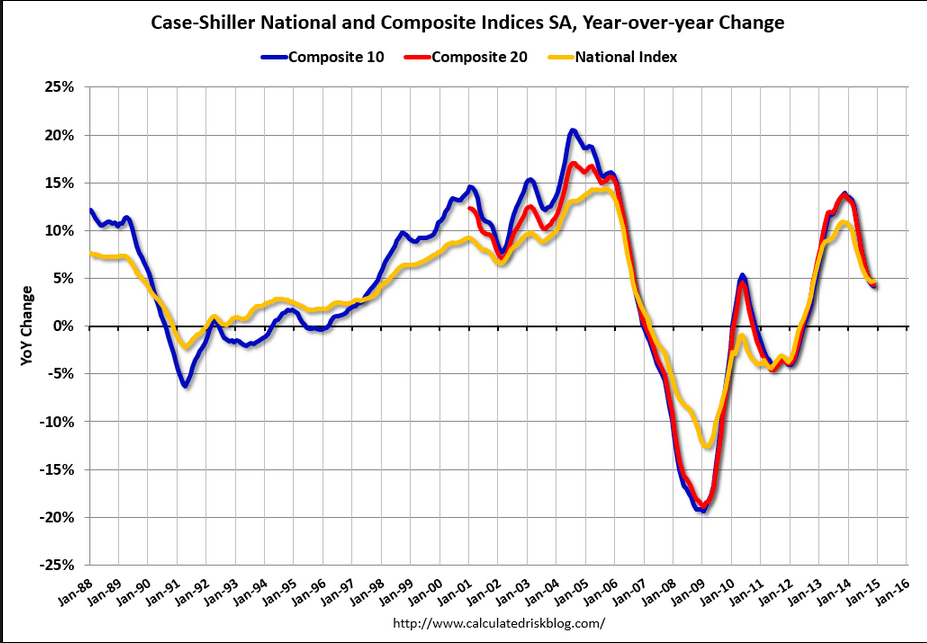
Housing still looking like it’s rolling over?
New home sales better than expected!
New Home Sales

Consumer confidence up as well! But don’t forget this is about ‘head count’. That is, consumer confidence can be up for the hundreds of millions saving $11/week on gas, while the cutbacks from those losing high paying jobs and from capex reductions reduce the confidence of far fewer people initially, but the spending lost to the economy is far higher.
Consumer Confidence

Richmond Fed- DC area doing better than Texas…
Richmond Fed Manufacturing Index
Recent History Of This Indicator
The Richmond Fed manufacturing index for December picked up to 7 from 4 in November. New orders showed relative strength, at 4 versus November’s 1, but were still on the soft side. Order backlogs, however, showed outright contraction for a second month, at minus 5 vs minus 2 in November. Shipments showed relative strength to November, at 5 vs 1, but, like new orders, were still on the soft side. A definitive sign of strength, however, came from employment which was up 3 points to a very solid 13 in a reading that points to underlying confidence among the region’s manufacturers. Price data were soft in line with declining fuel costs.
PMI Services Flash
Highlights
Growth in the nation’s service sector is accelerating but only very slightly this month based on Markit’s sample where the flash index is at 54.0 vs December’s final reading and 10-month low of 53.3 and December’s flash reading of 53.6. The report ties the gain in part to a pick up in consumer spending though new business growth this month continues to moderate and is at a new low in the 5-year history of the report. Amid the slowing, service providers in the sample continue to add to payrolls though at the slowest rate in 9 months. Growth in backlogs is at a 6-month low. Price data show only fractional pressure for inputs and only fractional pricing power for outputs.
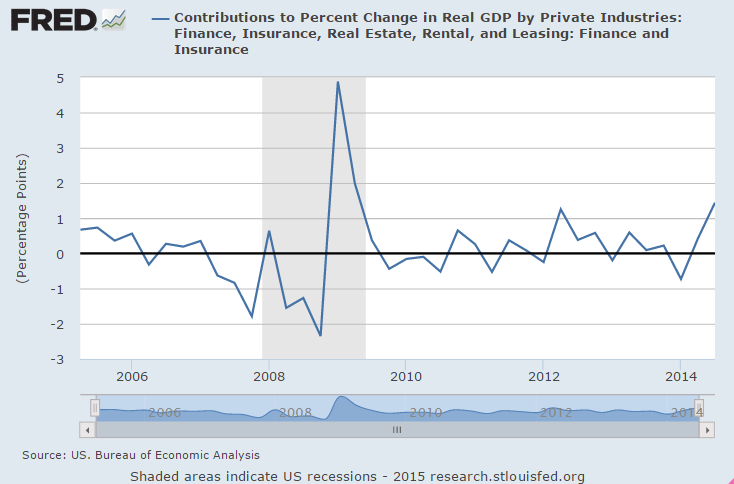
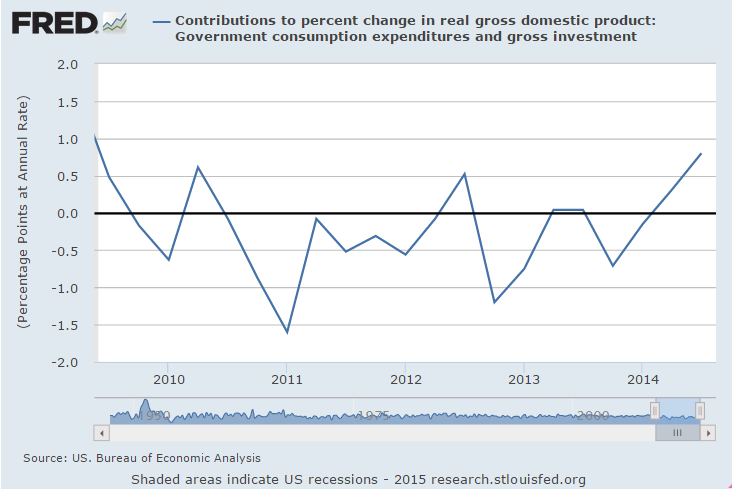
Look what spiked up in Q3, and could come down in Q4?
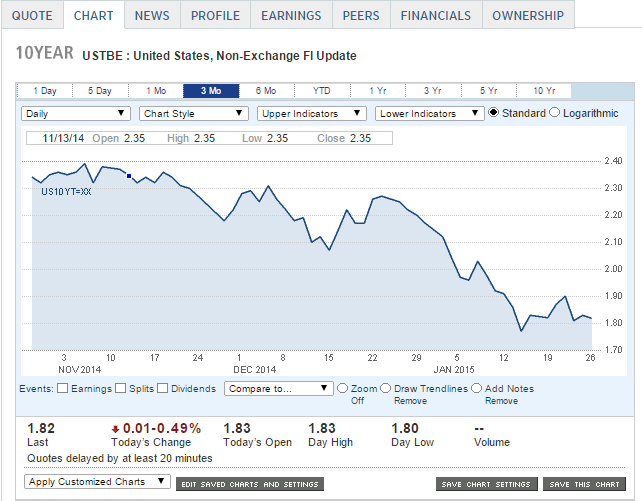
And the 10 year note is now down to 1.75%, which you could say is at odds with the Fed’s forecasts for higher rates.
Wonder who will be correct?
FYI:
Norfolk Southern Revenue Slips on Coal Weakness (WSJ) Norfolk Southern Corp. profit totaled $511 million, off from $513 million in the same quarter a year earlier. Demand for electricity in the railroad’s territory fell 1% last year, executives said. The railroad’s coal revenue fell 15% to $543 million, while its coal volume declined 6%. In the fourth quarter, Norfolk Southern’s fuel-surcharge revenue declined $45 million compared with the same quarter in 2013.
Siemens Profit Hurt by Weak Economy, Oil (WSJ) Net profit in the three months to Dec. 31 fell to €1.08 billion ($1.21 billion) from €1.43 billion in the same period last year, Siemens said on Tuesday. Revenue rose 5% to €17.42 billion, helped by the euro’s weakness against major currencies. Siemens reiterated that it expects to notch up 15% growth in earnings per share in the year to end-September on unchanged revenue. Still, an 11% decline in new orders to €18.01 billion underscored the pressure Siemens is facing as customers placed fewer large orders at its mobility, wind power and renewables business as well as its process industries and drives unit. The power and gas division’s profit margin shrank to 11.3% from 18.2% in the same period last year, Siemens said.
Aso seeks swift passage of extra budget to expand economy (Kyodo) Finance Minister Taro Aso on Monday called for swift passage of the fiscal 2014 supplementary budget to eradicate prolonged deflation and allow Japan’s economy to move onto an expansionary path. “The economy remains on a moderate recovery track, but weakness can be seen in private spending and economic recovery is uneven across regions,” Aso said in a speech. “Immediate passage of the extra budget is necessary,” Aso said, pledging to spur domestic demand by bolstering local economies and supporting households — both plagued by price rises following last April’s consumption tax hike and the weaker yen.
Remember, this is their forecast for Friday, not hard data from their subscribers:
ADP Employment Report
Highlights
ADP’s estimate for private payroll growth for November is 208,000 vs the Econoday consensus for 225,000 and against a revised 233,000 for October. The corresponding Econoday consensus for Friday’s jobs report from the government is 225,000 vs October’s 209,000.
Both ADP and the BLS data have shown new jobs working their way lower after peaking earlier in the year after dipping for the cold winter and at the same time absorbing some of the 1.2 million who lost benefits at year end and subsequently took menial jobs:
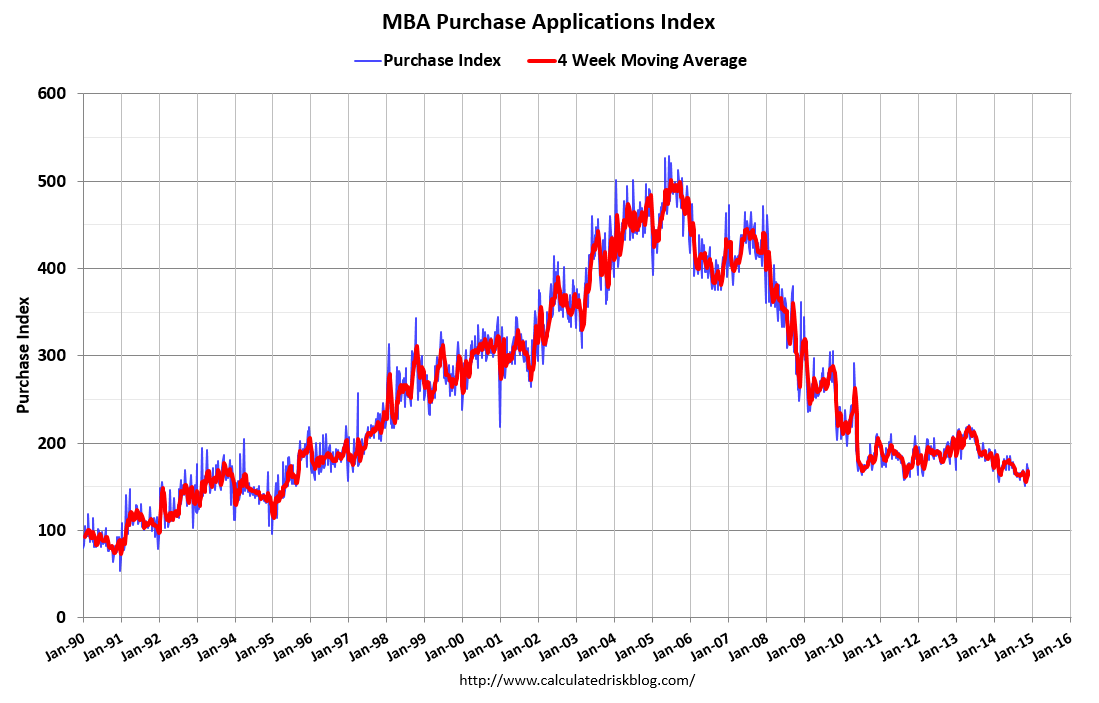
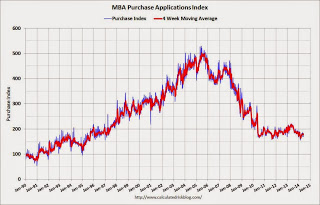
Mtg purchase apps still down year over year and moving sideways at best:
MBA Purchase Applications
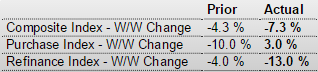
Highlights
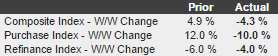
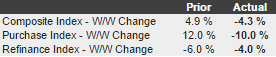
The purchase index snapped back in the holiday shortened November 28 week, rising 3.0 percent after falling 10.0 percent in the prior week. The gain helped the year-on-year reading which improved to minus 4.0 percent from minus 10.0 percent. The refinance index, however, continues its long run in negative trend, down a steep 13.0 percent for a sixth straight decline. Rates were mostly lower in the week with the average 30-year mortgage for conforming loans ($417,000 or less) down 7 basis points in the week to 4.08 percent.
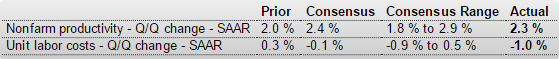
The decline in unit labor costs might be of interest to the Fed:
Productivity and Costs
Highlights
Nonfarm productivity growth for the third quarter was revised up to an annualized 2.3 percent from the first estimate of 2.0 percent and following a 2.9 percent boost in the second quarter. Unit labor costs were revised down notably to minus 1.0 percent from a first estimate of up 0.3 percent after falling an annualized 3.7 percent in the second quarter.
Output growth slowed to 4.9 percent in the third quarter, following a 5.5 percent jump the prior quarter. Compensation growth in the third quarter was up 1.3 percent annualized after a dip of 0.9 percent the previous period.
Year-on-year, productivity was up 1.0 percent in the third quarter, down from 1.3 percent in the second quarter. Year-ago unit labor costs were up 1.2 percent, compared to up 0.7 percent in the second quarter.
The latest productivity report points to positive company profits and mild gains in consumer income.
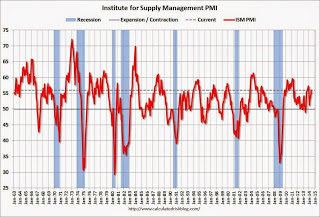
Good news on the ISM survey, though the employment index fell:
ISM Non-Mfg Index
Highlights
ISM’s non-manufacturing sample reports very solid conditions, at a composite 59.3 in November vs 57.1 in October. Aside from August’s 59.6, November is a recovery high going back more than 9 years. New orders are very strong, up 2.3 points in the month to 61.4 with backlog orders up 4.0 points to 55.5 in a reading last matched in April 2011. Strength in orders is keeping up business activity which rose 4.4 points to a very strong 64.4. Employment remains solid but did slow 2.9 points from October’s near record of 59.6. Deliveries slowed noticeably, which is another sign of strength, while inventories rose. Pressures on input prices rose a bit to 54.4 which, however, is still benign for this reading. A look at industries shows the retail sector at top, which of course is very good news going into the holidays, and construction right behind which is also very good news. This report points to solid year-end acceleration for the economy.
Meanwhile, the oil drilling slowdown might be on the high side of expectations:
Exclusive: New U.S. oil and gas well November permits tumble nearly 40 percent
By Kristin Hays
Dec 2 (Reuters) — Plunging oil prices sparked a drop of almost 40 percent in new well permits issued across the United States in November, in a sudden pause in the growth of the U.S. shale oil and gas boom that started around 2007.
Data provided exclusively to Reuters on Tuesday by industry data firm Drilling Info Inc showed 4,520 new well permits were approved last month, down from 7,227 in October.
The pullback was a “very quick response” to U.S. crude prices, which settled on Tuesday at $66.88 CLc1, said Allen Gilmer, chief executive officer of Drilling Info.
New permits, which indicate what drilling rigs will be doing 60-90 days in the future, showed steep declines for the first time this year across the top three U.S. onshore fields: the Permian Basin and Eagle Ford in Texas and North Dakota’s Bakken shale.
The Permian Basin in West Texas and New Mexico showed a 38 percent decline in new oil and gas well permits last month, while the Eagle Ford and Bakken permit counts fell 28 percent and 29 percent, respectively, the data showed.
Good news here:
Motor Vehicle Sales
Highlights
Vehicle sales rose a strong 4.2 percent in November to a 17.2 million unit annual rate which is outside the top end of the Econoday consensus for 17.0 million. Sales of North American-made vehicles proved especially strong, at a 14.0 million rate which is also outside the top-end forecast. Sales of foreign-made vehicles rose to a 3.3 million rate from 3.2 million. Today’s data point to a second straight gain, and an especially strong gain, for the motor vehicle component of the November retail sales report which rose a solid 0.5 percent in October.
Chicago PMI
New Home Sales
Pending Home Sales Index
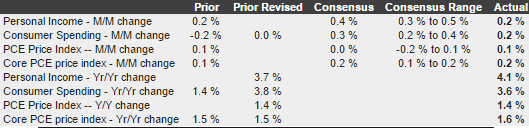
Personal Income and Outlays
Jobless Claims
Durable Goods Orders
Highlights
The headline number for durables looked good for October but the core number notably disappointed.Durables orders rebounded 0.4 percent in October after September’s decline of 0.9 percent. Market expectations were for a 0.5 percent decline.
The core fell 0.9 percent in October after a rise 0.2 percent the month before. Analysts projected a 0.5 percent gain for October. Transportation increased a monthly 3.4 percent after falling a monthly 3.3 percent in September.
MBA Purchase Applications
Highlights
Data that are weekly are often subject to volatility, wild volatility in the case of the purchase index over the last two weeks which fell 10.0 percent in the November 21 week after surging 12.0 percent in the prior week. The trend, based on the 4-week average, is again clearly negative, at minus 10.0 percent year-on-year.Consumer Sentiment
First, thanks to all for contributing to the record $41 million raised this year for Dana Farber by the PMC!!!
This all directly funds the discretionary research that makes Dana Farber what they are- the best!
If you are looking for good news on the economy don’t read the rest…
Industrial Production
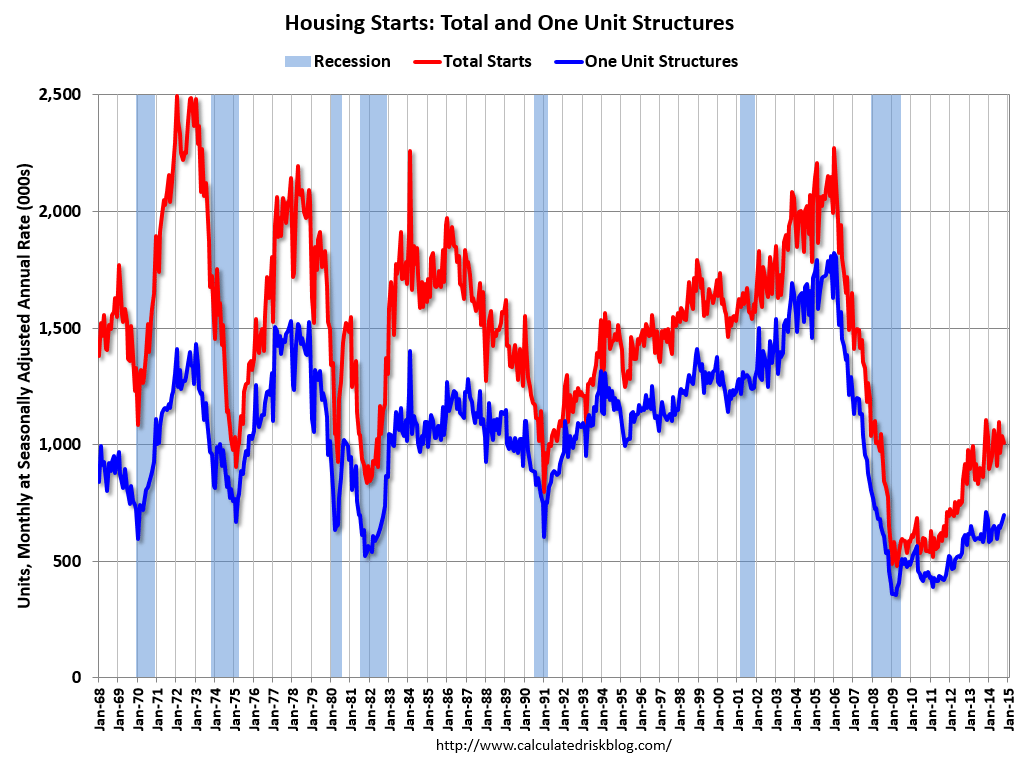
The builders may be a bit more optimistic than before, and there are fewer of them, but housing starts and sales remain weak a about half the usual rate for this point in the cycle,
and a higher % are the smaller/cheaper multifamily units:
Housing Market Index
Housing Starts
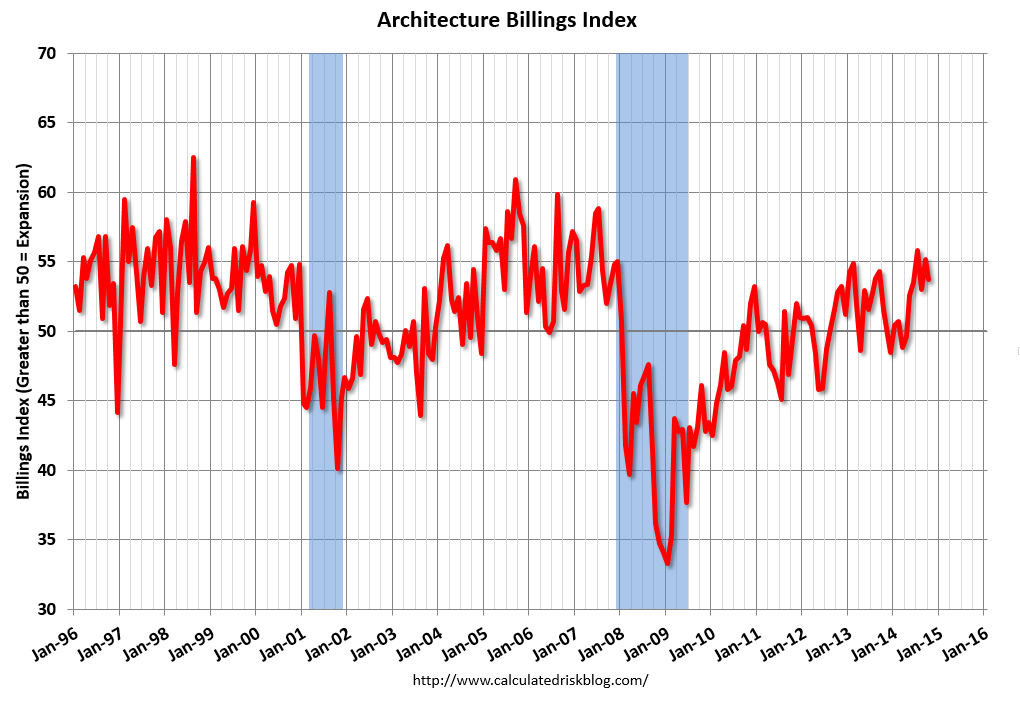
The architectural index slowed some and remains at relative weak levels:
And mtg purchase apps were up some due to seasonal adjustments but remain down 6% year over year:

Again, seems nothing is growing faster this year vs last year, which as a point of logic means overall growth is less than last year.
And reports of capital spending cuts on energy related investments continue to be reported, while money saved by consumers at the pump is not yet
translating into spending elsewhere.
Exports remain under pressure as well, including reports of containers for export at Long Beach way down, etc.
Q3 GDP had two ‘suspect’ prints that added 2% to Q3’s 3.5% GDP print- an outsized export increase and an outsized govt spending increase, both of which historically ‘mean revert’ with the subsequent report. So excluding those two, Q3 would have only grown by 1.5%, and Q4, if anything, is so far slowing some since Q3. So if the two suspect releases do revert, Q4 could easily be negative.
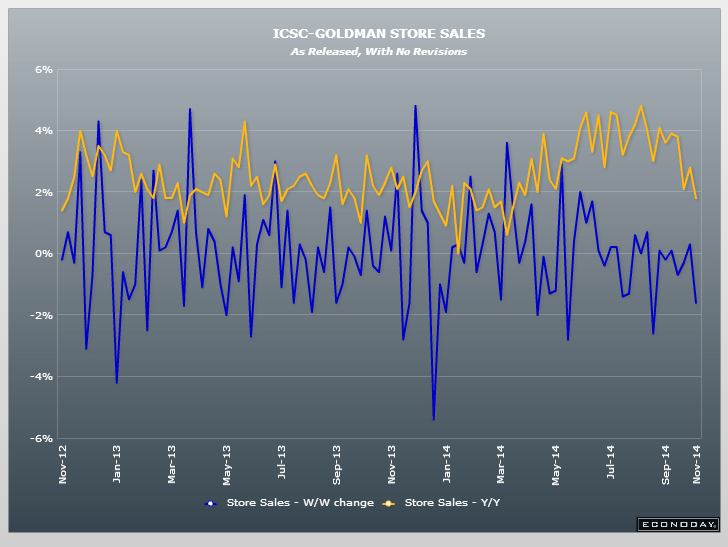
A lesser indicator but might be indicative at the moment:
ICSC-Goldman Store Sales

Redbook
Highlights
Both ICSC-Goldman and Redbook report slowing in the November 1 store-sales week with Redbook’s year-on-year same-store rate down 5 tenths to plus 3.9 percent. Redbook notes that this year’s late week Halloween, which fell on a Friday, may have backfired, having on the one hand boosted sales at those stores focusing on Halloween items but reducing sales at other retailers. Still, Redbook’s month-to-month comparison is plus 0.2 percent which offers a marginally positive indication for the ex-auto ex-gas reading of the government’s October retail sales report. Individual stores will post their October results on Thursday.
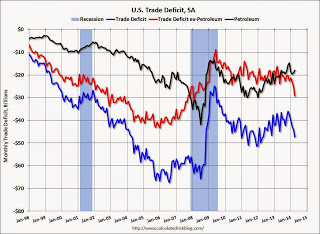
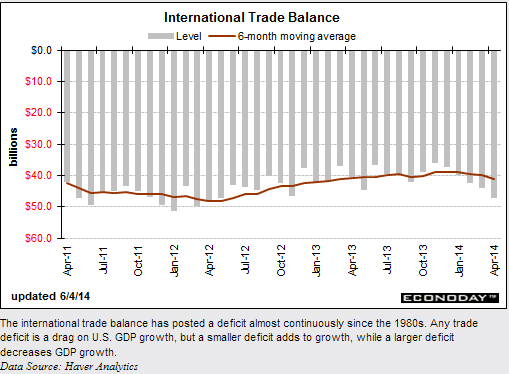
Trade a bit less then expected is also a downward revision to q3 GDP as exports fell.
Recall a prior post indicating the trade contribution to GDP looked suspect to the high side.
This is a partial adjustment.
Lower oil prices will help, but that also means less oil income for foreign producers who also buy our exports.
International Trade
Highlights
Slower global growth may have worsened the U.S. trade deficit in September. The trade gap in September expanded to $43.0 billion from $40.0 billion in August,Exports declined 1.5 percent in September, following a rise of 0.3 percent in August. Imports were unchanged, following a 0.1 percent uptick the month before.
The petroleum gap grew to $14.0 billion from $13.1 billion in August. The goods excluding petroleum gap increased to $47.2 billion from $45.5 billion in August. The services surplus slipped to $19.6 billion from $20.2 billion.
Overall, slower global growth is nudging down growth in the U.S. But recently lower oil prices likely will result in a favorable number for October.
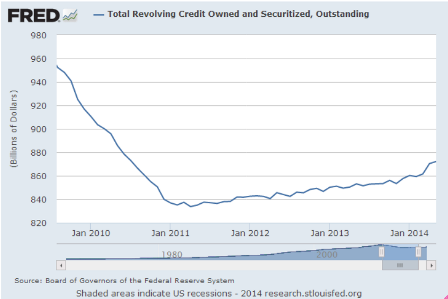
Still looking like a macro constraint/fading aggregate demand. Strong auto sales, for example, coincides with less of something else:
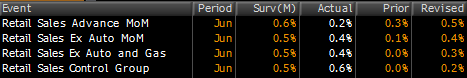
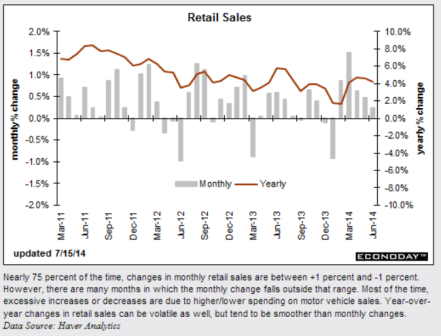
And this is the so called retail sales ‘control group’ that excludes food, gas, building materials and autos:

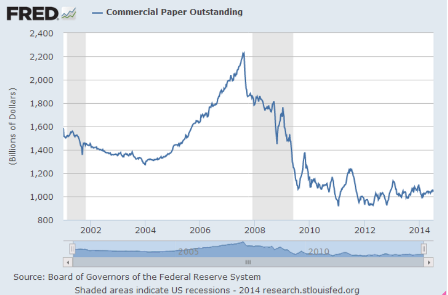
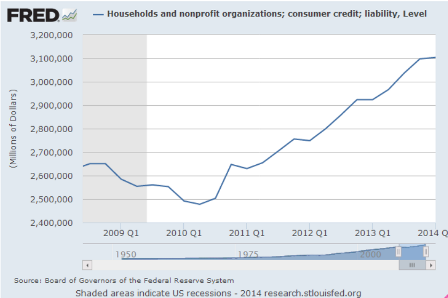
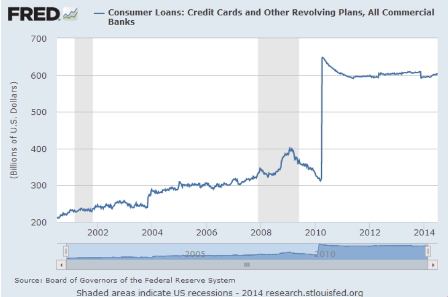
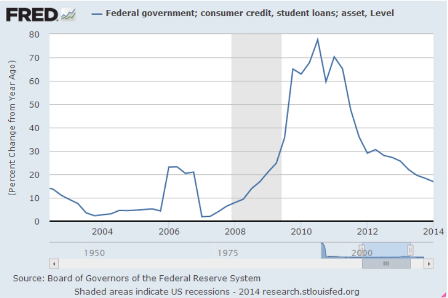
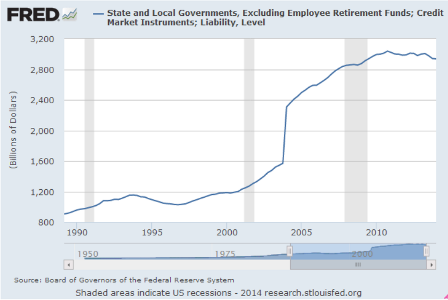
This market for loans overall remains subdued indicating banks getting a share of what was the ‘shadow bank’ business.
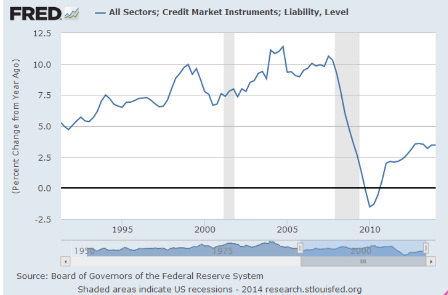
And the growth rates are generally well below prior cycles:

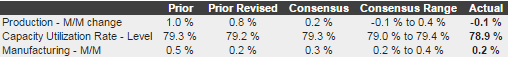
Meanwhile, manufacturing, a relatively small part of the economy, keeps chugging along, with overall output/industrial production most often growing at about 3-4% year over year:
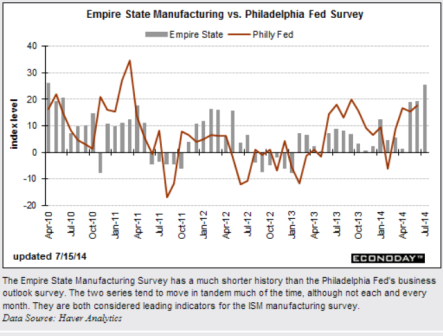
Highlights
Manufacturing activity is accelerating sharply, at least in the New York region based on the Empire State index which is at a very strong 25.60 in the July reading. New orders are very strong at 18.77, up from an already strong 18.36 in June, as are shipments at 23.64. Employment is a special positive, at 17.05 vs 10.75 in June.
Other readings, however, are less favorable with unfilled orders in contraction at minus 6.82. Price readings show some pressure with input prices at plus 25.00 and finished prices up about 2.5 points to 6.82. Optimism is also down as the 6-month general conditions index fell more than 10 points to 28.47.
(not saying that any of this is in the Fed’s reaction function- that’s another story)
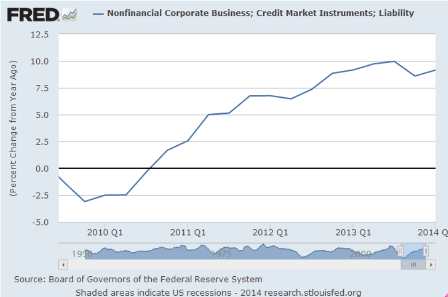
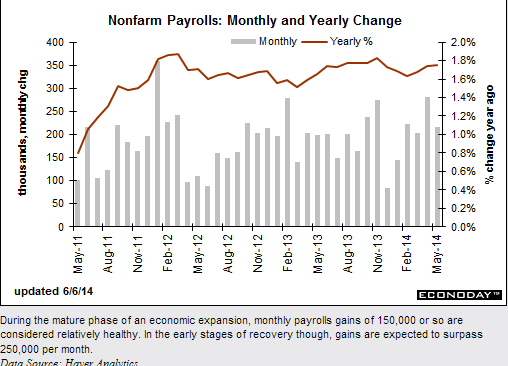
See the ‘down, up some, then leveling off of the red line?
Still growing but ‘leveled off’ at a bit less than 1.8%.
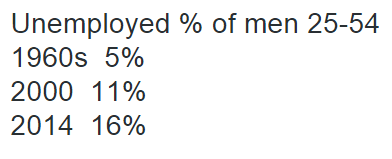
Employment/population ratio collapsed from 2008-2010 and for
all practical purposes has never recovered, and the participation rate
remains at the lows as well:
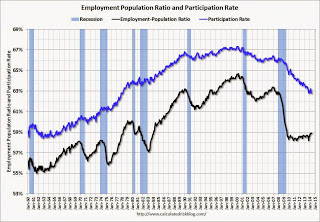
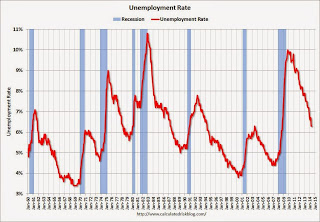
And the unemployment rate is now down to the peak of the last cycle!
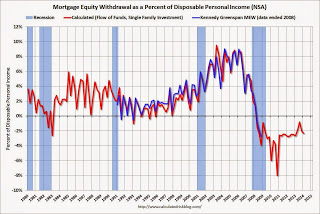
Mortgage Equity Withdrawal still a bit negative:
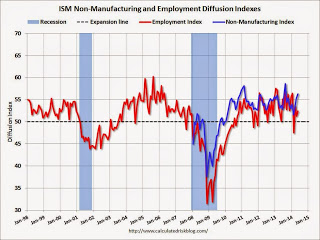
Nice move up for the ISM survey
The trade deficit seems to be ticking up a bit, meaning that much less GDP, but it’s volatile month to month:
Motor vehicle sales were up and better than expected, but with the winter dip and the subsequent recovery are still averaging a bit less than 16 million for the year. And the longer term pattern looks like the rate of growth flattened some early in 2013. And inventories are still elevated, though not as much as earlier in the year.
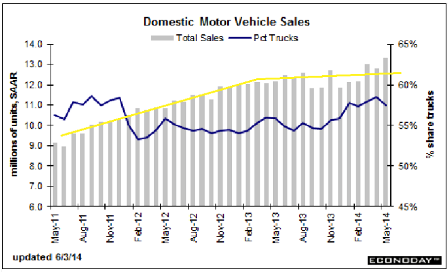
We’ll see what comes next:
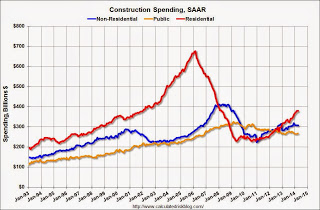
Construction spend was below expectations but chart does’t look too bad:
Mtg purchase apps remain depressed, coming in at about 17% below last year:


