Fed comment, Retail sales, Empire State Manufacturing, Industrial production, Business inventories, Consumer sentiment

Looks like the Fed hiked during a recession.

Should make for interesting Congressional testimony…

Maybe the hundreds of $ millions they spend on economic research isn’t enough???
;)

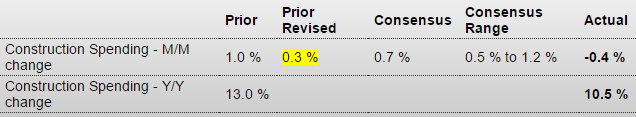
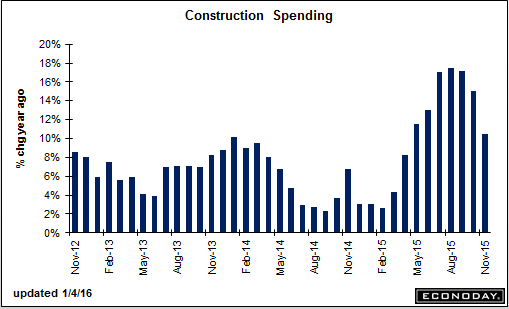
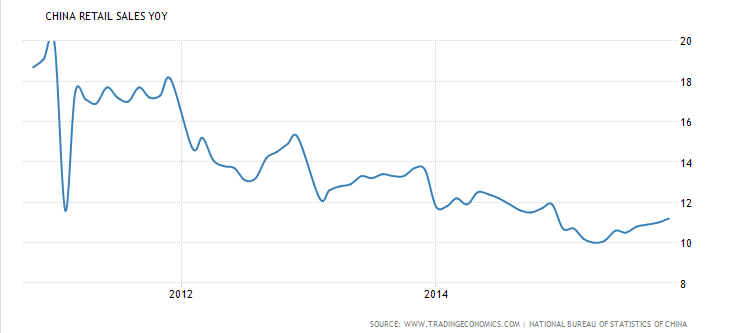
Sales remain at recession levels:
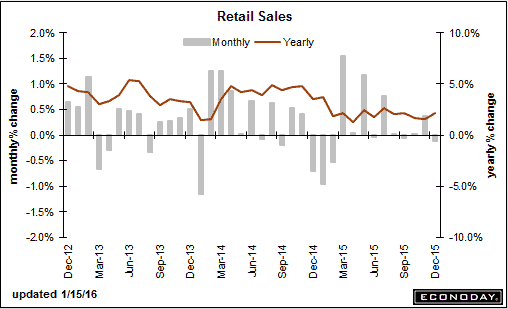
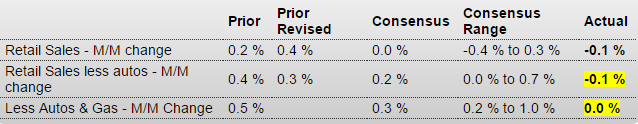
Retail Sales
er-1-15-2-1
Highlights
Retail sales proved disappointing in December, down 0.1 percent in a headline that is not skewed by vehicles or even that much by gasoline. Ex-auto sales also fell 0.1 percent while the core ex-auto ex-gas reading came in unchanged which is well below both expectations as well as low-end expectations. The Beige Book yesterday warned us about weak apparel sales which in this report fell a very steep 0.9 percent, in a decline that likely reflects more than just import-price contraction. The general merchandise category, which is very large, fell 1.0 percent in the month. Electronics & appliances also show contraction.

December winds up what was a not-so-great year for the nation’s retailers. Total sales rose only 2.1 percent in the year, the smallest gain since 2009 and well down from 3.9 percent in 2014. Excluding motor vehicles, sales rose 0.9 percent, far lower than 2014’s 3.1 percent.

There are, however, some positives in the report including another strong gain for restaurants, up 0.8 percent, and also another gain for furniture & home furnishings, up 0.9 percent in strength that confirms ongoing improvement in the housing sector. But sales at non-store retailers rose only 0.3 percent for a second straight month which are moderate gains that do not confirm anecdotal reports of unusual holiday strength for online shopping.

Upward revisions do take some of the sting out of the December report but not much. November total sales are revised 2 tenths higher to plus 0.4 percent and reflects a sharp upward revision to vehicle sales to plus 0.5 percent. But vehicle sales couldn’t muster any strength in December, coming in unchanged. And sales at gasoline stations extended their long run of contraction that reflects falling oil prices, down 1.1 percent in December.

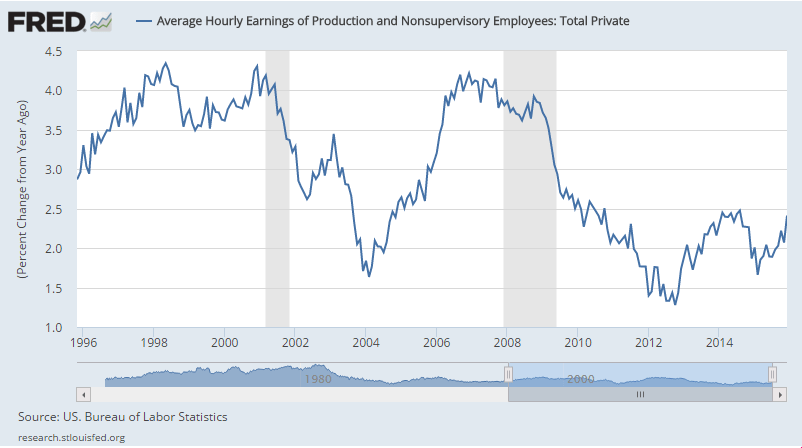
There’s plenty of jobs for consumers and gas prices are low — but so are wages. The consumer started to slow down at year end and that was before the new trouble in China. Today’s data will pull down expectations for fourth-quarter growth.
er-1-15-2-2

Retail Sales ‘control group’ (retail sales excluding food, auto dealers, building materials, and gas stations)
er-1-15-2-3
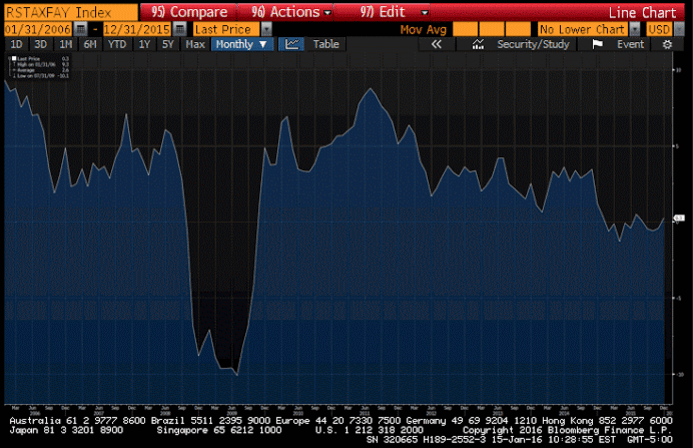
More recession evidence, and maybe worse…

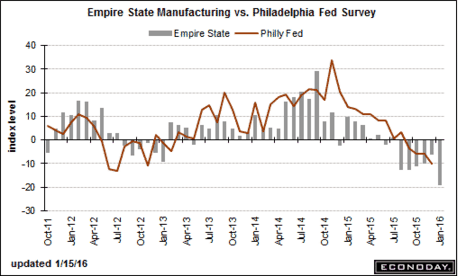
Empire State Mfg Survey
er-1-15-2-4
Highlights
The contraction in factory activity in the New York manufacturing region, which began way back in August, unfortunately is picking up a lot of steam this month, at minus 19.37 for the January headline which is the lowest reading since April 2009. New orders, at minus 23.54, are contracting for an eighth straight month and at the sharpest pace since March 2009. Unfilled orders, at minus 11.00, are in an even deeper string of contraction. Employment, at minus 13.00, is down for a sixth straight month as is the workweek, at minus 6.00. And there’s a crumbling going on in the 6-month outlook which, at 9.51 is still in the positive column but shows the least optimism since way back in March 2009. This report is grim and offers an initial look at January’s factory activity which, based on these results, appears to be getting hit by global concerns.
er-1-15-2-5

More recession evidence, or worse…

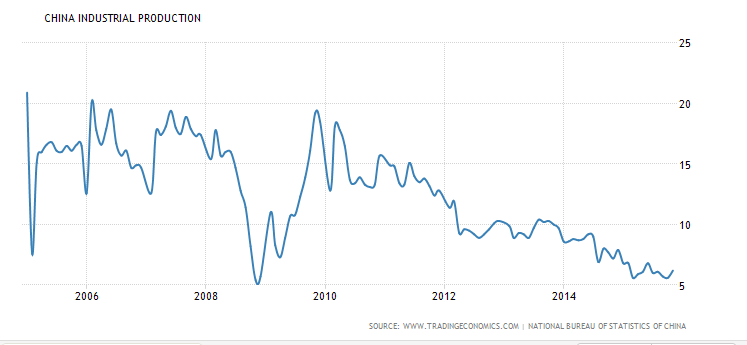
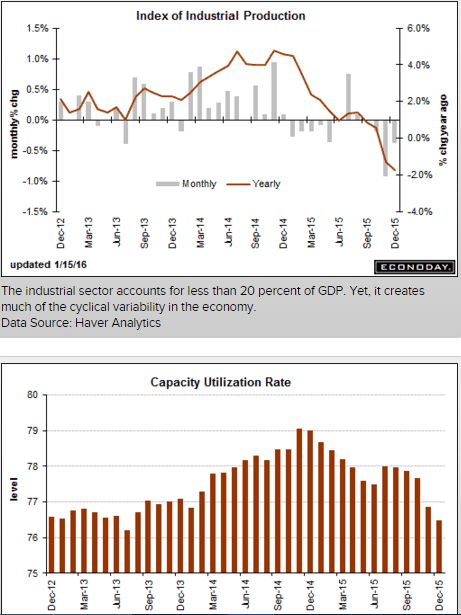
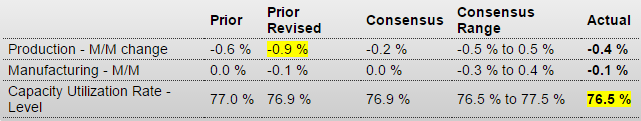
Industrial Production
er-1-15-2-6
Highlights
December was not a good month for the industrial economy as industrial production fell a sharper-than-expected 0.4 percent. Utility output, down 2.0 percent, declined for a third straight month reflecting unseasonably warm temperatures. Mining, reflecting low commodity prices and contraction in energy extraction, has also been week, down 0.8 percent for a fourth straight decline. Turning to manufacturing, which is the most important component in this report, production fell 0.1 percent for a second straight month (November revised downward from an initial no-change reading).

Details on manufacturing include a second straight contraction for vehicles, down 1.7 percent following November’s 1.5 percent decline. Weakness here, along with weakness in the motor vehicle component of this morning’s retail sales report, will raise talk that the auto sector, which had been one of the highlights of the 2015 economy, may slow down in 2016, at least the early part of the year. Construction supplies are a positive, up 0.6 percent for the second strong showing in three months and confirming strength underway in data for construction spending.

Capacity utilization fell 4 tenths from a downwardly revised November to 76.5 percent. A low utilization rate, which is running roughly 4 percentage points below its long-term average, holds down the cost of goods.

Year-on-year rates confirm weakness, down 1.8 percent overall with utilities down 6.9 percent and mining down 11.2 percent. Manufacturing is in the plus column but it’s nothing spectacular, at plus 0.8 percent.

Making matters worse is a downward revision to November, now at minus 0.9 percent vs an initial decline of 0.6 percent. Looking at the annualized rate for the fourth quarter, industrial production fell 3.4 percent though manufacturing did increase but not much, up 0.5 percent. Weather factors are skewing utility output but otherwise, readings are fundamentally soft and reflect the downturn in global demand made more severe for U.S. producers by strength in the dollar.
er-1-15-2-7

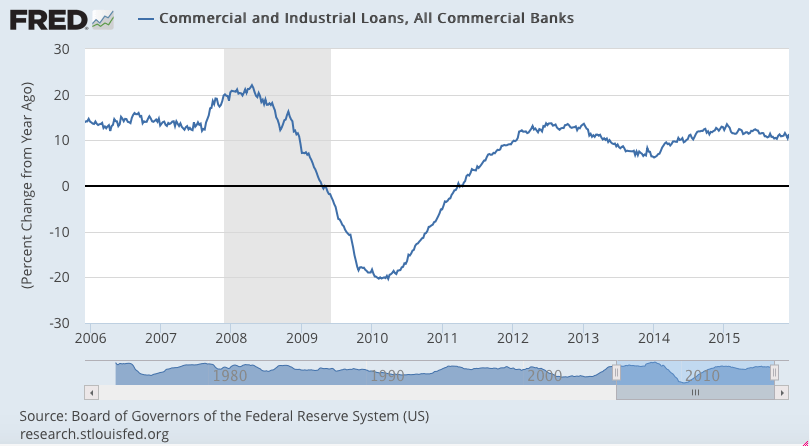
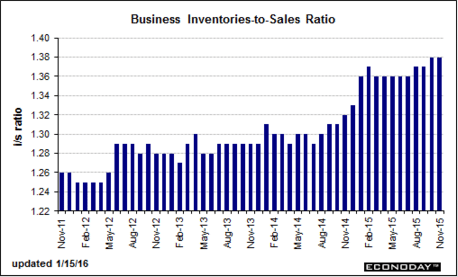
Inventories down some but sales down same so relative to sales inventories remain way high, another recession indication:

Business Inventories
er-1-15-2-8
Highlights
Inventories are contracting, the result of defensive draws in the wholesale and manufacturing sectors. Business inventories fell 0.2 percent in November following a decline in October of 0.1 percent. Wholesale inventories fell 0.3 percent for a second straight month with manufacturing down 0.3 percent following October’s 0.2 percent draw. Retail, up 0.2 and 0.1 percent in November and October, was the only sector adding inventories and today’s weak results for December retail sales may point to an unwanted build for December.

Relative to sales, which also fell 0.2 percent and were down 0.3 percent in October, total inventories are stable, at a ratio of 1.38. This report is indicative of economic weakness and will not be building expectations for fourth-quarter growth let alone the outlook for first-quarter growth.
er-1-15-2-9

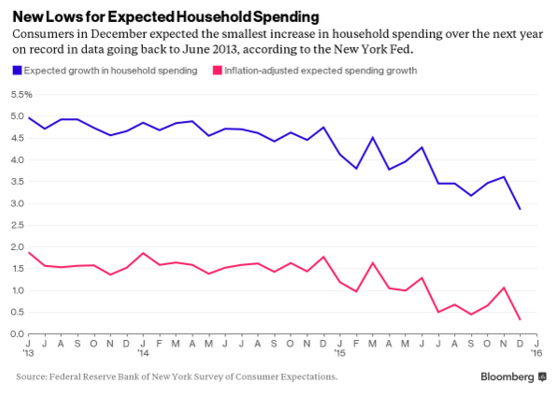
This was up a tad so they have something to report on the news. But even here the current conditions took a dive. And, as previously discussed, this is one man one vote, not one dollar one vote, and total spending has been decelerating:
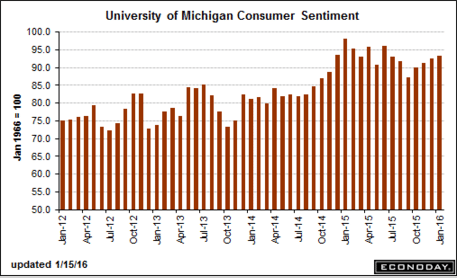
Consumer Sentiment
er-1-15-2-10
Highlights
The first indication of the China effect on U.S. consumers looks positive but ultimately is mixed. January’s flash consumer sentiment index did rise 7 tenths from final December to 93.3 but current conditions, the component that picks up the immediate impact of special factors, fell 3.0 points to 105.1. Should volatility in markets begin to ease and confidence in China improve, this reading could pop back as quickly as month end.

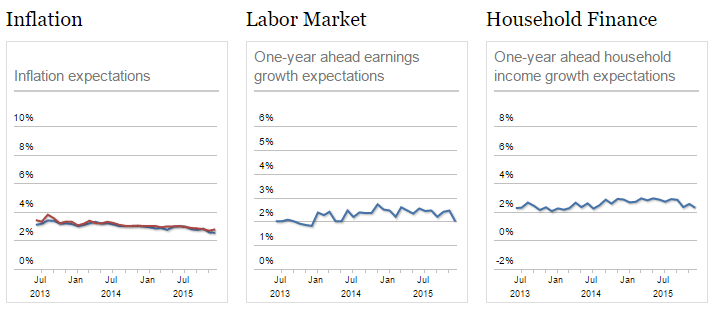
Lifting the mid-month index is a rise in the expectations component, up 3.0 points 85.7. Behind this gain is strength in the jobs market and perhaps even falling oil prices as 1-year inflation expectations are down a sizable 2 tenths to 2.4 percent. This is offset in part by a 1 tenth rise in 5-year expectations to 2.7 percent.

The resilience in long-term optimism is a plus for the U.S. economy though the eroding in short-term inflation expectations will not be encouraging to Federal Reserve policy makers who have launched a rate-hike sequence for an economy still struggling against deflation. The Dow is moving off opening lows in early reaction to this report.
er-1-15-2-11

ECB, Fed, Rail traffic

Looks like they are again making hawkish noises, taking the lead of the Fed:

ECB wary of further action despite uncertain future

By: Balazs Koranyi and John O’Donnell

Jan 14 (Reuters)

* Many governors sceptical of need for further action in near term
* Governors urge countries to act instead with reform
* Oil price and inflation expectations:
er-1-14-1
Many European Central Bank policy makers are sceptical about the need for further policy action in the near term, conversations with five of them indicate, even as inflation expectations sink and some investors bank on more easing.

Next week’s rate meeting is expected to be relatively uneventful with the big test coming when the ECB releases its initial 2018 growth and inflation forecasts on March 10.

But apparently recent market action has got the Fed thinking twice about it’s hiking intentions:

China may slow Fed’s interest rate rises: Fed officials

Jan 13 (Reuters) — The rout in China’s stock market, weak oil prices and other factors are “furthering the concern that global growth has slowed significantly,” Boston Fed President Eric Rosengren said. Rosengren also said a second hike will face a strict test as the Fed looks for tangible evidence that U.S. growth will be “at or above potential” and inflation is moving back up toward the Fed’s 2 percent target. “It’s something that’s got to make you nervous,” Chicago Fed chief Charles Evans said of the drag slower growth in China could have on economies like the United States that don’t do much direct trade. Evans also said he was nervous about inflation expectations not being as firmly anchored as a year ago, and added it could be midyear before the Fed has a good picture of the inflation outlook.

Confirming the rail traffic indicators:

CSX fourth quarter profit falls on lower freight volumes

Jan 13 (Bloomberg) — CSX said freight volumes fell 6 percent in the fourth quarter, with a huge 32 percent decline in the amount of coal hauled. Fourth-quarter net income was $466 million or 48 cents per share, down 5 percent from $491 million or 49 cents per share a year earlier. Revenue in the quarter was $2.78 billion, down nearly 13 percent from $3.19 billion a year earlier. “We have not seen these kind of pressures in so many different markets because you have multiple aspects working against you: Low gas prices, low commodity prices, strength of the dollar,” CEO Michael Ward said on the call. Except auto, housing, “you are seeing pressure on most of the markets.”

Mtg purchase apps, China trade

Lots of up and down right now.

The chart indicates purchase apps may be up a bit but still depressed historically.

MBA Mortgage Applications
er-1-13-1
Highlights
The new year is seeing a surge in mortgage activity reflecting a strong jobs market and low rates, according to the Mortgage Bankers Association’s weekly report. Purchase applications surged 18 percent in the January 8 week with refinancing applications up 24 percent. These gains, however, also reflect volatility in weekly measures and largely reverse giant swings in the prior week’s data. The average rate for conforming loans ($417,000 or less) fell 8 basis points in the week to 4.12 percent.

er-1-13-2
This shows the 3 month moving average in orange for just the last year:
er-1-13-3
This kind of trade surplus ultimately supports the currency, though FDI flows can can and have been much larger recently as previously discussed:

China Trade Surplus Widens in December

China trade surplus increased to USD60.09 billion in December of 2015 from USD49.61 billion reported a year earlier and beating market consensus, as exports and imports fell much less than expected. Year-on-year, outbond shipments declined by1.4 percent to USD224.19 billion, the sixth straight month of fall and the smallest drop since June. Imports dropped by 7.6 percent to USD164.10 billion, the 13th consecutive month of contraction, as a result of declining commodity prices and weak demand.

EU growth, NY Fed consumer survey

A bit of growth in the EU supported by the low euro from the CB euro selling and consequent trade/current account surplus. However, without ECB euro selling the fundamentals will inevitably firm the euro until that growth component ceases. But meanwhile, watch for signs of ECB hawkishness:

Ever so slowly, the euro zone economy awakes

By Jeremy Gaunt

Jan 10 (Reuters) — Economic growth was running at an annual rate of 1.6 percent in the third quarter, roughly twice the average annual growth rate between 2003 and 2014 (itself dragged down by the sharp contraction of 2009). Unemployment has been falling fairly steadily. It was at 10.5 percent in November, which is high, but the lowest in more than four years and well below the 12 percent of 2013. In the first half of 2015, for example, big gun Germany’s export growth to China fell to just 0.8 percent and engineering exports shrank by 4.9 percent. Yet German gross domestic product (GDP) growth was running at 1.8 percent at last count even with the slide.

Latest from the NY Fed:
er-1-11-1
er-1-11-2

Jobs, Wholesale trade, China, Rail traffic

Anyone notice that the annual growth rate of employment continues the deterioration that began with the collapse in oil capex?
Or that, once again, it looks like most all the new jobs were taken by people previously considered out of the labor force?
And the anemic wage growth also contributes to the narrative of a continuously deteriorating plight for people trying to work for a living:

Employment Situation
er-1-8-1
Highlights
The labor market is stronger than most assessments with December results well outside top-end estimates and big upward revisions underscoring the strength of prior months. Nonfarm payrolls jumped 292,000 in December which is 92,000 above the consensus and 43,000 above Econoday’s high forecast. The gain importantly is led by professional & business services which is considered a leading component for future hiring and which rose 73,000 for the second outsized gain of the last three months. Construction, boosted by the nation’s unseasonable weather, has also been adding workers, up 45,000 in December. Upward revisions to the two prior months total 50,000 with November now at 252,000 and October over 300,000 at 307,000.

Despite payroll strength, the unemployment rate held steady at 5.0 percent as more people looked for work in the month. The labor force participation rate improved 1 tenth to 62.6 percent as did the employment-to-population ratio, to 59.5 percent. Wages, also despite the payroll strength, came in unchanged though the year-on-year rate, boosted by an easy year-ago comparison, rose 2 tenths to 2.5 percent which, however, is lower than many expected. The average workweek held unchanged at 34.5 hours while manufacturing hours slipped 0.1 percent which will pull down estimates for next week’s industrial production report.

Turning back to industry payrolls, the bureau of labor statistics is highlighting a 34,000 rise in temporary help services. This is a subcomponent of professional & business services and is considered an especially sensitive barometer for future hiring. Other industries posting gains include trade & transportation at 31,000, government at 17,000, and manufacturing at a modest 8,000. Mining payrolls, hurt by low commodity prices, continue to contract, down 8,000 and are one of the few industries in the minus column.

This report is strong and should confirm confidence that the U.S. economy is, or at least was in December, largely insulated against global weakness. The strength of this report is certain to grab global attention though the lack of wage punch underscores the two-track economy and the Fed’s dilemma — strong job growth but weak inflation.

er-1-8-2
Also decelerating since the oil capex collapse:
er-1-8-3
So 10 million + people decided all at once they didn’t ever want to work anymore in 2008? That is, we still have massive ‘slack’ in the ‘labor market’ best I can tell:
er-1-8-4
er-1-8-5
er-1-8-6
And this is still higher than it was in the prior recession:
er-1-8-7
Earnings continue to grow only at depressed rates, maybe because of all the ‘slack’ in the ‘labor market?’
er-1-8-8
er-1-8-9
Inventories fell, but sales fell even more, so the inventory to sales ratio went up.
Not good!!!

Wholesale Trade
er-1-8-10
Highlights
Wholesale inventories fell a sizable 0.3 percent for a second straight month in November. Sales at the wholesale level fell an even sharper 1.0 percent in the month and, despite the decline in inventories, drove the stock-to-sales ratio up to 1.32 vs 1.31 in the two prior months. A year-ago, the ratio was at 1.23 in what is confirmation that inventories in the sector remain heavy. Inventories of farm products and petroleum rose due to weak sales while inventories of furniture and metals fell on strong sales. Previously released data on the factory sector show a 0.3 percent inventory contraction in November. The missing piece, retail inventories, will be posted following next week’s retail sales report.

er-1-8-11
‘Monetary Policy’ in this case means currency management. So we called China a currency manipulator and predator when they bought fx reserves to keep their currency from getting too strong too fast from FDI flows, etc., and then when they let their currency float as FDI flows reversed we criticized them.

And we had a ‘strong dollar policy’ while at the same time telling China their currency needed to appreciate when they were buying fx to moderate the appreciation. It’s all be continuous ‘talking out of both sides of the mouth’

And with a large trade and current account surplus it’s only a matter of time until China is again accumulating fx reserves to keep their currency from appreciating. But in light of the current criticism of their weakening currency, maintaining ‘stability’ when it’s back in appreciation mode may be applauded.

China central bank to maintain prudent monetary policy, keep yuan stable

Saudi pricing, Mtg purchase apps, ADP, Trade, Factory orders, ISM non manufacturing

Saudi discounts for February. Some reduced, some increased, so probably more same- prices fall until Saudi output hits its capacity:
er-1-6-1
Zig zagging a lot recently, now back down to where they’ve been for a while:

MBA Mortgage Applications
er-1-6-2
Highlights
Mortgage application activity fell sharply in the two weeks ended January 1, down 15 percent for home purchases and down 37 percent for refinancing. Rates were steady in the period with the average 30-year mortgage for conforming balances ($417,000 or less) up 1 basis point to 4.20 percent. Weekly data can be volatile during the shortened holiday weeks, making the latest results difficult to read. This series will resume its weekly periods beginning next week.
er-1-6-3

This is a forecast for Friday’s jobs report:

ADP Employment Report
er-1-6-4
Highlights
ADP is calling for unusual strength in Friday’s employment report, at 257,000 for private payrolls which is far outside Econoday’s consensus at 190,000 and well outside the high estimate for 227,000. Strength of this degree would underscore the health of the labor market and would begin to seal expectations for a rate hike at the March FOMC. ADP isn’t always an accurate barometer for the employment report but today’s results could definitely affect the markets.

A bit smaller than expected, but again, both imports and exports are falling:

International Trade
er-1-6-5
Highlights
The nation’s trade balance, reflecting weak cross-border activity, narrowed in November to $42.4 billion from a revised $44.6 billion in October. Exports fell 0.9 percent in the month to $182.2 billion with industrial supplies and consumer goods showing the most weakness. Imports fell 1.7 percent to $224.6 billion with both consumer goods and capital goods showing declines.

Despite low oil prices, the petroleum gap widened by $0.9 billion to $5.4 billion due to rising demand. The price of imported oil fell 88 cents to $39.24 for the lowest level since February 2009.

The trade gap with China narrowed by $1.7 billion in the month to $31.3 billion while the gap with Europe widened by $0.4 billion to $13.8 billion. The gap with Mexico narrowed by $1.2 billion to $5.2 billion.

The nation’s fourth-quarter trade balance adjusted for inflation is still trending slightly above the third-quarter which will pull down GDP. But the takeaway from today’s report is slowing global trade.
er-1-6-6

Negative growth continues here:

Factory Orders
er-1-6-7
Highlights
Flat is a good description of the nation’s factory sector as factory orders slipped 0.2 percent in November, making October’s revised 1.3 percent gain look like a rare outlier. Durable goods orders were unchanged in the month while orders for non-durable goods fell 0.4 percent on price weakness for petroleum and coal.

Capital goods data, unfortunately, are mostly weak including a 0.3 percent decline for core orders. Shipments of core capital goods fell 0.6 percent in November and follow October’s 1.0 percent decline in readings that will pull down the business investment component of the fourth-quarter GDP report.

Outside of orders, total shipments edged 0.2 percent higher to end a string of declines that go all the way back to July. Inventories also offer good news, falling 0.3 percent and bringing down the inventory-to-shipment ratio to a less heavy 1.35 vs October’s 1.36. Unfilled orders are another positive, rising 0.2 percent following a 0.3 percent gain in October.

The factory sector is not exactly robust, the result of weak demand for U.S. exports and also weakness in the domestic energy sector reflected in this report by a 13.6 percent monthly plunge in orders for mining & oil field machinery. But the nation’s economy is not narrowly focused on the factory sector, evidenced by healthy readings in today’s ISM non-manufacturing report.

er-1-6-8
Yes, it’s above 50, but the chart indicates the non manufacturing growth rate is melting away:
er-1-6-9

Bank of China, Port traffic, Redbook retail sales, Car sales early indication

This does nothing apart from supporting their policy rate:
er-1-5-1

Port Traffic Grew at Slowest Rate Since Recession in 2015

Container traffic rose only 0.8% last year at the 30 busiest ports worldwide, the smallest increase since 2009, according to an estimate by Alphaliner

By Robbie Whelan

Jan 4 (WSJ) — Container traffic at the world’s busiest ports grew last year at its slowest rate since the recession, according to an estimate by Alphaliner, a shipping industry data provider.

Demand was held back by a lack of “peak season,” the months heading into the holidays when manufacturers normally ship large quantities of goods to retailers globally. This year, traffic in the top 30 ports sank 0.9% in the third quarter, the first decline over those months since 2009, Alphaliner said.

For the full year, Alphaliner projects container traffic rose 0.8%, the smallest increase since 2009. Weak demand has left carriers struggling to find customers to fill their ships, even as new vessels hit the seas at a record pace. Last year, ships with a combined capacity of 1.7 million twenty-foot containers entered the global fleet. To combat the lower ocean freight rates resulting from excess capacity, ship owners and operators have idled more than 1.3 million TEUs of capacity.

Doing better as year over year comps get easier:
er-1-5-2

The Big Three are in and December sales are running below expectations down about 5 percent from November vs expectations for a 1 to 2 percent decline. Car sales are especially weak with sales of light trucks down only slightly. The Big Three account for roughly half of all sales. Foreign brands will be posting their results through the session.

PMI Manufacturing, ISM Manufacturing, Construction Spending, Canada PMI, China Manufacturing PMI

Bad:

PMI Manufacturing Index
er-1-4-1
Highlights
The manufacturing PMI has been consistently running warmer than other manufacturing surveys which helps put into context the disappointment of December’s slowing to 51.2, down from 52.8 in November. The final reading for December is 1 tenth lower than the mid-month flash. Near stagnation in new orders is a key negative in the report, one that points to further slowing for the headline index in coming readings. Orders are still growing but at their slowest pace of the recovery, since September 2009. Backlog orders are contracting sharply, the most since September 2009 as well. The report points to widespread weakness across orders including for export orders where manufacturers continue to site strength in the dollar as a negative.

Very bad, employment down, but export orders did manage a bounce:

ISM Mfg Index
er-1-4-2
Highlights
ISM manufacturing sample is reporting the weakest conditions since July 2009. At 48.2, December is much lower than Econoday’s 49.2 consensus and is only the third sub-50 reading of the recovery. But the story is much the same as it was in November which came in at 48.6 with both months showing slight contraction underway for both new orders and production. Employment in the sample, however, is noticeably weaker than November, at 48.1 for a more than 2 point decline and the second sub-50 reading in the last three months. A sizable 4.5 point rise for new export orders to 51.0 is a positive in the report. Inventories are steady and low but the sample still say inventories are a little bit high which betrays caution in their outlook. Prices for raw materials continue to contract, a reminder that low oil and commodity prices are making it difficult for the Fed to reach its 2 percent inflation target. This report points to ever softer conditions for a sector that, held down by energy and weak foreign demand, showed very little life during 2015.
er-1-4-3

And more bad. Note the ‘processing error’ which resulted in reductions to prior months. As suspected, things have been worse than reported ever since the collapse in oil capex a little over a year ago. And as the chart shows, the blip up as the NY tax credit expired in June continues to reverse:

Construction Spending
er-1-4-4
Highlights
Construction spending had been a highlight of the U.S. economy but less so with November’s report where the headline fell 0.4 percent, far below the Econoday consensus for plus 0.7 percent. The year-on-year gain for spending, at 10.5 percent, is the lowest since April last year. Today’s report also includes sharp downward revisions to prior months, the result of a processing error going back to January last year. October’s initial 1.0 percent monthly gain is now cut 7 tenths to 0.3 percent while September is now at plus 0.2 percent vs an initial plus 0.6 percent.

The processing error, unfortunately for the housing outlook, is centered in the residential component where prior strength has been cut back. Still, residential spending rose 0.3 percent for a second month in a row that follows September’s very solid 1.2 percent gain. Spending on new single-family homes has been rising strongly with the year-on-year rate at a very solid plus 9.3 percent. Spending on multi-family homes did fall in November but has been in fact booming in prior months, up 24.5 percent year-on-year.

Spending on nonresidential construction has also been solid, down in November but with the year-on-year rate at plus 13.6 percent. Public spending has been led by the educational component, up 15.2 percent year-on-year, with highway spending behind at plus 5.6 percent.
er-1-4-5

Canada Manufacturing PMI at Record Low

Jan 4 — The RBC Canadian Manufacturing PMI dropped to 47.5 in December of 2015 from 48.6 in the previous month. It is the fifth contraction and the lowest reading on record due to weak output, new orders and employment.

China Caixin Factory Activity Contracts for 10th Month

Jan 4 — The Caixin Manufacturing PMI in China dropped to 48.2 in December of 2015 from 48.6 in November and below market expectations. While the reading was the lowest in 3 months, factory activity has been in a contraction since March. Production declined for the seventh time in the past eight months, driven in part by a further fall in total new work. Client demand was weak both at home and abroad, with new export business falling for the first time in three months. Manufacturers continued to trim their staff numbers and reduce their purchasing activity in line with lower production requirements. Meanwhile, deflationary pressures persisted, as highlighted by further marked declines in both input costs and selling prices.

Rail traffic, China Beige Book, Bank loans

Rail Week Ending 12 December 2015: Bad Data Continues And Marginally Worse Than Last Week

Week 49 of 2015 shows same week total rail traffic (from same week one year ago) declined according to the Association of American Railroads (AAR) traffic data. Intermodal traffic returned to contraction year-over-year, which accounts for approximately half of movements and weekly railcar counts continued deeply in contraction.

So who would’ve thought all that ‘monetary stimulus’ wouldn’t work???
;)

China Beige Book Shows ‘Disturbing’ Economic Deterioration

By Malcolm Scott

Dec 17 (Bloomberg) — China’s economic conditions deteriorated across the board in the fourth quarter, according to a private survey from a New York-based research group that contrasted with recent official indicators that signaled some stabilization in the country’s slowdown.

National sales revenue, volumes, output, prices, profits, hiring, borrowing, and capital expenditure were all weaker than the prior three months, according to the fourth-quarter China Beige Book, published by CBB International. The indicator is modeled on the survey compiled by the Federal Reserve on the U.S. economy, and was first published in 2012.

Earnings Deterioration

The Beige Book’s profit reading is “particularly disturbing,” with the share of firms reporting earnings gains slipping to the lowest level recorded, CBB President Leland Miller wrote in the release. While retail and real estate held up reasonably well, manufacturing and services performed poorly, with revenues, employment, capital expenditure and profits weakening.

The survey shows “pervasive weakness,” Miller wrote in the report. “The popular rush to find a successful manufacturing-to-services transition will have to be put on hold for a bit. Only the part about struggling manufacturing held true.”

After efforts including six interest-rate cuts since late 2014 failed to revive growth, policy makers are switching focus to fix problems like overcapacity on the supply side. President Xi Jinping — seeking to keep growth at a minimum 6.5 percent a year through 2020 — is juggling short-term stimulus with long-term prescriptions to avoid the middle-income trap that has ensnared developing nations after bouts of rapid growth before they became wealthy.

Nothing happening here:

er-12-20-1