Bank lending, quick macro recap

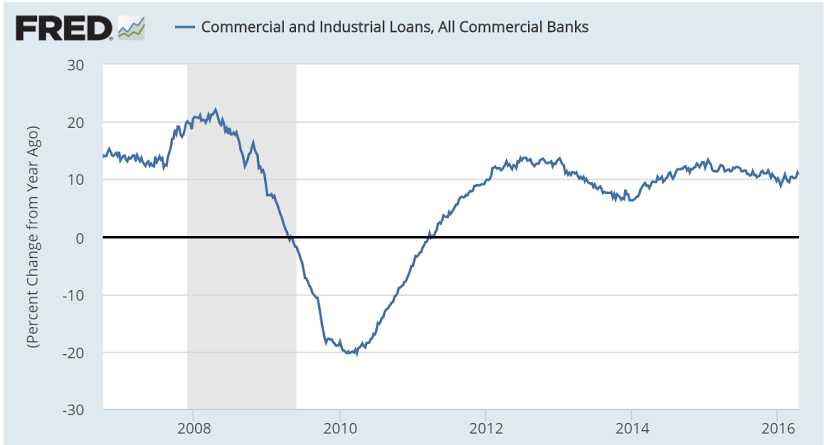
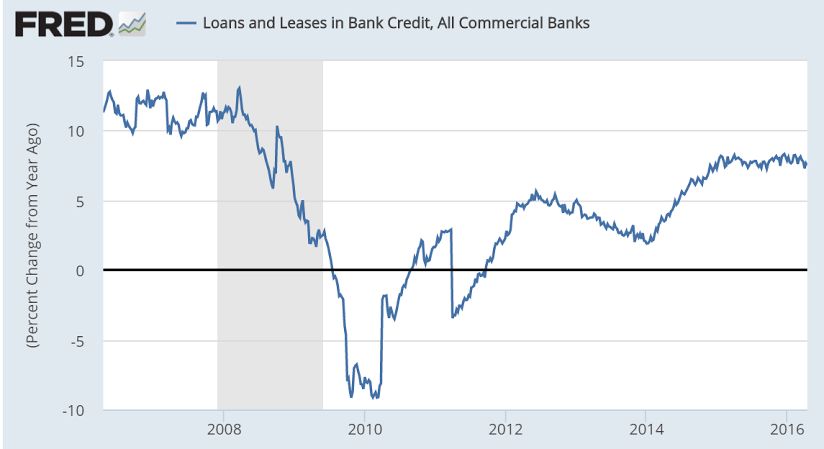
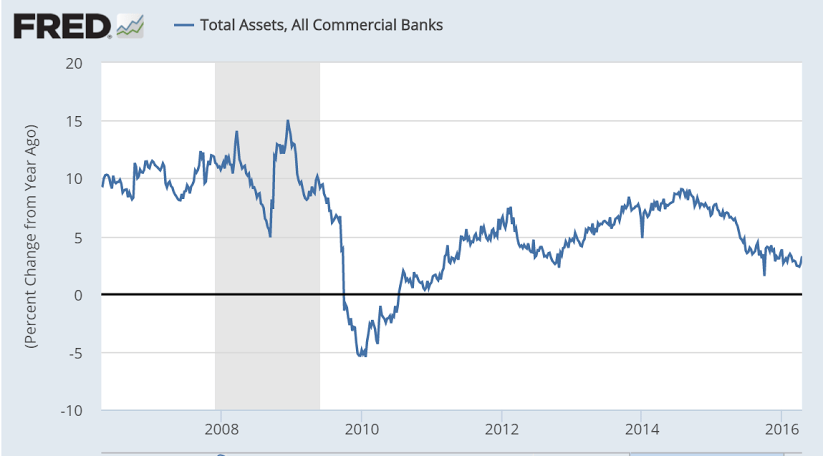
Loan growth remains uninteresting:
er-4-24-1
er-4-24-2
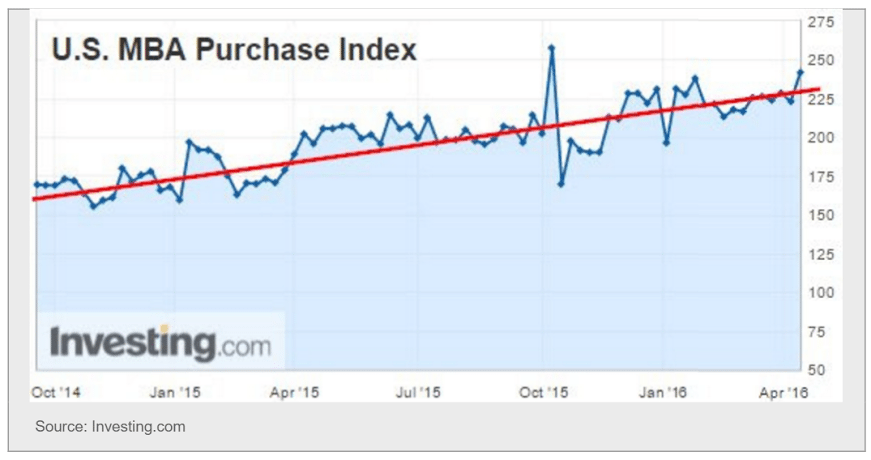
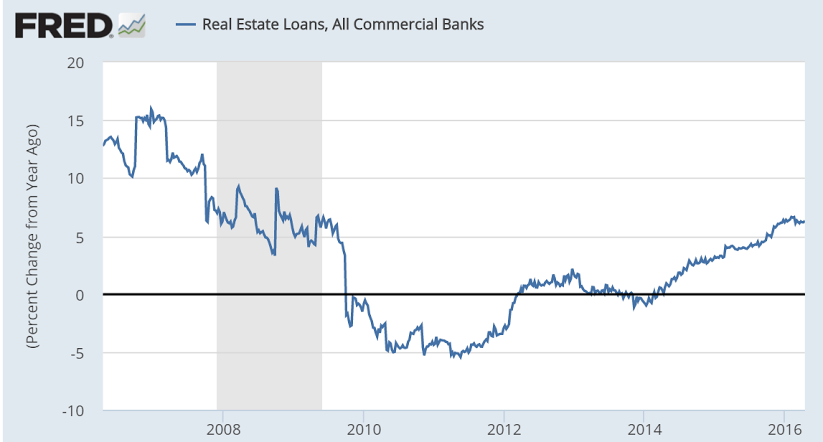
And now real estate loan growth, which wasn’t much to begin with, is showing signs of leveling off:
er-4-24-3

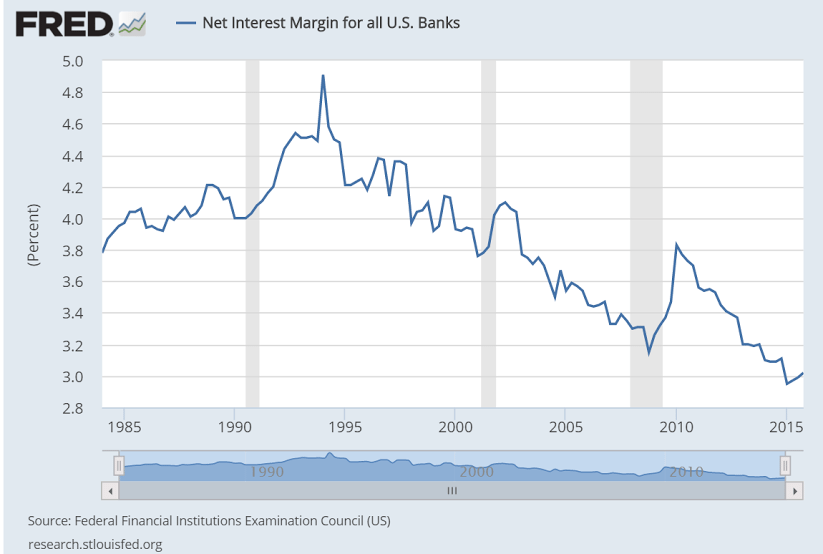
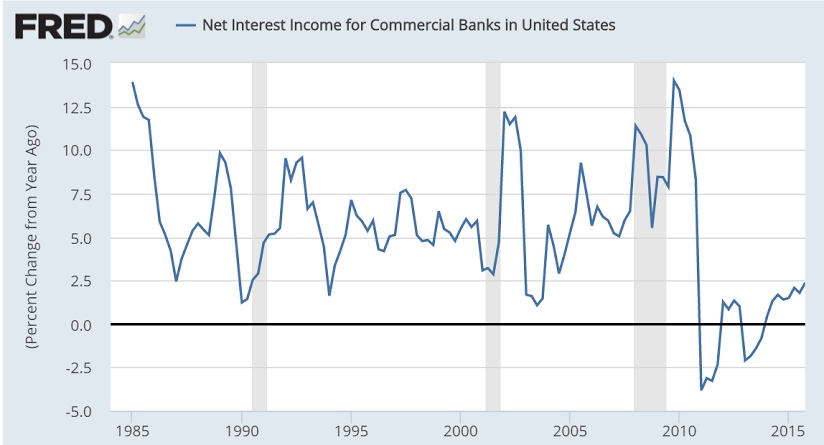
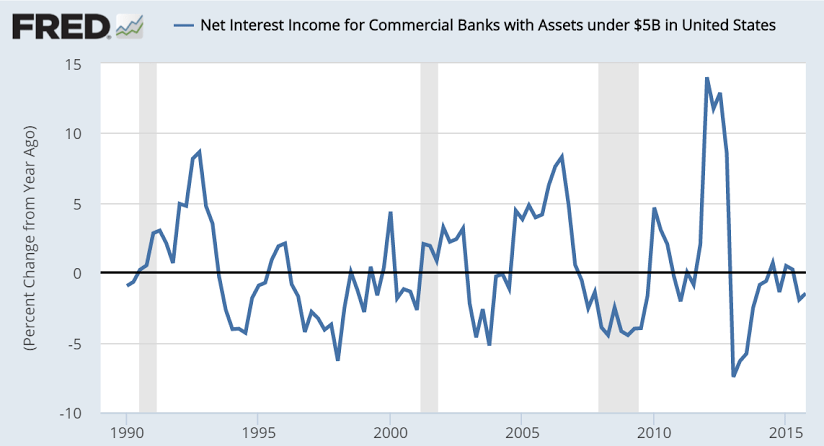
In case you thought today’s macro policies were some kind of gift to banks:
er-4-24-4

er-4-24-5

er-4-24-6

er-4-24-7

er-4-24-8

Again, wouldn’t surprise me if revisions in coming years show the US has been in recession since not long after oil prices got low enough for capex to collapse.

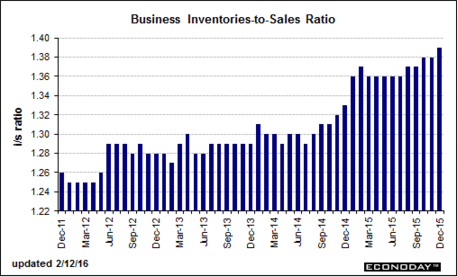
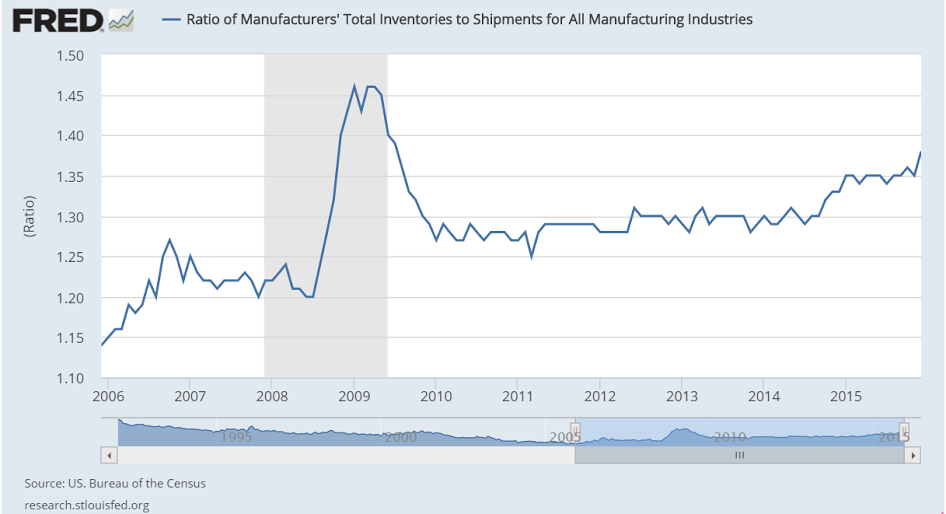
And it’s an old fashioned ‘under consumption theory’ slowdown- any agent that spent less than his income needed to be ‘offset’ by another who spent more than his income, or the output wouldn’t have been sold, etc. Unsold output = rising inventories = cutbacks output = reduced income = reduced sales = reduced income = reduced sales = pro cyclical downward spiral, etc. as income reductions in one sector ‘spread’ to cuts into reduced sales in the rest.

And it reverses only after deficit spending- public or private- gets large enough to offset desires to ‘save’/not spend income.

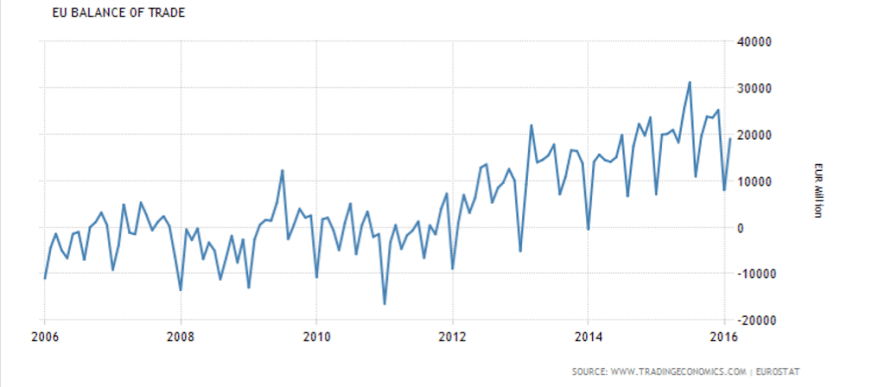
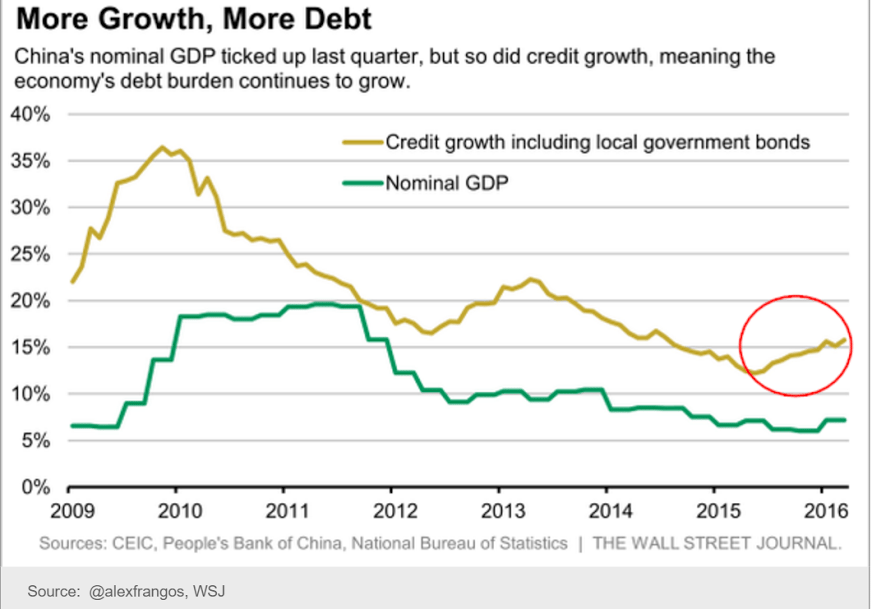
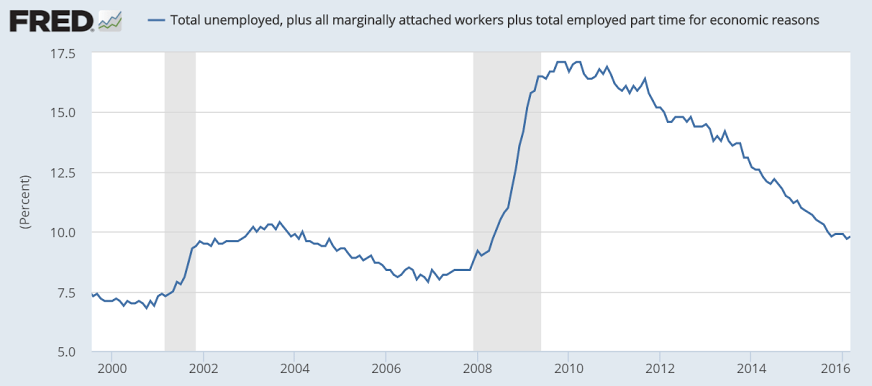
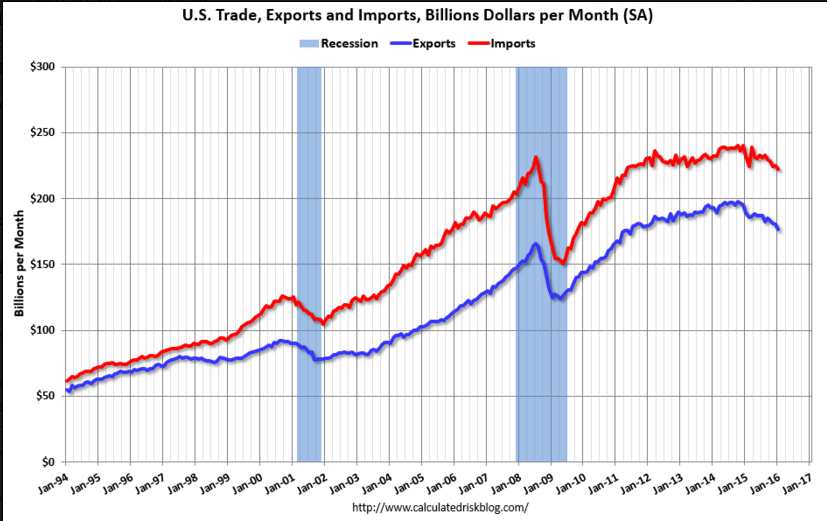
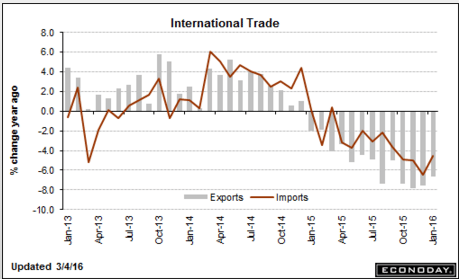
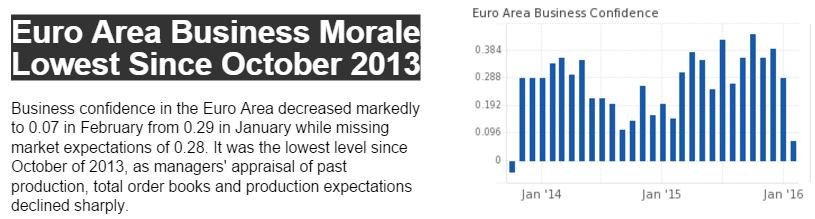
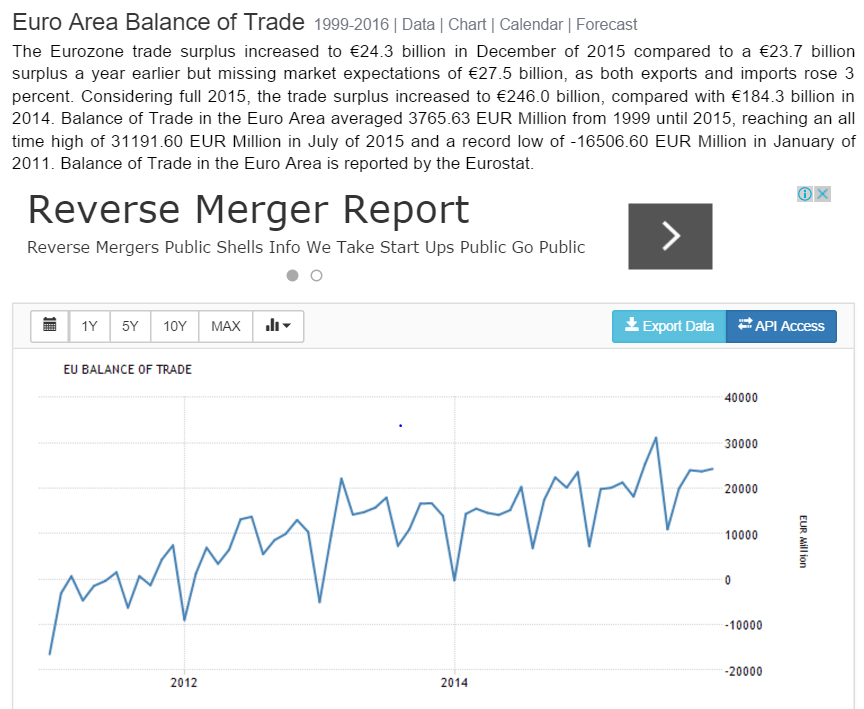
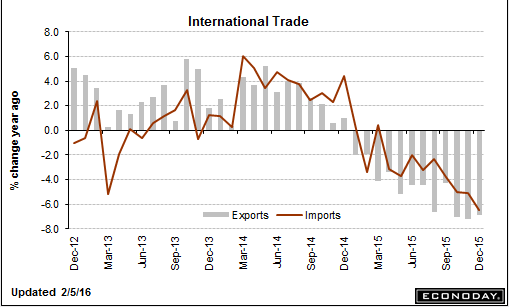
And it’s happening globally, with maybe some signs of some expansionary fiscal policy in China. But the general policy responses, including those of China, are focused on promoting exports/competitiveness, further promoting a global deflationary 0 sum game race to the bottom, with total trade winding down as well, all from a global lack of aggregate demand. And all as evidenced by massive excess capacity, particularly with regard to labor (UNEMPLOYMENT!).

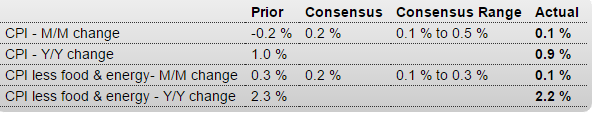
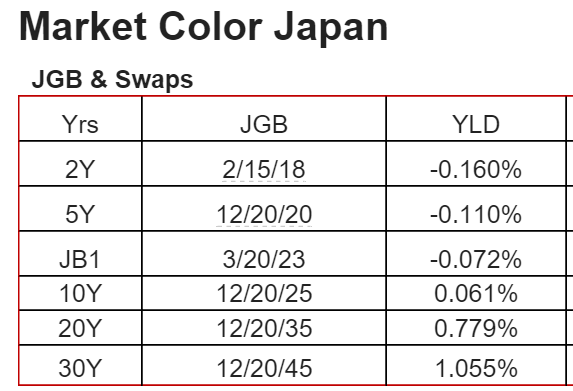
Yes, there are rumblings of a fiscal response, which could in fact immediately restore global demand, but it’s just talk at the moment, with all the ‘action’ coming from monetary policy, which, unfortunately, the CB’s have backwards. They think they are stepping on the gas pedal, when in fact they are stepping on the brake pedal. And when it doesn’t work, they just step on it that much harder. And after 2 decades of supporting data that shows it doesn’t work, they all say they just need a little more time… :(

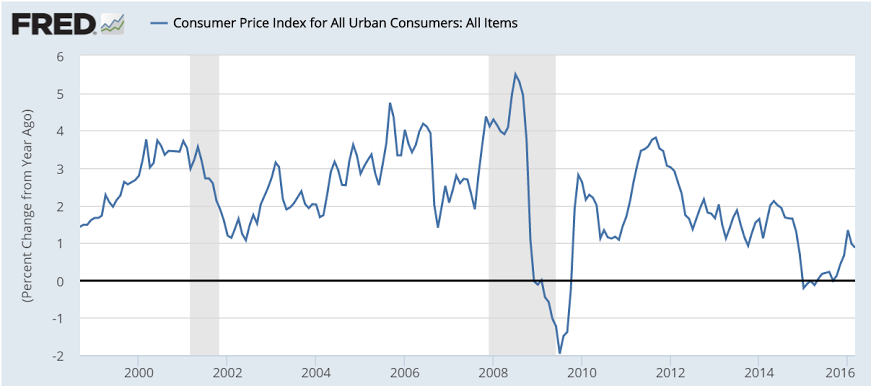
The Fed’s in a bit of a different position. Rightly or wrongly- it pretty much doesn’t matter if they are right or wrong- they believe the US economy is doing well enough to start tapping the brakes, as they did with their first rate increase. As previously discussed, that in fact adds a bit to aggregate demand via increased federal spending on interest, but so far the rate hike has been tiny and hasn’t been enough to move the demand needle. And if US GDP continues it’s deceleration and the Fed continues to fail to meet its inflation targets, it’s not impossible for them to reverse course and start lowering rates.

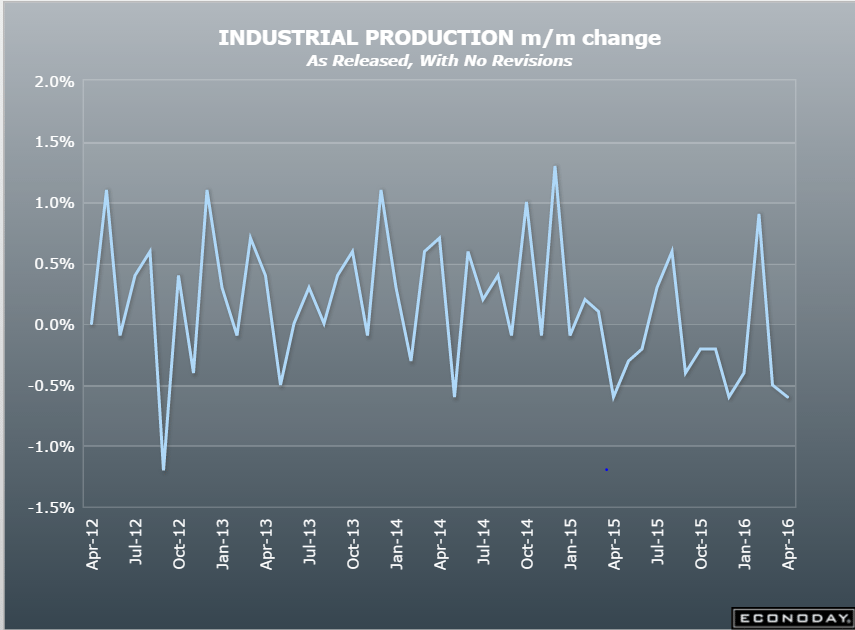
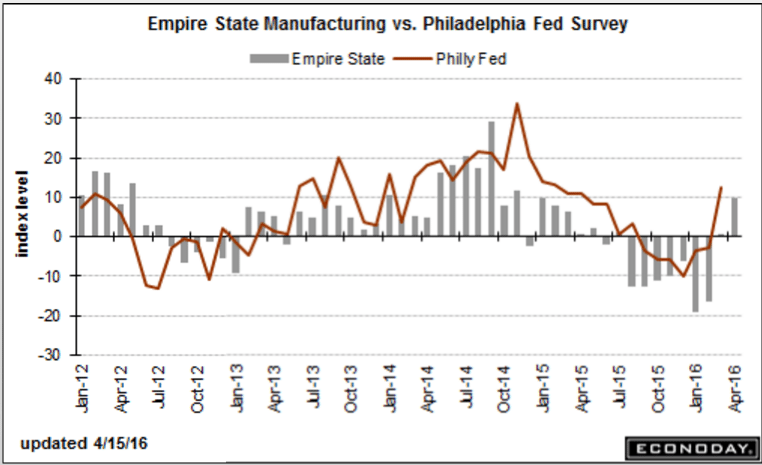
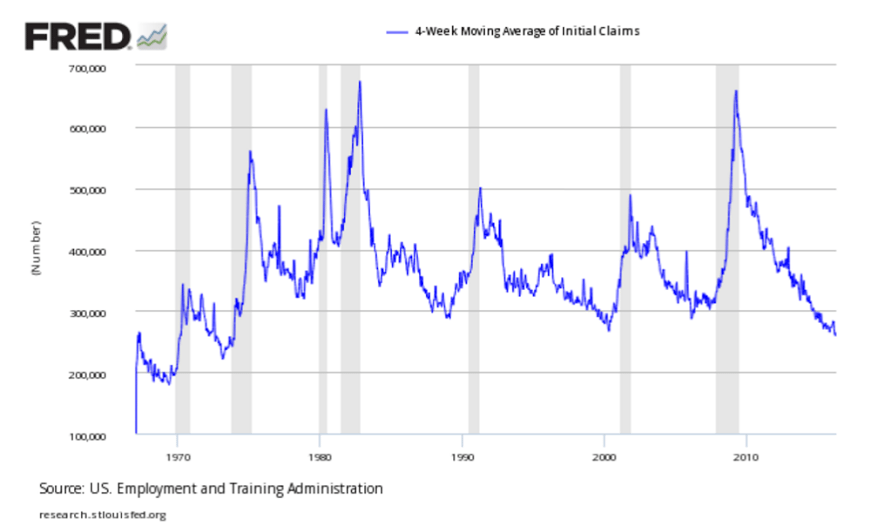
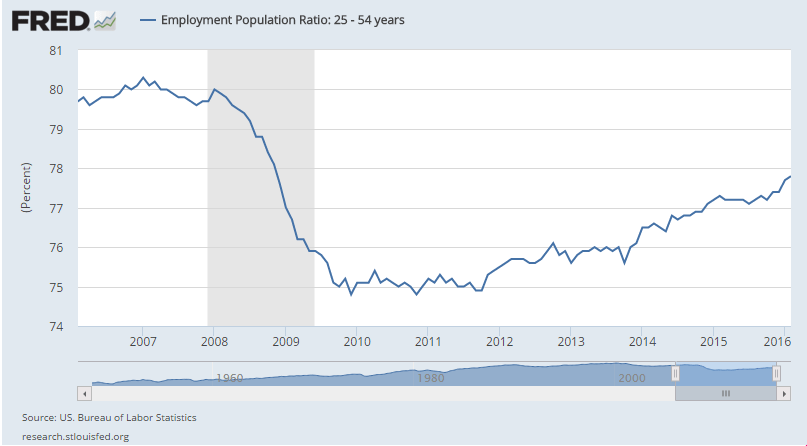
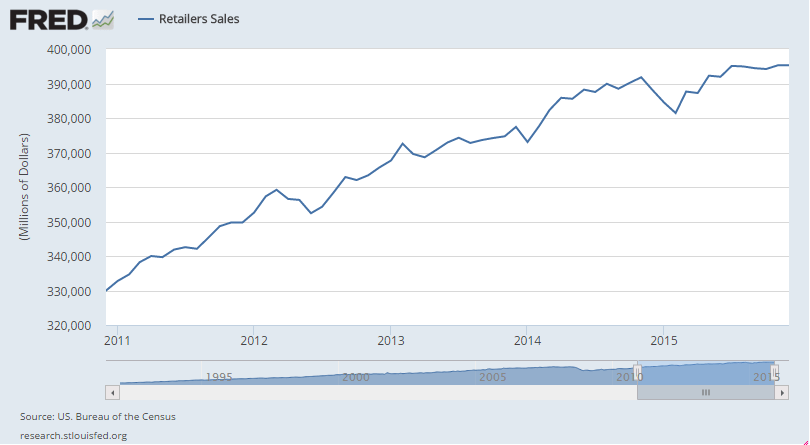
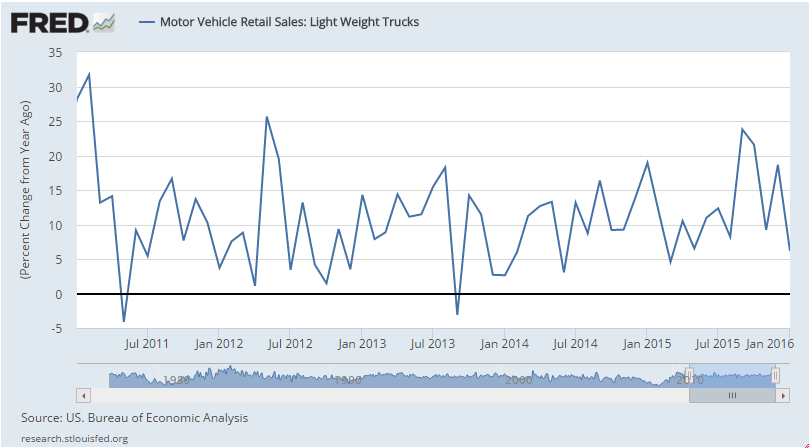
Meanwhile, the charts of the real US economy continue to fall/decelerate with most all pointing south, apart from new claims for unemployment which I believe is due to said claims having been made very hard to get, and not labor market conditions. And unemployment looks low only if you believe the drop in the labor participation rates are largely structural (all the women suddenly got too old to work in 2008…) which I find highly doubtful.

Nor do I see any signs of private sector deficit spending stepping up to the plate to replace lost capex spending, which, by the time it collapsed, was all that was left to support GDP growth.
And note that oil related spending cuts are still in progress. Firms are still cutting capex and US states as well as foreign oil producers are just this year cutting back spending due to reduced energy revenues. And all with no ‘offsets’ from other agents increasing their spending. And it all finally got to corporate top line growth and earnings, which have gone negative.

That all means we have to wait for federal deficit spending to increase which could be a long, ugly process.
er-4-24-9

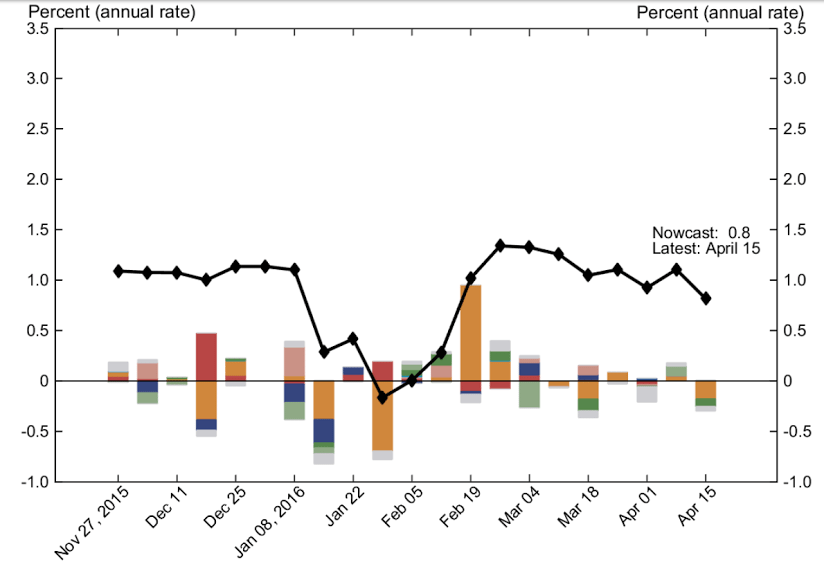
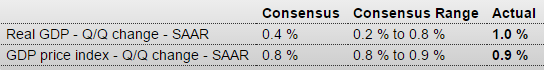
NY Fed Nowcast report:

er-4-24-10

er-4-24-11

Industrial production, Euro zone trade, China debt, Empire survey

Serious setback, worse than expected and last month revised down as well.

Look for more Q1 GDP reductions:

Industrial Production
er-4-15-16-7

From the Fed: Industrial production and Capacity Utilization

Industrial production decreased 0.6 percent in March for a second month in a row. For the first quarter as a whole, industrial production fell at an annual rate of 2.2 percent. A substantial portion of the overall decrease in March resulted from declines in the indexes for mining and utilities, which fell 2.9 percent and 1.2 percent, respectively; in addition, manufacturing output fell 0.3 percent. The sizable decrease in mining production continued the industry’s recent downward trajectory; the index has fallen in each of the past seven months, at an average pace of 1.6 percent per month. At 103.4 percent of its 2012 average, total industrial production in March was 2.0 percent below its year-earlier level. Capacity utilization for the industrial sector decreased 0.5 percentage point in March to 74.8 percent, a rate that is 5.2 percentage points below its long-run (1972–2015) average.

er-4-15-16-8
Trade surplus still chugging along, adding that much support to the euro:

Euro Area Balance of Trade

The trade surplus in the Eurozone decreased slightly to €19 billion in February of 2016 from a € 19.9 billion surplus a year earlier. Both exports and imports increased, recovering from falls in January. Balance of Trade in the Euro Area averaged 3804.90 EUR Million from 1999 until 2016, reaching an all time high of 31194.80 EUR Million in July of 2015 and a record low of -16509.80 EUR Million in January of 2011. Balance of Trade in the Euro Area is reported by the Eurostat.

Goes without saying when there’s a positive net propensity to ‘save’!
er-4-15-16-9
Better news here, though from depressed levels a survey response of ‘better than last month’ might not mean much in absolute terms. But always hoping for the best:
er-4-15-16-10

From the NY Fed: Empire State Manufacturing Survey

Business activity expanded for New York manufacturing firms for the first time in over a year, according to the April 2016 survey. After remaining in negative territory for seven months, the general business conditions index rose to a reading slightly above zero last month, and climbed nine more points to reach 9.6 in April.

er-4-15-16-11

Jobless Claims, Mtg Purchase index, Railcars, CPI, China

Lowest leve of new jobless claims ever on a per capita basis. Yet U6 unemployment remains near the highs of the prior recession. Leads me to suspect the reason for the low claims is they’ve become a lot harder to get, shutting off an automatic fiscal stabilizer, as previously discussed:
er-4-15-16-1
er-4-15-16-2
Nothing exciting happening from this point of view, either. The large year over year gains were only due to the large spike followed by a several month dip last year:
er-4-15-16-3

Rail Week Ending 09 April 2016: The Data Now Looks Recessionary

Week 14 of 2016 shows same week total rail traffic (from same week one year ago) declined according to the Association of American Railroads (AAR) traffic data. All rolling averages are in decline.

Lower than expected, Fed still failing to meet it’s target, even as energy and commodity prices increased as the $ weakened:

Consumer Price Index
er-4-15-16-4
Highlights
Slowing in shelter prices put the brakes on core consumer prices which, according to the Bureau of Labor Statistics, are no longer on a gradual path of acceleration. The core, which excludes food and energy, rose only 0.1 percent in March following two solid back-to-back gains of 0.3 percent. Year-on-year, the core is moving in the wrong direction, down 1 tenth to a 2.2 percent reading that justifies Janet Yellen’s doubts whether inflation, not getting much lift from wages, will show much traction this year.

The overall CPI, held down by food, also inched 0.1 percent higher in another disappointing reading. Year-on-year, the CPI is up only 0.9 percent and is also moving in the wrong direction, down 1 tenth from February.

Housing, pulled down by a 1.8 percent decline in away-from-home prices, inched only 0.1 percent higher for a year-on-year rate of only 2.1 percent. But other readings here are also soft including a 0.2 percent gain for owners’ equivalent rent. Food prices fell 0.2 percent on declines for fruits & vegetables and meat. Apparel was a major negative in the month, down 1.1 percent but following the prior month’s 1.6 percent gain. And service readings also weakened including medical care which rose only 0.1 percent following back-to-back gains of 0.5 percent. Energy prices were a positive, up 0.9 percent for the best monthly gain since May last year.

The ongoing rise in oil prices is coming at a good time for the inflation outlook and should help give a boost to future readings. But March’s results are very likely to push back expectations for the next Federal Reserve rate hike.

er-4-15-16-5
They are rediscovering fiscal does work. Must have been one heck of an argument with their western educated monetarists… ;)
er-4-15-16-6
China Fiscal Expenditure

Fiscal expenditure in China increased by 20.1 percent year-on-year in March 2016, while fiscal income expanded by 7.1 percent. Considering the first three months of 2016, the fiscal spending grew by 15.4 percent year-on-year. Growth in the revenue was 6.5 percent in the March quarter 2016. Fiscal Expenditure in China averaged 4064.64 CNY HML from 1990 until 2016, reaching an all time high of 25544.62 CNY HML in December of 2015 and a record low of 138.60 CNY HML in January of 1990. Fiscal Expenditure in China is reported by the National Bureau of Statistics of China.

Employment, Trade

Education employment was mysteriously down big last month and up big this month, so best to average the two months, which would mean about 205,000 new jobs each month, which is about where it’s been.

However, in any case hours worded and average pay were both down, which means personal income and probably output is that much less, which is not good. Additionally, the downward revision in earnings for last month and the negative print this month tell me ‘the market’ is telling us there’s still substantial ‘slack’ in the ‘labor market’:

Employment Situation
er-3-4-1
Highlights
The labor market is adding jobs at a very strong rate. Nonfarm payrolls rose 242,000 in February vs the Econoday consensus for 190,000 and a high estimate of only 217,000. Adding to the punch are upward revisions to the two prior months totaling 30,000.

A negative in the report is a 0.1 percent decline in average hourly earnings that follows, however, January’s outsized 0.5 percent gain. Year-on-year, average hourly earnings are down 3 tenths to 2.2 percent. Another negative is a dip in the workweek to 34.4 hours which also, however, follows strength in the prior month when it rose to 34.6 hours.

The unemployment rate remains low at 4.9 percent while the labor participation rate continues to rebound, up 2 tenths in the month to 62.9 percent and boosted by new entrants and re-entrants into the labor market. The U-6 unemployment rate, which is cited frequently by Janet Yellen, is down a full 2 tenths to 9.7 percent.

Payroll strength by industries includes a second straight strong month for retail, up 55,000, and another strong month for trade & transportation, up 53,000. Professional & business services rose 23,000 but temporary help services fell for a second straight month, down 10,000 following a 22,000 decline in January. Government added 12,000 to payrolls while construction, where spending is solid, rose 19,000. Mining and manufacturing contracted, down 19,000 and 16,000 respectively.

The earnings numbers are setbacks but do follow prior strength. Payroll gains are unquestionably impressive and today’s report will very likely revive at least the chance for a rate hike at this month’s FOMC.

This is why using a two month average makes sense this month:
er-3-4-2
The chart shows the rate of growth continues the deceleration that began just over a year ago when oil capex collapsed:
er-3-4-3
Still some serious ‘slack’ here:
er-3-4-4
Worse than expected and so not good for GDP forecasts, and with vehicle sales down from last year’s highs rising auto imports mean even weaker domestic car sales:

International Trade
er-3-4-5
Highlights
January was a weak month for cross-border trade with exports down a steep 2.1 percent and imports down 1.3 percent, making for a wider-than-expected trade imbalance of $45.7 billion. Exports of capital goods were especially weak as were imports of capital goods, both pointing to weakness in global business investment. Exports of industrial supplies were also down as were exports of consumer goods and also food products. Imports of industrial supplies were also down as were imports of consumer goods. Imports of autos, however, continue to rise to underscore the ongoing strength in vehicle sales.

The goods gap widened to $63.7 billion from $62.6 billion and when excluding petroleum where the gap narrowed, the goods gap widened to $57.8 billion from $55.5 billion. The nation continues to run a strong surplus on services, at $18.0 billion for a small gain in the month.

The gap with China widened in the month to $28.9 billion for a $1 billion increase while the gap with Europe narrowed sharply, to $8.8 billion from $13.7 billion. The gap with Japan narrowed to $4.9 billion from $6.6 billion while the gap with Canada widened to $2.4 billion from $2.2 billion.

Today’s report will lower early estimates for first-quarter GDP and no less importantly is the latest indication that global traffic is stalling, which is not a plus for global policy efforts to raise inflation.

In past cycles these declines in trade were indicative of recessions:
er-3-4-6
Trade also went bad as oil capex collapsed:
er-3-4-7

GDP, Trade, Personal income and outlays, Consumer sentiment, China deficit spending, 7DIF, US surveys, German business morale

Revised up but for the worst reasons possible- unsold inventories were higher. Also, consumption expenditures were a bit lower, and note the deceleration of GDP growth on the chart. And in all likelihood Q1 GDP is now being reduced by inventory liquidation substituting for production:

GDP
er-2-26-1
Highlights
An upward revision to inventory growth made for an upward revision to the second estimate of fourth-quarter GDP, to an annualized plus 1.0 percent rate for a 3 tenths increase from the initial estimate. But, given slowing in demand during the quarter, the gain for inventories, at $81.7 billion vs an initial estimate of $68.6 billion, very likely reflects a build in unwanted inventories.

A clear negative in today’s report is a downgrade for personal consumption expenditures, to an annualized plus 2.0 percent in the quarter vs an initial estimate of 2.2 percent. Otherwise, revised readings are steady to unchanged with non-residential investment, hit by the mining and energy sectors, down at a 1.9 percent rate and exports down at an even steeper 2.7 percent rate. Residential investment remains the big plus, rising at an 8.0 percent rate. But final sales were slow in the quarter, up only 1.2 percent.

The economy, held down by weak exports and weak business investment, fumbled into year-end 2015, but the early outlook for the first quarter calls for a turn higher to trend growth, perhaps as much as 3 percent. Key data for the first quarter will be posted later this morning with the January personal income and expenditures report.

er-2-26-2
Worse than expected which means GDP is running that much less then expected:

International Trade in Goods
er-2-26-3
Highlights
In a report pointing to economic weakness, the nation’s trade gap in goods widened 1.2 percent in January to $62.2 billion as exports fell 2.9 percent to offset a 1.5 percent fall in imports (imports are a subtraction in the national accounts). Exports fell across the board including industrial supplies at minus 3.0 percent in the month and capital goods down 2.3 percent. The decline in imports included a steep 6.8 percent drop in industrial supplies and a 2.4 percent decline for capital goods. The declines in industrial supplies are tied in part to low prices for oil and petroleum products while the declines in capital goods points to lack of global confidence in the business climate and lack of business investment in global productivity. This report represents the goods portion of the monthly international trade report which will be posted next Friday.

Better than expected, as spending was up from a very low December and a weak q4 that was today further revised down. And note that these number as well are subject to revisions over the coming months, with the spending numbers somewhat at odds with sales reports.

Personal Income and Outlays
er-2-26-4
Highlights
There’s plenty of life in the consumer. Personal income jumped 0.5 percent in January as did consumer spending, both readings higher than expected. Also higher than expected are the report’s inflation readings especially the core PCE which rose 0.3 percent for a year-on-year plus 1.7 percent.

Details are solidly positive with components on the income side led by wages & salaries, up a very strong 0.6 percent for the third large gain of the last four months. And consumers didn’t draw from savings on their January shopping spree, with the savings rate unchanged at a very solid 5.2 percent.

Components on the spending side are led by durable goods which jumped 1.2 percent and reflect strong vehicle sales in the month. Spending on services rose 0.6 percent in the month.

But the big story of the report is the core PCE, especially the year-on-year rate which is up from 1.4 percent to 1.7 percent and is pointing confidently toward the Fed’s 2 percent line. Total prices, which include food and energy, rose only 1 percent but the year-on-year rate for this reading has been on a tear, moving from about zero late last year to plus 1.3 percent in January.

Economic news outside of the consumer has been soft but today’s report is a reminder that the nation’s most important supporter is alert and in the driver’s seat. A strong consumer, who is benefitting from a strong labor market, together with the upward pivot for inflation will not make policy makers comfortable at next month’s FOMC where a rate hike, though long dismissed, may be a serious topic of discussion.

er-2-26-5
er-2-26-6

China considers itself bound by that treaty too??? Good luck to them. 4% isn’t near high enough to replace the lost private sector credit growth needed to sustain output and employment:

China could raise budget deficit to 4% of GDP:central bank official

Feb 25 (China Daily) — China could raise its budget deficit to 4 percent of GDP or even higher to offsetthe impact of reduced fiscal revenue and to support broader reforms, a central bank official said. In an article published by “The Economic Daily,” director of the central bank’s surveys andstatistics department Sheng Songcheng said the deficit increase would not incur biginsolvency risks for the government. China raised its budget deficit to 2.3 percent of GDP in 2015, up from 2.1 percent in 2014. A3-percent deficit ratio, as stated in the 1992 Maastricht Treaty, is normally considered a redline not to be crossed.

My book intro talk in Germany:


er-2-26-7
er-2-26-8

NY Mfg survey, Home builder’s index, oil losses, Japan, China trade, euro trade

A lot worse than expected and still deep in contraction:

Empire State Mfg Survey
er-2-16-1
Highlights
For the seventh straight month, the Empire State report is signaling significant contraction for the manufacturing sector. The general business conditions index for February came in below low-end expectations, at minus 16.64 vs even deeper contraction of minus 19.37 in January. New orders, at minus 11.63, are in contraction for a ninth month in a row while employment, though improving to minus 0.99 from minus 13.00, is in contraction for an eighth month in a row.

Shipments are in contraction at minus 11.56 with unfilled orders at minus 6.93. The workweek is at minus 5.94. One reading in the plus column is the six-month outlook, up nearly 5 points to 14.48 which, however, is unusually low for this reading which usually tracks in the 30s and 40s. Price data show marginal improvement for inputs but contraction for finished goods.

This report is showing its weakest run by far of the recovery and, unfortunately, points to extended weakness for the nation’s factory which is getting hit by weak exports and weak energy markets at home.

er-2-16-2
This is going the wrong way for what’s been promoted as the ‘driver’ of the economy for the year:

Housing Market Index
er-2-16-3
Highlights
Optimism among home builders is cooling noticeably, based on the housing market index for February which is down 3 points to 58 for the lowest reading since May last year. But 58 is still well over breakeven 50 with the future sales component actually rising 1 point to 65. The current sales component, however, is down 3 points to 65 which points to expected slowing for tomorrow’s starts & permits data. The traffic component has been holding down this report throughout the whole recovery and continues to do so, down a steep 5 points to 39 and the lowest reading since also May last year. Weakness here reflects lack of first-time buyers and also perhaps the major snowstorm that hit the East Coast at mid-month.

Details show step backwards for all four regions with the West, a key region for the new home sector, down 5 points to a still standout composite score of 68. The South and Midwest are both at 57 with the Northeast continuing to trail far behind, down 2 points to 45.

Builders are citing scarcity of both labor and available lots as negatives right now. Momentum in the housing sector was bumpy last year and, based on this report, looks to remain so, at least through the early part of this year.

As previously discussed, not good for bank, either:

High risk of bankruptcy for one-third of oil firms: Deloitte

Feb 16 (Reuters) — Roughly a third of oil producers are at high risk of slipping into bankruptcy this year as low commodity prices crimp their access to cash and ability to cut debt, according to a study by Deloitte. The report is based on a review of more than 500 publicly traded oil and natural gas exploration and production companies across the globe. The roughly 175 companies at risk of bankruptcy have more than $150 billion in debt, with the slipping value of secondary stock offerings and asset sales further hindering their ability to generate cash, Deloitte said in the report.

Pro active currency depreciation tends to have these kinds of consequences:

Japan’s household spending falls 2.7% in 2015

Feb 16 (Kyodo) — Japan’s average monthly household spending in 2015 fell 2.7 percent in price-adjusted real terms from the previous year to 247,126 yen for the second straight year of decrease. The drop followed a demand surge in the January to March period in 2014 before the consumption tax increase in April as well as weak sales of clothing due to an unusually warm winter, according to an official of the Internal Affairs and Communications Ministry. The decline compares with a 3.2 percent drop in 2014. Household spending figures are a key indicator of private spending, which accounts for around 60 percent of the nation’s gross domestic product.

Two things. First, weak exports tend to reflect weak global demand. Second, reduced imports tend to reflect weak domestic demand.

And the ‘solid’ -;)- trade surplus is a fundamental force that works to support the currency:

China Trade Surplus Hits Fresh Record High in January

China trade surplus stood at USD63.29 billion in January of 2016, widening from USD60.03 billion reported a year earlier and beating market consensus. It is the largest trade surplus on record, as exports and imports fell far worse than expected. In January, exports plunged by 11.2 percent year-on-year to USD177.48 billion, following a 1.4 percent fall in December 2015.Imports tumbled by 18.8 percent year-on-year to USD114.19 billion, following a 7.6 percent decline in the preceding month, the 14th straight month of contraction, as a result of declining commodity prices and weak demand.
Same for the euro:

er-2-16-4

Retail Sales, Import and Export prices, Business inventories, Consumer sentiment, Japan

Retail Sales
er-2-12-1
Highlights
Vehicles are back on top, helping to lift retail sales to a 0.2 percent gain in January. Excluding vehicles and pulled down by falling gas prices, sales inched only 0.1 percent higher. But retail sales excluding gasoline stations — which is a central reading given the price fall — are up 0.4 percent for a very respectable year-on-year gain of 4.5 percent. The reading excluding both autos and gasoline is also up 0.4 percent in the month for a year-on-year rate of plus 3.8 percent.

General merchandise sales, which have been soft reflecting price contraction for imports, rose a sharp 0.8 percent in January. Building materials rose 0.6 percent as did vehicles where the year-on-year rate is at plus 6.9 percent. Non-store retailers, reflecting building strength for e-commerce, are once again a standout, up 1.6 percent for a year-on-year 8.7 percent gain.

But there are soft spots in January including restaurants, down 0.5 percent but following a very strong run in prior months, and also furniture, also down 0.5 percent. Sporting goods, a discretionary but still small component, were also weak though the year-on-year rate is leading all the data at 9.1 percent.

A positive are upward revisions to December, now at plus 0.2 percent overall with ex-auto ex-gas now at plus 0.1 percent. Though many readings are modest, this report — especially the ex-gasoline reading — points to a healthy U.S. consumer and should lift confidence in first-quarter growth.

Doesn’t look all that strong to me. And there’s been an conspicuous flattening since July:
er-2-12-2
Just an fyi on light weight truck sales- growth has been falling off:
er-2-12-3
DOE gasoline output implied demand, year over year, 8 week moving average.

Growth rate has gone negative:
er-2-12-4
Deflationary bias continues:

Import and Export Prices
er-2-12-5
Highlights
Import price pressures are negative and severe but are increasingly centered in oil-based goods. Import prices fell 1.1 percent in January but fell only 0.2 percent when excluding petroleum imports. Year-on-year, total import prices are down 6.2 percent, which is steep but still an improvement from prior months. When excluding petroleum, import prices are down a year-on-year 3.1 percent (perhaps modest by comparison) which is also an improvement. But petroleum deflation is severe, with import prices down 13.4 percent in January for a year-on-year minus 35.3 percent.

Export prices fell 0.8 percent in January and reflect, in bad news for the farming sector, a 1.1 percent decline in prices of agricultural exports. Year-on-year, export prices are down 5.7 percent with agricultural products down 12.7 percent.

Price contraction for finished goods is easing though only incrementally. Import prices for both vehicles and consumer goods inched higher in the month with contraction in year-on-year rates narrowing, to only minus 0.3 percent for consumer goods. The export side also shows price improvement.

By countries, import prices with Canada, reflecting fuel prices, continue to fall severely, down 2.8 percent in the month for a year-on-year minus 12.6 percent. Latin America is next, down 1.2 percent and 7.8 percent on the year. Other regions are much narrower with China at minus 0.1 percent in the month and minus 1.6 percent on the year.

This report does fit in with FOMC expectations for an easing downward pull from import prices, at least excluding oil with prices for the latter, sooner or later as policy makers argue, certain to firm. An immediate plus is ongoing strength in the dollar which is pointing to easing import-price contraction for the February report.

er-2-12-6
Inventories still too high and climbing as sales continue to fall short of expectations:

Business Inventories
er-2-12-7

er-2-12-8
More softening of buying plans:

Consumer Sentiment
er-2-12-9

er-2-12-10

Japan Finance Minister says will take necessary steps to deal with FX volatility

Inventories, Payrolls, Trade

This is getting out of control.

Sales are slowing faster than inventories are being sold.
er-2-5-2
er-2-5-3
er-2-5-4
A weak print and year over year growth continues to decelerate as per the chart:

Employment Situation
er-2-5-5
Highlights
Headline weakness masks an otherwise solid employment report for January. Nonfarm payrolls rose 151,000 vs expectations for 188,000. December was revised 30,000 lower to 262,000 but November was revised 28,000 higher to 280,000. Now the signs of strength as the unemployment rate fell 1 tenth to 4.9 percent while the participation rate rose 1 tenth to 62.7 percent. In another sign of strength, the average workweek rose to 34.6 hours to end a long run at 34.5 hours. Average hourly earnings rose a very sharp 0.5 percent though the monthly gain didn’t make for any change in the year-on-year rate which holds steady at a still moderate 2.5 percent.

Manufacturing stands out in the industry data pointing to a strong January for the sector. Manufacturing hours rose in the month while payrolls jumped 29,000 for the best showing since November 2014. Retail trade, up 58,000, also posted its best gain since November 2014. Transportation & warehousing, in a sign of strength for the supply chain, rose 45,000 for the strongest showing since December 2012. On the negative side are temporary help services, down 25,000 but following strong gains in prior months. Government payrolls fell 7,000 as did mining where employment, hit by the drop in oil and commodity prices, was in contraction throughout 2015.

The labor market may be backing off slightly so far this year but it continues to approach full employment, a factor underscored by the month’s jump in hourly earnings and which offers support for further Federal Reserve rate hikes. Note that the big snow storm that hit the East Coast during the month came after the sample week and was not a factor in the data.

er-2-5-6
Yes, there was a monthly gain in the household survey, but on a year over year basis it decelerated from last month and the downtrend remains intact:
er-2-5-7
Wage growth remains well below prior lows and is only back to where it peaked in 2014:
er-2-5-8
The trade gap continues to widen even as the price of oil remains low, as exports weaken:

International Trade
er-2-5-9
Highlights
The nation’s trade deficit widened in December to $43.4 billion from a revised $42.2 billion in November. Exports have been extremely weak and weakened further, down 0.3 percent to $181.5 billion in the month. Exports of civilian aircraft fell sharply with exports of industrial supplies and foods/feeds/beverages also down. Imports rose 0.3 percent to $224.9 billion led by autos and industrial supplies and offsetting a decline for non-auto consumer goods.

Country balances show a $3.4 billion narrowing with China to a $27.9 billion monthly gap and little change with the E.U. at $13.7 billion. The gap with Japan widened by $0.9 billion to $6.6 billion while the gap with Mexico narrowed by $0.7 billion to $4.6 billion. The gap with Canada widened sharply by $1.7 billion to $2.2 billion.

The decline in exports is the latest hard evidence of global effects made more severe for U.S. exporters by the strength of the dollar, but the rise in imports, despite the decline in consumer goods, offers a positive indication on domestic demand, strength underscored this morning by the January employment report.

er-2-5-10

China and Russia buying gold

Seems it’s always a central bank story.

Goes up when they buy, down when they sell.

Furthermore gold buying is supported by how it’s accounted for. That is, it doesn’t count as deficit spending or part of the pubic debt, even though the ‘taxpayer’ has to pay interest on the funds spent, just like any other deficit spending. Gold purchases are accounted for not as an ‘expense’ as ‘normal’ govt spending, but as purchases of an asset that remains on the balance sheet at ‘cost’. And yes, the funds spent provide the economy with ‘that which is needed to pay taxes’ just like any other govt spending, and thereby ‘use up’ aggregate demand (‘fiscal space’) created by taxation and residual savings desires just like any other govt spending.

So it’s a political choice promoted by institutional structure that allows central bankers to buy all the gold they want without the political restrictions of other spending.

China, Russia lead central banks gold buying spree

By Cecilia Jamasmie

Jan 13 — China and Russia added more gold to its reserves in November, leading the latest global central banks buying spree that saw them adding 55 tonnes of the yellow metal to their coffers, up almost 90% from the prior month.

According to the latest World Gold Council’s gold reserve data, released Wednesday, China and Russia were once again the biggest buyers, with 21 tonnes and 22 tonnes added to their respective reserves.

The People’s Bank of China (PBoC) released data last week that showed 19 tonnes were added in December as well. But based on official figures, released last June for the first time since April 2009 and updated monthly ever since, the amount of gold held by the PBOC still only accounts for around 1.7% of its total reserves.

The increased purchases by the world’s sixth largest official sector gold holder could lend support to international prices of the precious metal, say analysts.

China, Russia lead central banks gold buying spree

er-2-5-1

Despite a jump in prices at the start of the year, gold is still trading close to historic lows. February gold was last up $3.00 at $1,088.50 an ounce, well down from last week’s two-month high of $1,113.10 an ounce, basis February Comex futures.

Japan, China, Fed comment, Capex cutbacks, South Korea

This is the yen yield curve after over 20 years of a 0 rate policy, massive QE, and now negative overnight rates. Maybe now the economy will finally respond.
:(

(And how good can the BOJ think the economy is?)
er-2-1-1

The western educated kids/monetarists who’ve taken control don’t seem to be doing all that well, as China begins to look like the other countries they’ve taken over, like the EU, US, etc. etc. etc. What they learned is that it’s about balancing the federal budget and using monetary policy to support growth and employment as needed, allowing ‘free markets’ to ‘clear’ as per their general equilibrium models that earned them advanced degrees. Unfortunately they fail to recognize the currency itself is a (simple) public monopoly which obviates all those ‘market clearing’ assumptions in their models:

China official PMI misses in January, Caixin PMI shows contraction

Jan 31 (CNBC) — China’s factory activity skidded to a three-year low point in January, adding to further gloom about the state of the world’s second-largest economy.

The government-compiled January manufacturing purchasing manager’s index (PMI) came in at 49.4, slightly missing Reuters consensus estimates for a 49.6 reading and ticking down from December’s 49.7 figure. It was the weakest result since 2012 and marked the sixth straight month in contraction territory.

The mood was worsened by a private survey by Caixin and Markit that showed January manufacturing activity shrinking for the eleventh straight month. Caixin’s survey, which tracks smaller firms than the official indicator, came in at 48.4, compared to December’s reading of 48.2.

Does this read like an executive who’s organization has a $200 million per year research budget?

They just hiked rates in December with every chart I’ve seen having been heading south for a year or so?

And GDP was right on forecast.

Seems to me this ‘kind of tells him’ the fundamental assumptions behind his models needs a rethink?

Fed’s Williams says sees ‘smidgen’ slower rate hikes

Jan 29 (Reuters) — “Standard monetary policy strategy says a little less inflation, maybe a little less growth … argue for just a smidgen slower process of normalizing rates,” San Francisco Fed President John Williams said. “We got a little stronger dollar, some mixed data on the economy, some weakness in Q4 GDP, all of those coming together kind of tell me that we probably need a little bit more monetary accommodation this year than I was thinking in the middle of December.” Williams said his “modal” forecast, remains fundamentally unchanged for 2016 and 2017. “The thing that has changed is that commodity prices keep coming down,” he said.

The hits keep on coming with no replacement spending in sight:

Chevron Posts Loss, Readies More Layoffs

Jan 29 (WSJ) — Chevron is slashing its capital spending by more than $9 billion this year. Chevron plans to sell up to $10 billion in oil fields and other assets through 2017. A $26.6 billion spending plan detailed in December will have to be reduced given how much oil-market conditions have since deteriorated, he company said. Chevron reported a loss of $588 million, or 31 cents a share, in the fourth quarter, down from a profit of $3.47 billion, or $1.85 a share, in the year-earlier period. Revenue tumbled 37% to $29.25 billion. In Chevron’s refining division profits were cut nearly in half, falling to $496 million.

For Mining Chiefs, Doomsday Scenarios Could Become Reality

Jan 29 (WSJ) — Refined-copper supply jumped 36% to 22.5 million tons from 2005 to 2014, according to ICSG data. Over that same period, annual copper consumption increased 38% to 22.9 million tons. Total Chinese copper imports fell to 8.6 million tons in 2015, down 2.2% from the year before. Global refined supply rose 1.8% over the same period, largely because of a 4% increase in refined production from China. China imports of unfinished copper and products in December rose 26% in annual terms to 530,000 tons. More than 600,000 tons of copper supply have been taken out of the market over the past 12 months, according to Morgan Stanley.

Not the worst indicator for global growth:

South Korean Exports Fall at Fastest Pace Since Financial Crisis

Jan 31 (WSJ) — Korean exports, the first shipments data released each month in Asia, slid 18.5% to $36.74 billion in January, the steepest fall since August 2009. The decline extended a run of monthly falls into a 13th month. Imports plunged 20.1% from a year earlier to $31.42 billion in January. For all of 2015, Korean shipments overseas contracted 8%—the steepest fall in six years and the first 12-month contraction in three years, the government said. The Nikkei PMI reading for January came in at 49.5, down from 50.7 in December.