If this is true Putin is even dumber or more subject to special interest influence than I thought.
Someone please tell me if it isn’t!

If this is true Putin is even dumber or more subject to special interest influence than I thought.
Someone please tell me if it isn’t!
My RT interview starts at the 4 min mark.
The cut it into segments that will appear at a later date.
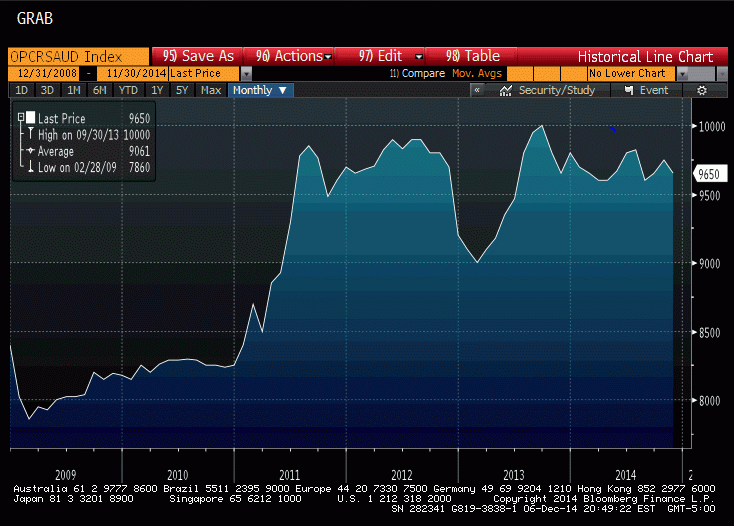
Saudis post prices for refiners, then let them buy all they want at those prices. The chart shows the ‘residual demand’ for crude oil has been reasonably steady, indicating that the price did not move due to any kind of a ‘supply glut’ but to Saudi pricing:
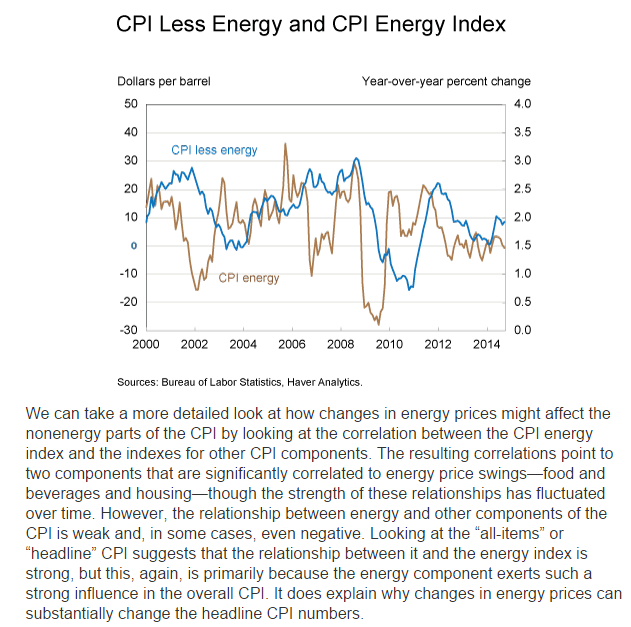
To my point about crude price cuts triggering a general deflation, this is from the Cleveland Fed. Note that in 2008 the price of crude went to 35 but only briefly. My concern is that if crude were to stay low the deflationary effect would continue perhaps until prior relative value was restored:
Since the CPI is most directly influenced by oil price changes through its energy component, one question that remains is whether or not other components in the CPI are influenced by low oil prices. Generally, energy prices are rather volatile, and so energy components are often excluded when predicting inflation because of that volatility. Forecasters focus on “core” measures instead. The recent decline in oil prices is of less concern to many CPI forecasters, because it may not affect the “core” price level. It would be a bit more concerning, however, if low oil prices also affected other domestic prices as well. A quick look at the year-over-year percent changes in the energy CPI and the CPI excluding energy suggests changes in energy prices are often followed by similar changes in the rest of the CPI’s components.
November budget review-up slightly year over year for November
From the Congressional Budget Office:
The federal government’s budget deficit was $181 billion for the first two months of fiscal year 2015, $45 billion less than the shortfall recorded in October and November of last year, CBO estimates. That outcome was affected by shifts in the timing of certain payments. Without those shifts, the deficit would have declined by just $9 billion.
Estimated Deficit in November 2014: $59 Billion
CBO estimates that the government recorded a deficit of $59 billion in November 2014—$76 billion less than the deficit in November 2013. But shifts in the timing of certain payments (because the regular payment dates fell on weekends) boosted spending in November 2013 and reduced it in November 2014. Without those shifts, the November 2014 deficit would have been $3 billion more than the November 2013 deficit.
Individual income taxes and payroll taxes together increased by $5 billion (or 2 percent); a $4 billion increase in withheld taxes explains nearly all of that change.
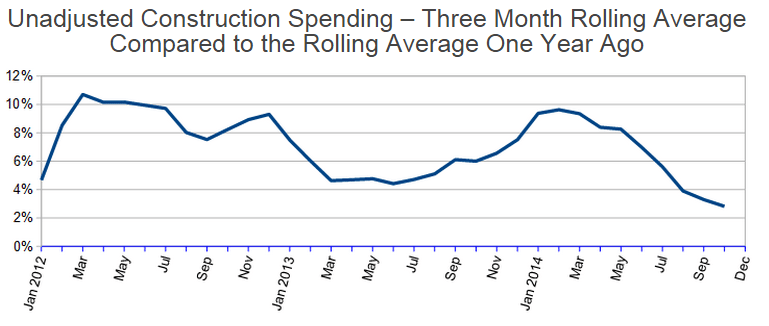
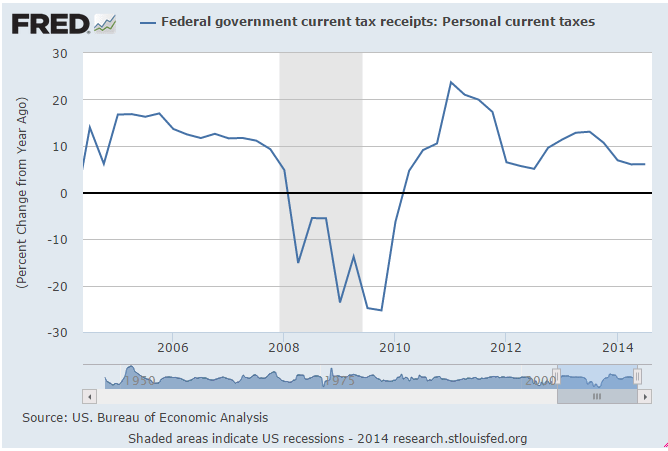
This is quarterly data released a couple of weeks ago. You can see the growth had slowed to 6.1%, and now most recently is down to 2%, which is a red flag for negative GDP growth:
A bit of a move up this week, but still not much happening
Still going nowhere:
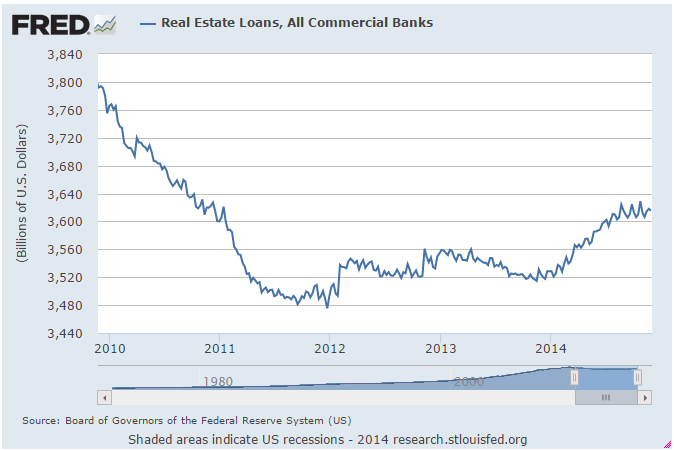
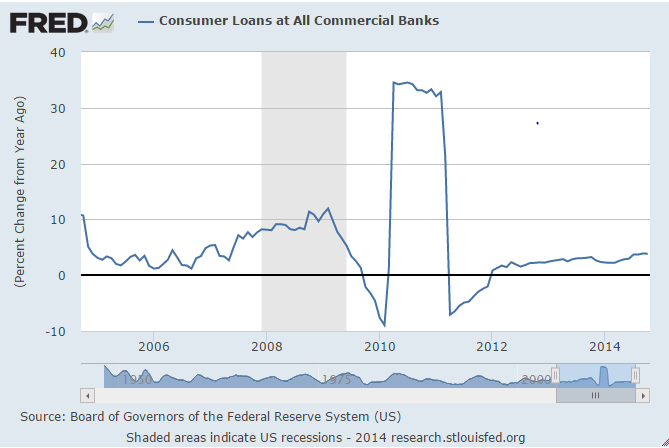
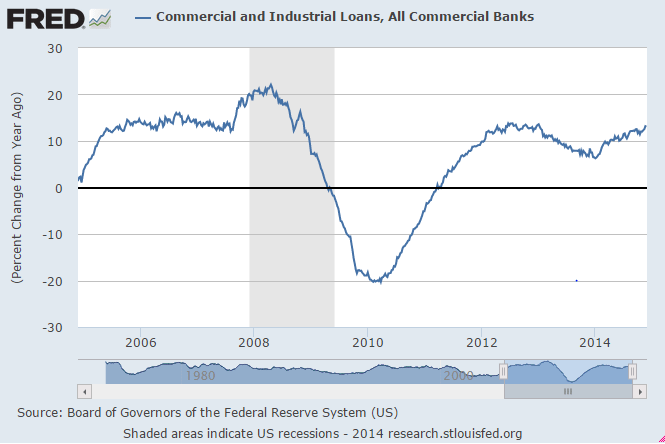
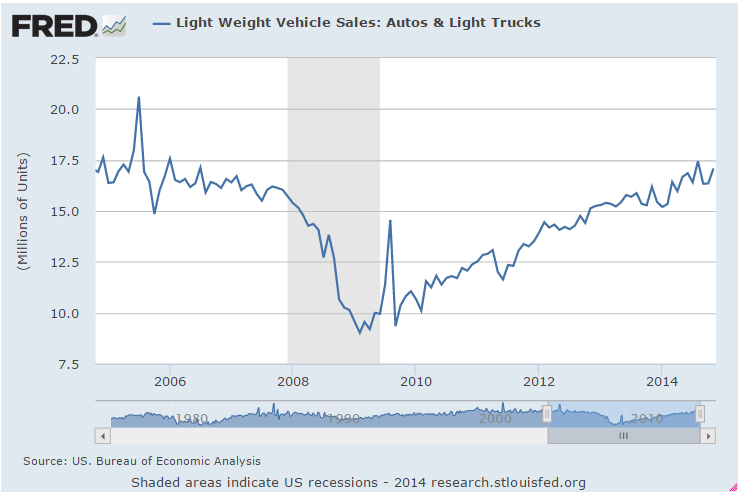
So all the talk is about a rate hike next year. And not much talk about what that’s supposed to do. The mainstream presumes, for example, that a rate hike will somehow moderate ‘inflation’ through the lending channel. That is, higher rates will discourage borrowing and thereby moderate borrowing to spend. Setting aside the point about the effect of increased income to savers/investors, etc, and to their narrow point, exactly which ‘borrowing to spend’ needs ‘cooling off’?
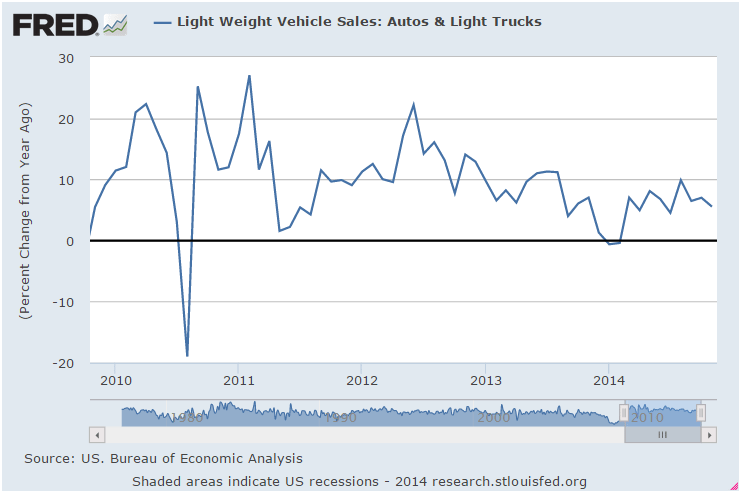
Housing has near flat lined at historic lows, and even the growth rate of the one ‘bright spot’- cars- has been slowing. And from the above charts it doesn’t look to me like there’s any ‘excess credit growth’ problem they’d want to cool down via a rate hike anywhere in sight?
Not that they won’t do it anyway, just on general principles that the interest rate they set ‘should’ be higher than the ‘rate of inflation’, ‘or else’ something ‘bad’ will happen…
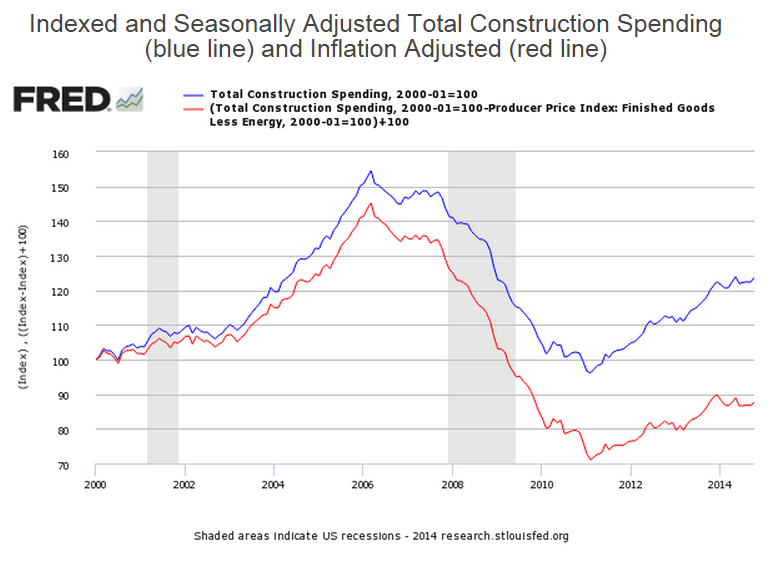
St. Louis Fed just updated this series:
The growth rate isn’t accelerating:
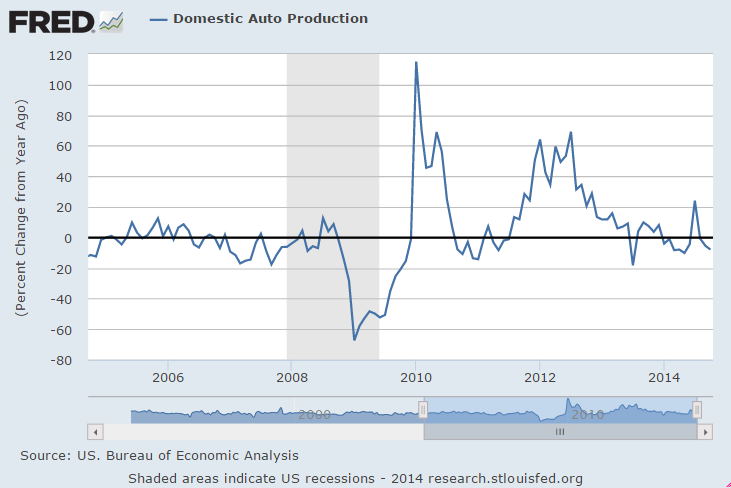
This was released Nov 26
Production not going anywhere:
Lower than expected and it’s been soft in any case, keeping a lid on personal consumption expenditures:
Consumer Credit
First the release and mainstream commentary:
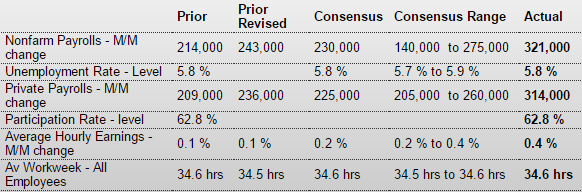
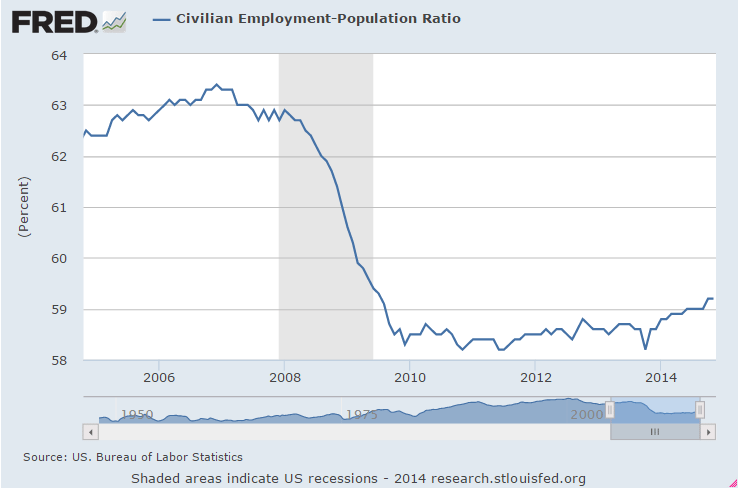
Employment Situation
Highlights
The November employment situation was significantly stronger than expected. Payroll jobs jumped 321,000 after gaining 243,000 in October. Analysts expected a 230,000 rise and the November boost topped the high forecast for 275,000. September and October gains were revised up notably by a net 44,000. The unemployment rate held steady at 5.8 percent. Expectations were for 5.8 percent. Wages rose sharply in the latest month.
Going back to the payroll report, private payrolls advanced 314,000 after increasing 236,000 in October. Analysts projected 225,000.
Goods-producing jobs gained 48,000 in November after a 28,000 advance the month before. Manufacturing employment increased 28,000 in November, following a boost of 20,000 in October. Motor vehicles and parts rose 11,000, after increasing 5,000 the month before. Construction jumped 20,000 after a gain of 7,000 in October. Mining slipped 1,000 in November, following no change the prior month.
Private service-providing jobs jumped 266,000 after a 208,000 increase in October. Strength again was in professional & business services and retail trade.
Average hourly earnings jumped 0.4 percent in November after edging up 0.1 percent the month before. Expectations were for a 0.2 percent rise. Average weekly hours edged up to 34.6 hours from 34.5 hours in October. Analysts expected 34.6 hours.
The November employment report clearly shows an improving economy. This suggests improving profits but also likely will raise chatter of the Fed moving forward the first increase in policy rates.
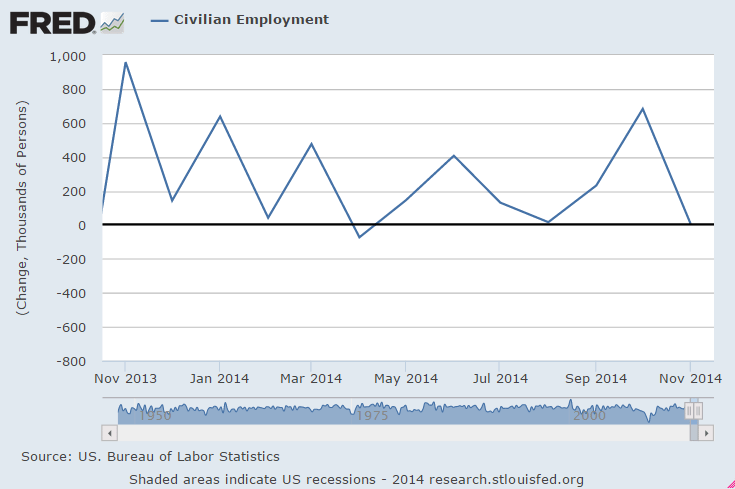
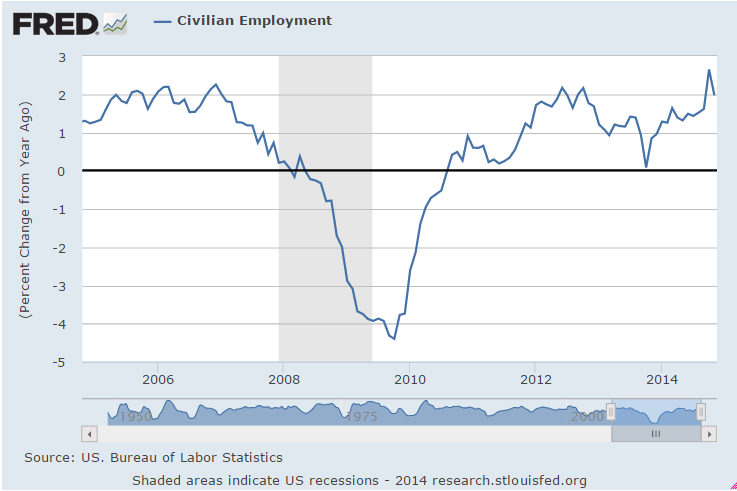
Here’s a longer term view:
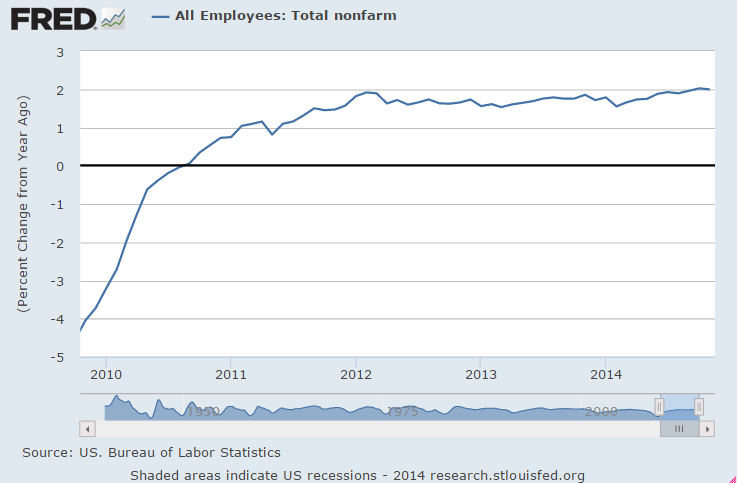
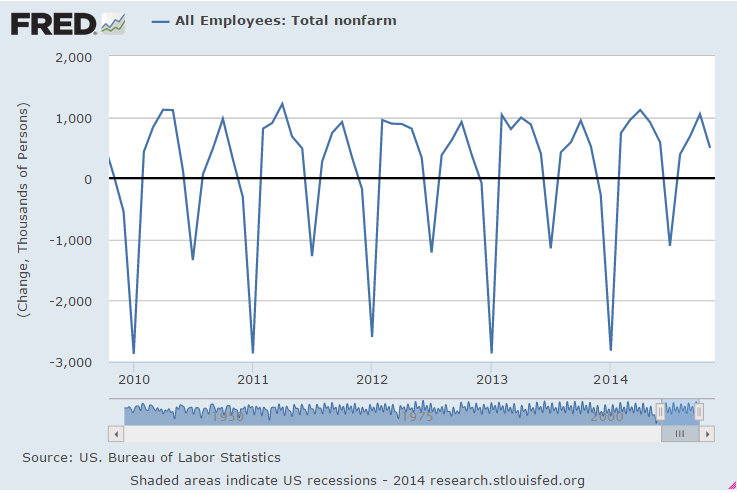
And here’s the Nonfarm Payroll numbers not seasonally adjusted they convert to monthly numbers with their adjustments, which they’ve recently redone:

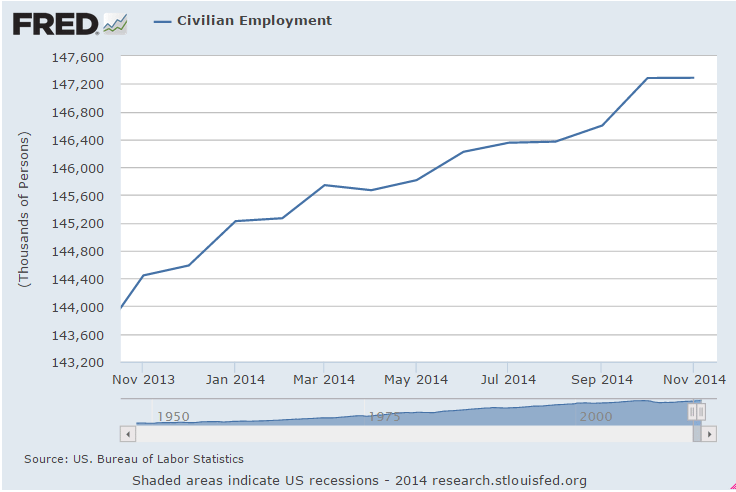
And here are the household survey releases that showed 0 jobs after a near 700,000 gain the month before and 0 the month before that. Over time the household survey and Nonfarm Payroll report tend to converge:
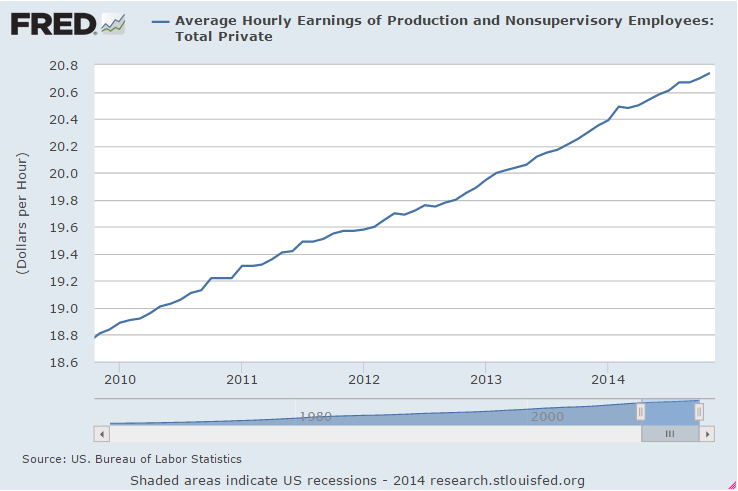
And they are spinning this as a dangerous uptick in compensation:
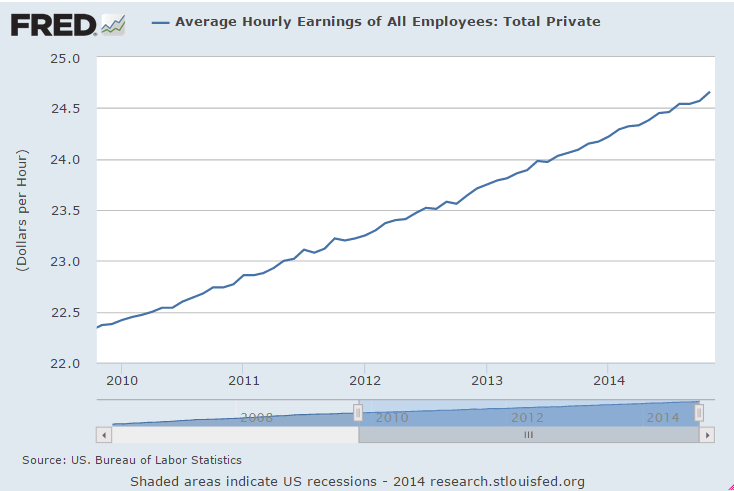
This is more straight forward and indicative of ‘improvement’:
Crude pricing
The Saudis are the ‘supplier of last resort’/swing producer. Every day the world buys all the crude the other producers sell to the highest bidder and then go to the Saudis for the last 9-10 million barrels that are getting consumed. They either pay the Saudis price or shut the lights off, rendering the Saudis price setter/swing producer.
Specifically, the Saudis don’t sell at spot price in the market place, but instead simply post prices for their customers/refiners and let them buy all they want at those prices.
And most recently the prices they have posted have been fixed spreads from various benchmarks, like Brent.
Saudi spread pricing works like this:
Assume, for purposes of illustration, Saudi crude would sell at a discount of $1 vs Brent (due to higher refining costs etc.) if they let ‘the market’ decide the spread by selling a specific quantity at ‘market prices’/to the highest bidder. Instead, however, they announce they will sell at a $2 discount to Brent and let the refiners buy all they want.
So what happens?
The answer first- this sets a downward price spiral in motion. Refiners see the lower price available from the Saudis and lower the price they are willing to pay everyone else. And everyone else is a ‘price taker’ selling to the highest bidder, which is now $1 lower than ‘indifference levels’. When the other suppliers sell $1 lower than before the Saudi price cut/larger discount of $1, the Brent price drops by $1. Saudi crude is then available for $1 less than before, as the $2 discount remains in place. Etc. etc. with no end until either:
1) The Saudis change the discount/raise their price
2) Physical demand goes up beyond the Saudis capacity to increase production
And setting the spread north of ‘neutral’ causes prices to rise, etc.
Bottom line is the Saudis set price, and have engineered the latest decline. There was no shift in net global supply/demand as evidenced by Saudi output remaining relatively stable throughout.
The Global Economy
If all the crude had simply been sold to the highest bidder/market prices, in a non monetary relative value world the amount consumed would have been ‘supply limited’ based on the real marginal cost, etc. And if prices were falling do to an increased supply offered for sale, the relative price of crude would be falling as the supply purchased and consumed rose. This would represent an increase in real output and real consumption/real GDP(yes, real emissions, etc.)
However, that’s not the case with the Saudis as price setter. The world was not operating on a ‘quantity constrained’ basis as the Saudis were continuously willing to sell more than the world wanted to purchase from them at their price. If there was any increase in non Saudi supply, total crude sales/consumption remained as before, but with the Saudis selling that much less.
Therefore, with the drop in prices, at least in the near term, output/consumption/GDP doesn’t per se go up.
Nor, in theory, in a market economy/flexible prices, does the relative value of crude change. Instead, all other prices simply adjust downward in line with the drop in crude prices.
Let me elaborate.
In a market economy (not to say that we actually have one) only one price need be set and with all others gravitating towards ‘indifference levels’. In fact, one price must be set or it’s all a ‘non starter’. So which price is set today? Mainstream economists ponder over this, and, as they’ve overlooked the fact that the currency is a public monopoly, have concluded that the price level exists today for whatever ‘historic’ reasons, and the important question is not how it got here, but what might make it change from today’s level. That is, what might cause ‘inflation’. That’s where inflation expectations theory comes in. For lack of a better reason, the ‘residual’ is that it’s inflation expectations that cause changes in the price level. And not anything else, which are relative value stories. And they operate through two channels- workers demanding higher wages and people accelerating purchases. Hence the fixation on wages as the cause of inflation, and using ‘monetary policy’ to accelerate purchases, etc.
Regardless of the ‘internal merits’ of this conclusion, it’s all obviated by the fact that the currency itself is a simple public monopoly, rendering govt price setter. Note the introduction of monetary taxation, the basis of the currency, is coercive, and obviously not a ‘market expense’ for the taxpayer, and therefore the idea of ‘neutrality’ of the currency in entirely inapplicable. In fact, since the $ to pay taxes and buy govt secs, assuming no counterfeiting, ultimately come only from the govt of issue, (as they say in the Fed, you can’t have a reserve drain without a prior reserve add), the price level is entirely a function of prices paid by the govt when it spends and/or collateral demanded when it lends. Said another way, since we need the govt’s $ to pay taxes, the govt is, whether it knows it or not, setting ‘terms of exchange’ when it buys our goods and service.
Note too that monopolists set two prices, the value of their product/price level as just described above, and what’s called the ‘own rate’/how it exchanges for itself, which for the currency is the interest rate, which is set by a vote at the CB.
The govt/mainstream, of course, has no concept of all this, as inflation expectations theory remains ‘well anchored.’ ;)
In fact, when confronted, argues aggressively that I’m wrong (story of my life- remember, they laughed at the Yugo…)
What they have done is set up a reasonably deflationary purchasing program, of buying from the lowest bidder in competition, and managed to keep federal wages/compensation a bit ‘behind the curve’ as well, partially indexed to their consumer price index, etc.
And consequently, govt has defacto advocated pricing power to the active monopolist, the Saudis, which explains why changes in crude prices and ‘inflation’ track as closely as they do.
Therefore, the way I see it is the latest Saudi price cuts are revaluing the dollar (along with other currencies with similar policies, which is most all of them) higher. A dollar now buys more oil and, to the extend we have a market economy that reflects relative value, more of most everything else. That is, it’s a powerful ‘deflationary bias’ (consequently rewarding ‘savers’ at the expense of ‘borrowers’) without necessarily increasing real output.
In fact, real output could go lower due to an induced credit contraction, next up.
Banking
Deflation is highly problematic for banks. Here’s what happened at my bank to illustrate the principle:
We had a $6.5 million loan on the books with $11 million of collateral backing it. Then, in 2009 the properties were appraised at only $8 million. This caused the regulators to ‘classify’ the loan and give it only $4 million in value for purposes of calculating our assets and capital. So our stated capital was reduced by $2.5 million, even though the borrower was still paying and there was more than enough market value left to cover us.
So the point is, even with conservative loan to value ratios of the collateral, a drop in collateral values nonetheless reduces a banks reported capital. In theory, that means if the banking system needs an 8% capital ratio, and is comfortably ahead at 10%, with conservative loan to value ratios, a 10% across the board drop in assets prices introduces the next ‘financial crisis’. It’s only a crisis because the regulators make it one, of course, but that’s today’s reality.
Additionally, making new loans in a deflationary environment is highly problematic in general for similar reasons. And the reduction in ‘borrowing to spend’ on energy and related capital goods and services is also a strong contractionary bias.
UPDATE: Saudi Arabia cuts all oil prices to U.S., Asia – Bloomberg (OIL)
Dec 4 — Saudi Arabia cuts all oil prices to U.S. and Asia, according to Bloomberg headlines.
UPDATE: Reports have the message issued by Saudi Aramco — the state-owned oil and gas giant — now recalled.
Remember, this is their forecast for Friday, not hard data from their subscribers:
ADP Employment Report
Highlights
ADP’s estimate for private payroll growth for November is 208,000 vs the Econoday consensus for 225,000 and against a revised 233,000 for October. The corresponding Econoday consensus for Friday’s jobs report from the government is 225,000 vs October’s 209,000.
Both ADP and the BLS data have shown new jobs working their way lower after peaking earlier in the year after dipping for the cold winter and at the same time absorbing some of the 1.2 million who lost benefits at year end and subsequently took menial jobs:
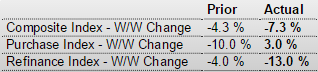
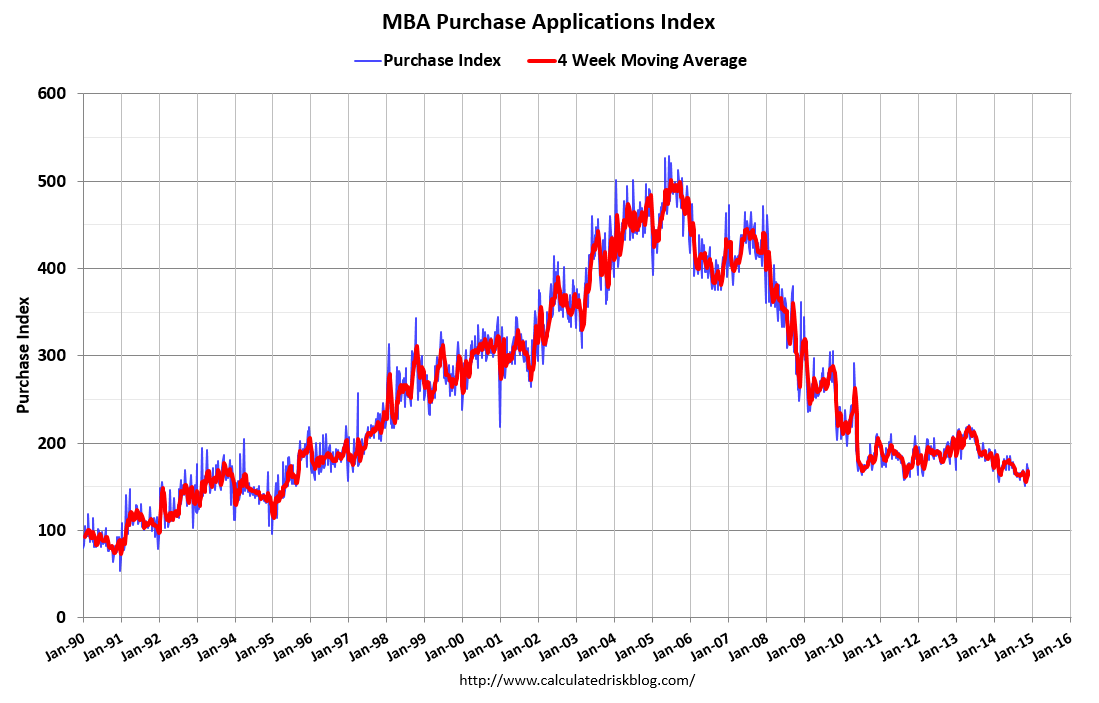
Mtg purchase apps still down year over year and moving sideways at best:
MBA Purchase Applications
Highlights
The purchase index snapped back in the holiday shortened November 28 week, rising 3.0 percent after falling 10.0 percent in the prior week. The gain helped the year-on-year reading which improved to minus 4.0 percent from minus 10.0 percent. The refinance index, however, continues its long run in negative trend, down a steep 13.0 percent for a sixth straight decline. Rates were mostly lower in the week with the average 30-year mortgage for conforming loans ($417,000 or less) down 7 basis points in the week to 4.08 percent.
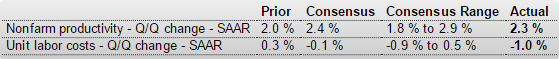
The decline in unit labor costs might be of interest to the Fed:
Productivity and Costs
Highlights
Nonfarm productivity growth for the third quarter was revised up to an annualized 2.3 percent from the first estimate of 2.0 percent and following a 2.9 percent boost in the second quarter. Unit labor costs were revised down notably to minus 1.0 percent from a first estimate of up 0.3 percent after falling an annualized 3.7 percent in the second quarter.
Output growth slowed to 4.9 percent in the third quarter, following a 5.5 percent jump the prior quarter. Compensation growth in the third quarter was up 1.3 percent annualized after a dip of 0.9 percent the previous period.
Year-on-year, productivity was up 1.0 percent in the third quarter, down from 1.3 percent in the second quarter. Year-ago unit labor costs were up 1.2 percent, compared to up 0.7 percent in the second quarter.
The latest productivity report points to positive company profits and mild gains in consumer income.
Good news on the ISM survey, though the employment index fell:
ISM Non-Mfg Index
Highlights
ISM’s non-manufacturing sample reports very solid conditions, at a composite 59.3 in November vs 57.1 in October. Aside from August’s 59.6, November is a recovery high going back more than 9 years. New orders are very strong, up 2.3 points in the month to 61.4 with backlog orders up 4.0 points to 55.5 in a reading last matched in April 2011. Strength in orders is keeping up business activity which rose 4.4 points to a very strong 64.4. Employment remains solid but did slow 2.9 points from October’s near record of 59.6. Deliveries slowed noticeably, which is another sign of strength, while inventories rose. Pressures on input prices rose a bit to 54.4 which, however, is still benign for this reading. A look at industries shows the retail sector at top, which of course is very good news going into the holidays, and construction right behind which is also very good news. This report points to solid year-end acceleration for the economy.
Meanwhile, the oil drilling slowdown might be on the high side of expectations:
Exclusive: New U.S. oil and gas well November permits tumble nearly 40 percent
By Kristin Hays
Dec 2 (Reuters) — Plunging oil prices sparked a drop of almost 40 percent in new well permits issued across the United States in November, in a sudden pause in the growth of the U.S. shale oil and gas boom that started around 2007.
Data provided exclusively to Reuters on Tuesday by industry data firm Drilling Info Inc showed 4,520 new well permits were approved last month, down from 7,227 in October.
The pullback was a “very quick response” to U.S. crude prices, which settled on Tuesday at $66.88 CLc1, said Allen Gilmer, chief executive officer of Drilling Info.
New permits, which indicate what drilling rigs will be doing 60-90 days in the future, showed steep declines for the first time this year across the top three U.S. onshore fields: the Permian Basin and Eagle Ford in Texas and North Dakota’s Bakken shale.
The Permian Basin in West Texas and New Mexico showed a 38 percent decline in new oil and gas well permits last month, while the Eagle Ford and Bakken permit counts fell 28 percent and 29 percent, respectively, the data showed.