Business inventories, retail sales charts, Atlanta Fed

Still way high, especially with today’s retail sales growth at 0

United States : Business Inventories
er-5-13-1
Highlights
Business inventories don’t look quite as bloated after a small 0.1 percent gain in March that is under the 0.4 percent gain in business sales, taking the stock-to-sales ratio down to 1.36 from February’s recovery high of 1.37.

The improvement in March is centered, however, in the retail sector where, thanks to that month’s surge in sales, the stock-to-sales ratio slipped to 1.46 from 1.47. Whether further improvement can be expected in April is uncertain given this morning’s disappointing retail sales report.

The stock-to-sales ratios for the report’s two other components were unchanged, at 1.35 for manufacturers and at 1.30 for wholesalers.

Inventory overhang, built up during the slow first quarter, is widely seen as a risk for second-quarter growth, though this report suggests that the inventory headwind may not be that severe. Today’s data follow yesterday’s small business optimism report where inventory readings were surprisingly low.
er-5-13-2
er-5-13-3
er-5-13-4
er-5-13-5
er-5-13-6

Q2 forecast down to .7% as nothing yet stepping up to replace the lost oil and gas capex spending:
er-5-13-7

EU GDP, Mtg apps, retail sales

European Union : GDP Flash

er-5-13-8

Highlights
Eurozone economic activity extended its recovery into last quarter with a provisional and slightly smaller than expected 0.4 percent increase in real GDP versus the previous period. The fourth quarter rise was unrevised at 0.3 percent and annual growth edged a tick firmer to 1.0 percent. In line with normal procedure, Eurostat provided no details of the latest GDP expenditure components.

Growth was hindered by a sharp slowdown in Germany where total output expanded a quarterly 0.3 percent following a 0.7 percent rise at the end of last year. However, France (0.6 percent after 0.0 percent) was surprisingly robust and Spain (0.9 percent after 0.7 percent) posted its strongest performance in more than seven years. Italy (0.3 percent after 0.0 percent) saw its first positive print since the third quarter of 2013. Amongst the smaller countries Cyprus (1.6 percent after minus 0.4 percent) finally pulled out of recession but Finland (minus 0.1 percent after minus 0.2 percent) saw a second successive quarter of falling output.

Early signals on the current quarter have pointed to little change in Eurozone economic momentum which will probably be seen as disappointing by policymakers and investors alike. Still, the ECB’s QE programme was only launched in March so much of its potential benefit has yet to be realised. That said, with the region’s inflation currently running at just a provisional 0.0 percent annual rate, Eurozone governments and the ECB will be hoping for a significantly stronger growth profile over the second half of the year.

Q2 not getting any help here…

United States : MBA Mortgage Applications
er-5-13-9

Still not spending that gas savings…
Q2 still not showing signs of life

Retail Sales
er-5-13-10

NFIB chart, NY Fed debt chart, April tax collections

Small increase and still down from year end levels, still very low historically, real sales- what matters most- were down:

er-5-12-5

Small Business Optimism Rises, But Future Sales Cloud Outlook

The Small Business Optimism Index increased 1.7 points from March to 96.9, this in spite of a quarter of virtually no economic growth. Unfortunately, the Index remained below the January reading. Nine of the 10 Index components gained, only real sales expectations were weaker. But this still leaves the Index below its historical average, oscillating between 95 and 98 but never breaking out except for December, when the Index just tipped past 100, only to fall again.

Debt balances not growing:

er-5-12-6

Delinquencies, Foreclosures and Bankruptcies Improve as Household Debt Stays Flat

The Federal Reserve Bank of New York’s Household Debt and Credit Report revealed that aggregate household debt balances were largely flat in the first quarter of 2015. As of the end of March, total household indebtedness was $11.85 trillion, a $24 billion, or 0.2 percent, increase during the first quarter of this year. The report is based on data from the New York Fed’s Consumer Credit Panel, a nationally representative sample drawn from anonymized Equifax credit data.

The slowdown in growth can be attributed to a negligible uptick in mortgage balances, which are the largest component of household debt. Mortgage balances stood at $8.17 trillion in the first quarter. Additionally, balances on home equity lines of credit (HELOC), which were $510 billion at the end of fourth quarter, 2014, were unchanged in the first quarter of this year.

Non-housing debt balances increased by 0.7 percent from the end of last year, largely due to increases in student loans ($32 billion) and auto loans ($13 billion). These gains were partially offset by a $16 billion decline in credit card balances.

I seem to recall something going very wrong after this happened in 2008?

The U.S. budget surplus in April rose to the highest level since 2008 on record revenue as hiring improved during a month when Americans file tax returns.

Redbook retail sales, Small business confidence, JOLTS, Japan budget

So now they don’t have Easter to kick around anymore and they’re still weak:

Redbook
er-5-12-1
Retail sales picked up slightly in the May 9 week as Easter-effects finally fade, but at a year-on-year plus 2.1 percent sales remain soft. Redbook reports an as-expected Mother’s Day holiday in the week and reports early buying for graduation. Tomorrow the government will post its April retail sales report which is expected to show a solid rate excluding autos.
er-5-12-2

About the only things showing hope are some of the surveys, just like last quarter (which is now looking to be revised into negative territory):

NFIB Small Business Optimism Index
er-5-12-3

And you have to read pretty far into this story before you realize the numbers were down vs the prior month:

BLS: Jobs Openings at 5.0 million in March, Up 19% Year-over-year

From the BLS:

There were 5.0 million job openings on the last business day of March, little changed from 5.1 million in February, the U.S. Bureau of Labor Statistics reported today. Hires were little changed at 5.1 million in March and separations were little changed at 5.0 million….

Quits are generally voluntary separations initiated by the employee. Therefore, the quits rate can serve as a measure of workers’ willingness or ability to leave jobs. … There were 2.8 million quits in March, little changed from February.

JOLTS
er-5-12-4
Highlights
Yesterday’s labor market conditions index was very soft as is today’s JOLTS report where job openings fell 2.9 percent to 4.994 million in March from a revised 5.144 million in February. This is well below the Econoday consensus for 5.158 million.

Despite the March fall-off, workers appear to be confident in the labor market judging by their willingness to quit. The quits rate rose 1 tenth in the month to 2.0 percent. The hiring rate in the month held steady at 3.6 percent.

Last week’s employment report for April proved much better than March but was still soft, a description underscored by today’s report. Not soft, however, have been weekly jobless claims which will be posted on Thursday.

They still don’t get it:

Japan seen targeting 1% primary deficit in fiscal 2018

May 12 (Nikkei) — Japan will likely aim to cut its primary deficit to about 1% of gross domestic product by fiscal 2018 through spending cuts and other measures, with an eye toward its goal of achieving a surplus by fiscal 2020. Japan’s potential growth rate currently falls short of 1%, and its primary deficit is expected to total 3.3% of GDP this fiscal year at 16.4 trillion yen ($135 billion). According to conservative calculations by the Cabinet Office, which assume real economic growth of 1% or so and nominal growth of over 1%, Japan would face a primary deficit of 15.7 trillion yen in fiscal 2018 — equivalent to 3% of GDP.

China, Bunds, and Fed’s labor market index

As if rate cuts will help:

China cuts interest rates for third time since Nov as economy sputters

May 10 (Reuters) — China’s central bank cut its benchmark lending rate by 25 basis points to 5.1 percent on Sunday, its third reduction since November, as economic growth cools to levels not seen since the global financial crisis.

The People’s Bank of China (PBOC) also reduced one-year benchmark deposit rates by 25 basis points to 2.25 percent, it said in a statement on its website, adding that the reductions would be effective on May 11.

This is a ‘blow up’? All the way up to half a percent for a 10 year bund…

Markets blew up the bunds and helped Greece

er-5-11-1

No one still quite knows what this is:

United States : Labor Market Conditions Index
er-5-11-2
Highlights
The labor market is very soft based on the Fed’s labor market conditions index which is in negative ground for a second straight month, at minus 1.9 in April vs a downward revised minus 1.8 in March. These are the first negative readings in 3 years and follow last week’s April employment report which was no better than mixed. Based on this report, which takes a broad view of the labor market, the Fed will be in no hurry to raise rates. But two reports later this week have definitely been signaling strength in the labor market: JOLTS on Tuesday and jobless claims on Thursday.

china pmi, ADP, productivity

Still slipping in Q2

China : PMI Composite
er-5-6-1

Highlights
HSBC China Composite PMI, which covers both manufacturing and services, indicated an expansion of Chinese business activity in April but at a weaker pace. Activity growth slowed to a three month low with a reading of 51.3, down from 51.8 in March. The slower expansion of total business activity was largely driven by a stagnation of manufacturing output in April, following three months of growth.

Another weak forecast for Friday’s employment report:

ADP Employment Report
er-5-6-2

Highlights
ADP correctly signaled a weak employment report for March and it’s signaling another weak report for April, at only 169,000 for its private payroll gauge which is far under the Econoday concensus for 205,000 and just under the low estimate for 170,000. ADP’s estimate for March is now revised 14,000 lower to 175,000. For comparison, the Econoday consensus for private payroll growth in Friday’s employment report is 223,000 with the low estimate at 170,000. ADP doesn’t always move the markets but it may today, raising talk of another soft employment report on Friday

This tells me business has more employees than it needs and most likely will adjust accordingly:

Productivity and Costs
er-5-6-3

Lumber prices, UK pmi, West Coast Port Traffic, trade, PMI and ISM services index

From Calculated Risk:
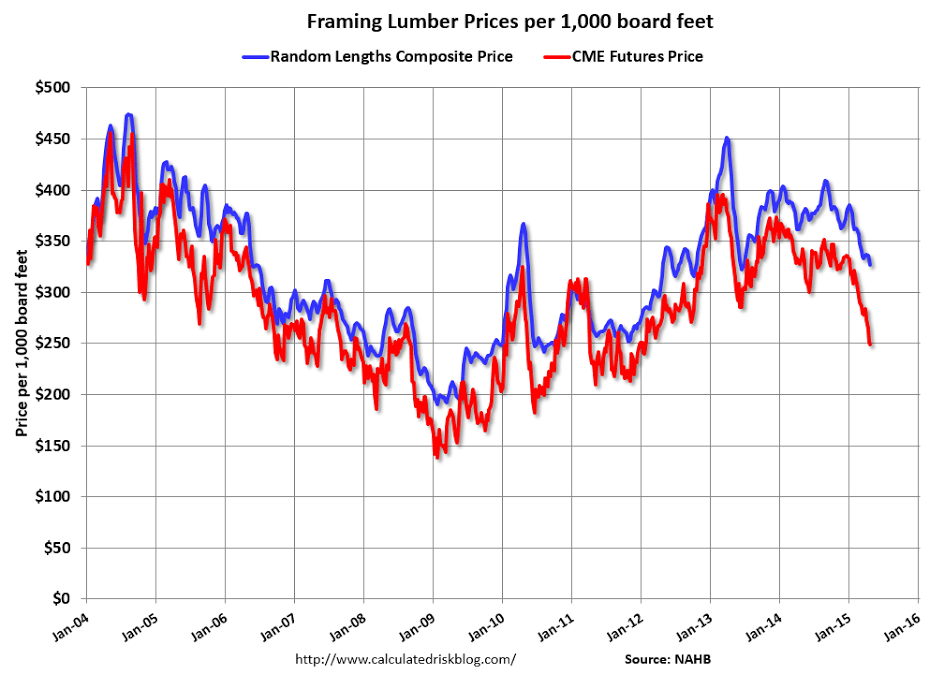
Right now Random Lengths prices are down about 11% from a year ago, and CME futures are down around 25% year-over-year.
er-5-5-1

Stll positive but more recent numbers coming in worse than expected:

Great Britain : PMI Construction
er-5-5-2
Highlights
Business activity in UK construction slowed unexpectedly quickly last month. At 54.2 the sector PMI was 3.6 points short of its March outturn and at its weakest level since June 2013. However, the April print was still well above the 50 growth mark and its decline was probably at least in part due to supply shortages.
er-5-5-3
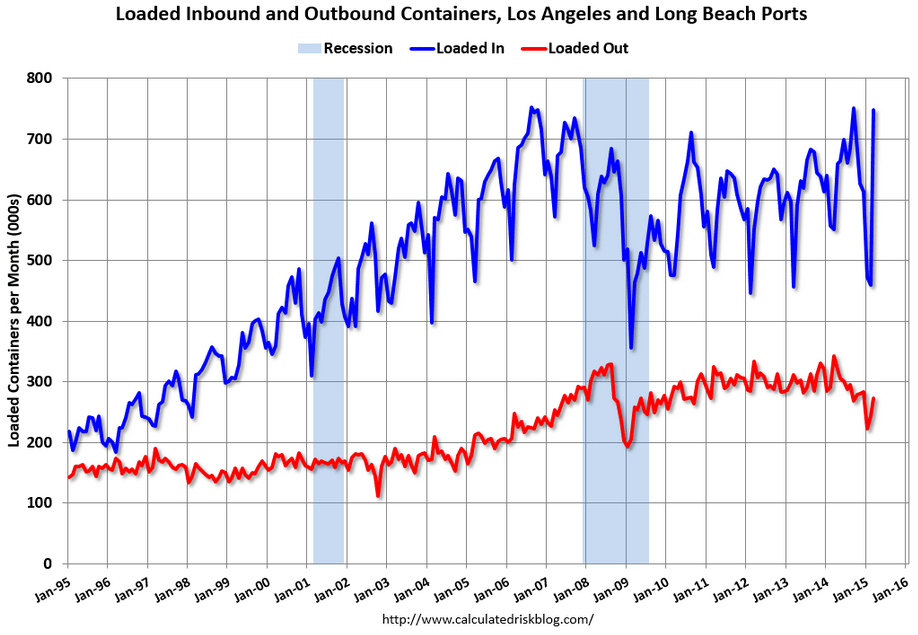
Note: West Coast port traffic increased sharply in March following the resolution of the labor issue in February. The workers were catching up with all the ships anchored in the harbor (now gone).

Both imports and exports rebounded in March, but imports rebounded more – and were up 36% year-over-year – whereas exports were down 20% year-over-year.

This suggests more imports from Asia in March, and also suggests the trade deficit was significantly higher in March than in February.

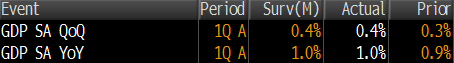
Well below expectations, hearing Q1 being revised down .5%, as Americans spend their gas savings on other imports from China and Japan. ;) And the growing US trade deficit/EU current account surplus fundamentally supports the euro vs the dollar.

United States : International Trade
er-5-5-4
Highlights
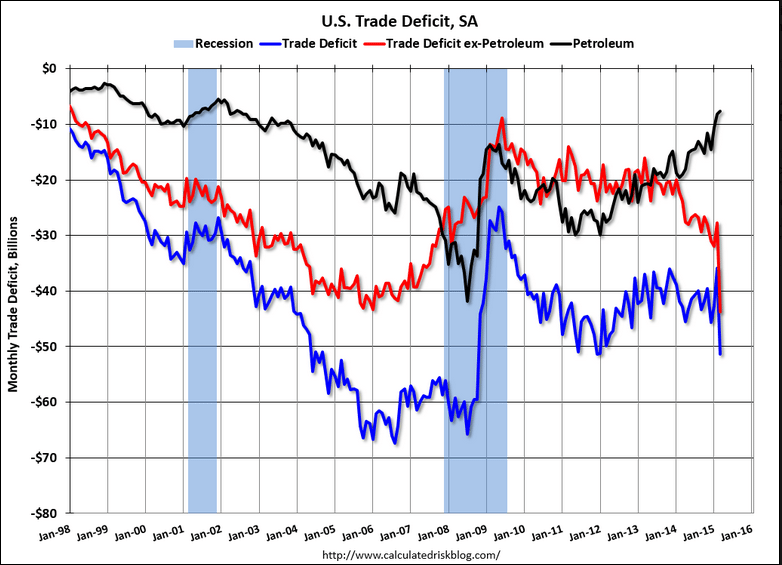
First-quarter GDP, barely above zero at plus 0.2 percent, may move into the negative column on revision following a much higher-than-expected March trade deficit of $51.4 billion, the largest since October 2008. The unwinding of the port strike on the West Coast, which was resolved mid-month March, played a major role in the data especially evident in imports which surged $17.1 billion in the month as backlogs at the ports were cleared. Imports of consumer goods, especially cell phones, were especially heavy. Exports, led by aircraft, also rose but only $1.6 billion. The total goods gap in the month was $70.6 billion which is the highest since August 2008.

The gap in petroleum trade, at $7.7 billion vs February’s $8.2 billion, wasn’t a major factor in the March data as the drop in prices was offset by a rise in volumes. By country, the gap with China widened to $31.2 vs $22.5 billion in February and to $7.1 billion vs $4.2 billion for Japan. The OPEC gap widened slightly to $1.2 billion vs $0.7 billion.
er-5-5-5
Still blaming the Easter Bunny for this:
er-5-5-6

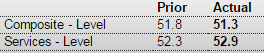
United States : PMI Services Index
er-5-5-7

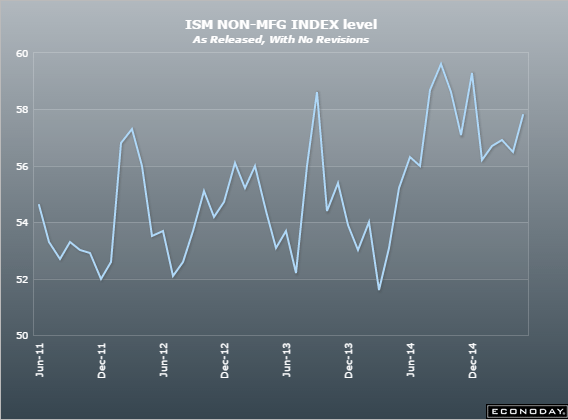
Uptick here so still showing growth, first glimmer of hope for a positive Q2:

United States : ISM Non-Mfg Index
er-5-5-8
er-5-5-9

Cleveland Fed on low wage growth, Atlanta Fed Q2 gdpnow, factory orders

Behind the Slow Pace of Wage Growth

er-5-4-1

er-5-4-2

Factory Orders
er-5-4-3
Highlights
Boosted by aircraft and also by motor vehicles, factory orders rose an as-expected 2.1 percent in March. March’s gain ends what were 7 straight declines as February, which was initially at plus 0.2 percent, is revised now to minus 0.1 percent. The 7 straight declines are the most striking evidence of how hard the manufacturing sector has been hit, by the strong dollar that weakens exports and also specific trouble in the energy sector due to the downturn in oil.

But in March, the sector got a big boost from civilian aircraft, an industry where big monthly swings are normal, but also from motor vehicle & parts where orders rose 6.0 percent in what is one of the very strongest gains of the recovery. Excluding transportation, however, orders were unchanged compared to only a 0.1 percent gain in February, with the latter revised down sharply from an initial reading of plus 0.8 percent.

Energy equipment rebounded 4.8 percent in the month but following a long streak of declines including an 18.5 percent drop in February. Industrial machinery was also down on the month. Other industries on the plus side include computers and defense capital goods.

Orders for capital goods in general were mixed, up only 0.1 percent on the core, which excludes aircraft, and extending their downward slope.

Other readings include a sizable 0.5 percent rise in shipments. Another plus is a small rise in unfilled orders which have been especially weak. Inventories held steady relative to sales, with the inventory-to-sales rate unchanged at 1.35.

The pop in March ends the first quarter on a positive note but the early indications on the second quarter, despite expectations of an outsized weather boost, have all been soft.
er-5-4-4

Remember all that cheerleading last year about how NOW capex was going to pick up?
er-5-4-5
er-5-4-6
er-5-4-7
No chance of recession?
er-5-4-9