Comments on transport weakness, Draghi comments, Japan exports to US, new home sales,PMI and Fed indexes chart, Dallas Fed, Richmond Fed, Consumer confidence

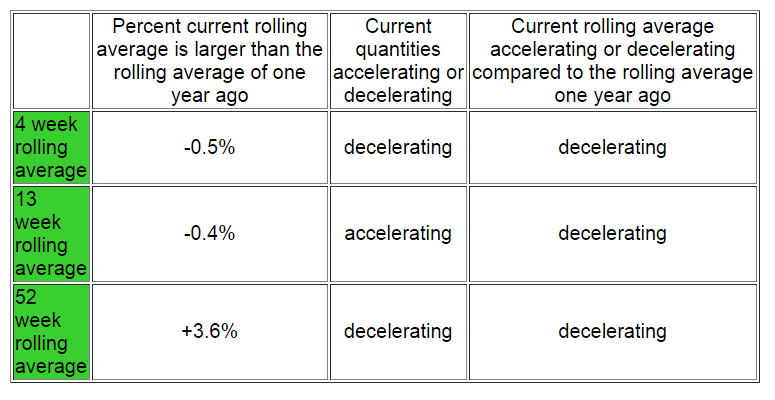
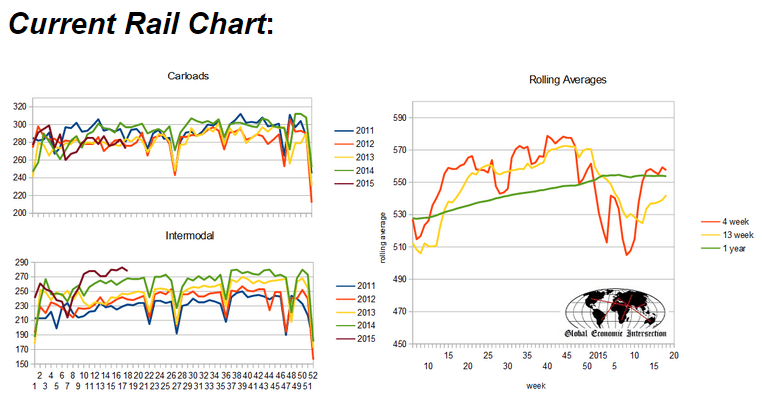
Transport Is Saying Consumer Spending Should Slow Further

By Steven Hansen

When one analyzes the economy, there are always some sections which do better than others. When the economic growth is weak (like currently), several segments can be in contraction while others are expanding.

Everything but the needed fiscal relaxation:

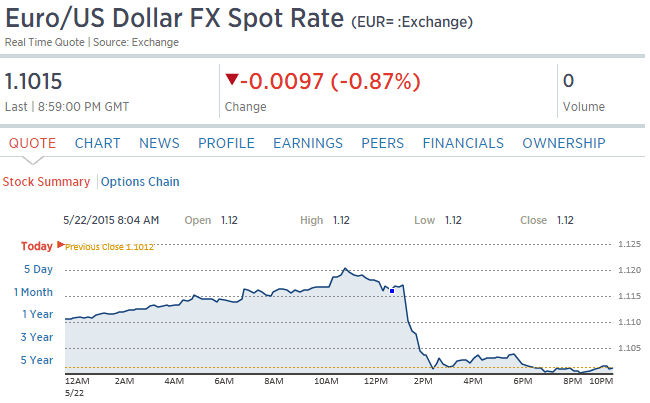
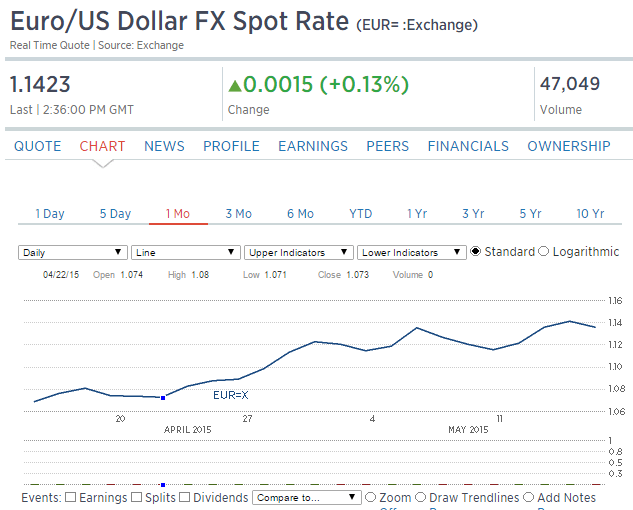
ECB’s Draghi urges euro zone to unite for economic reform

May 23 (Reuters) — “The current situation in the euro area demonstrates that this delay could be dangerous,” ECB President Mario Draghi said while acknowledging progress had been made, for example with banking union. But private risks need to be shared within the euro zone, with financial integration improving access to credit for companies and leading to a complete capital markets union, Draghi said. Countries should observe common standards when implementing structural reforms but also take a country-specific approach, as part of a process of “convergence in the capacity of our economies to resist shocks and grow together”.

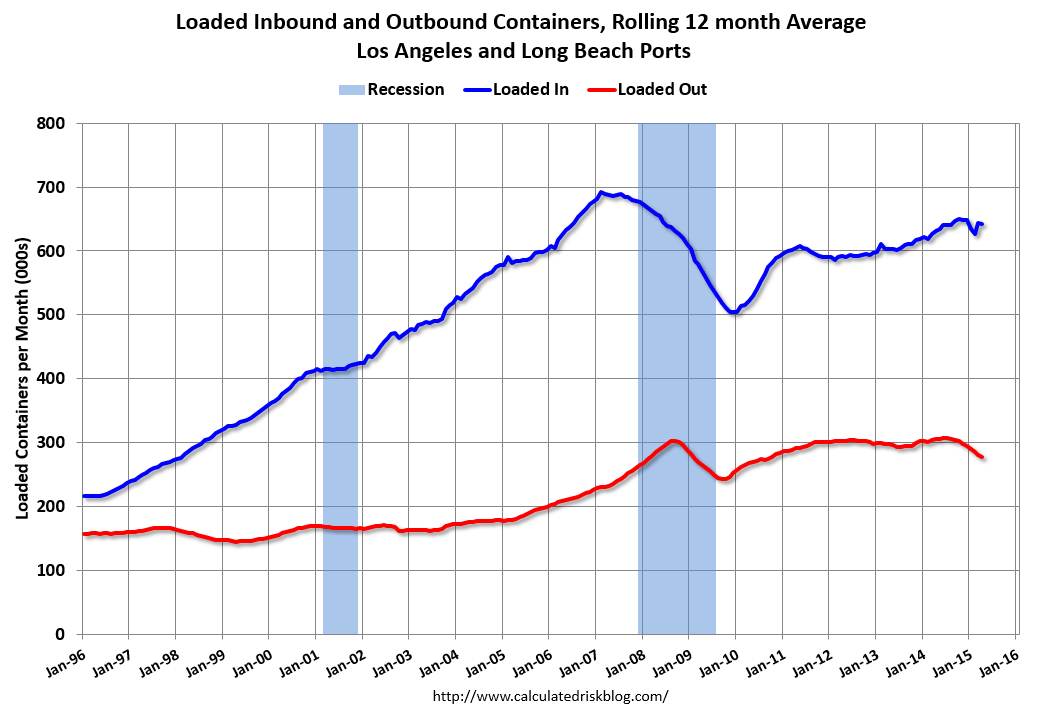
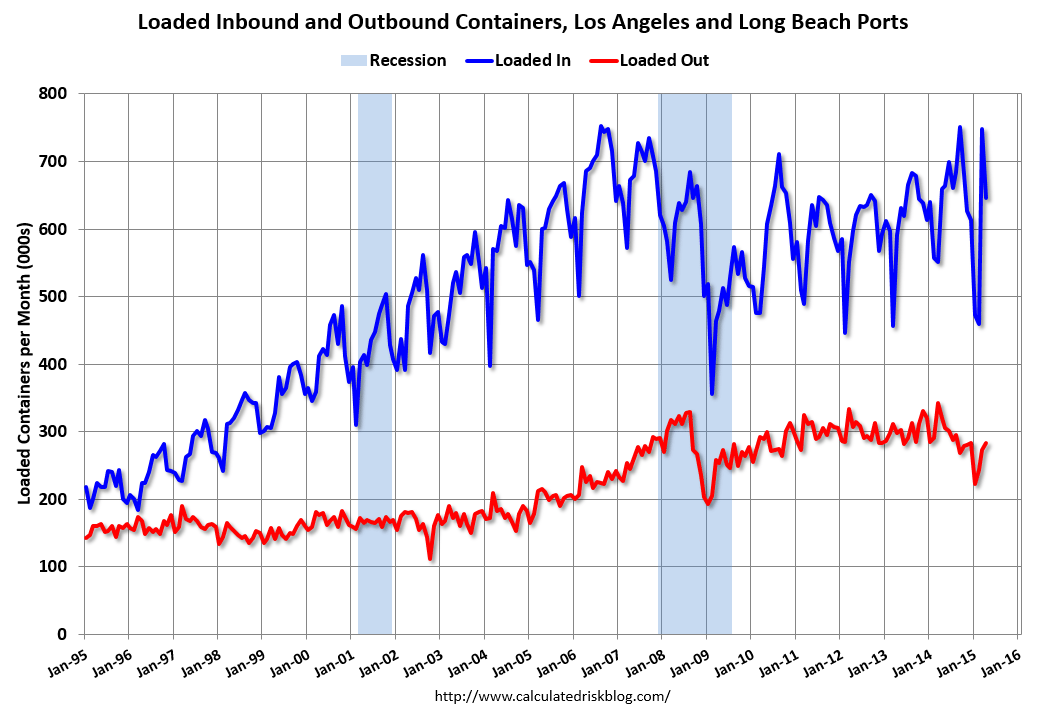
Looks like our trade deficit is still on the rise:

“Exports to the United States rose 21.4 percent in the year to April, keeping the pace of gains in the previous month with brisk shipments of cars and vehicle engines.”

Chart not looking so good:

United States : Durable Goods Orders
er-5-26-1
er-5-26-2

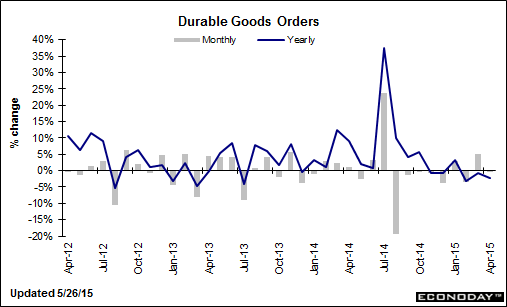
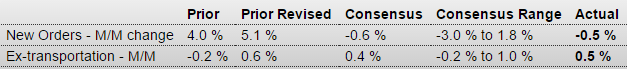
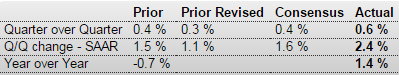
Up a bit after a dip in March but not much different from the Q1 average so hard to say Q2 is doing better than Q1 from this report:

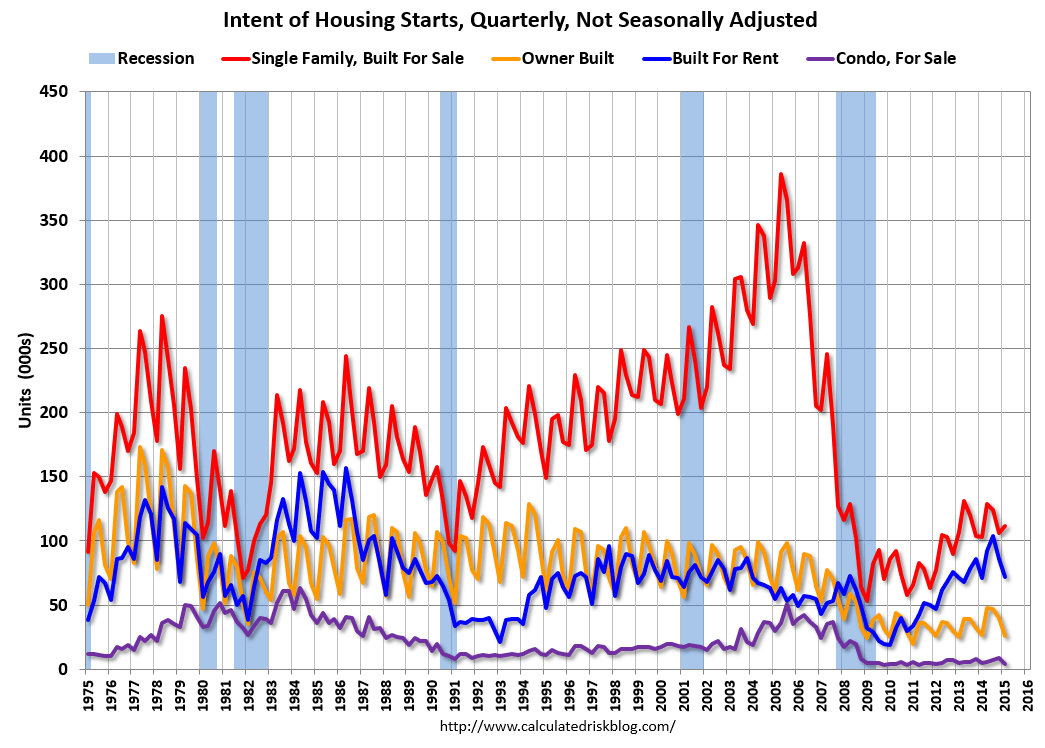
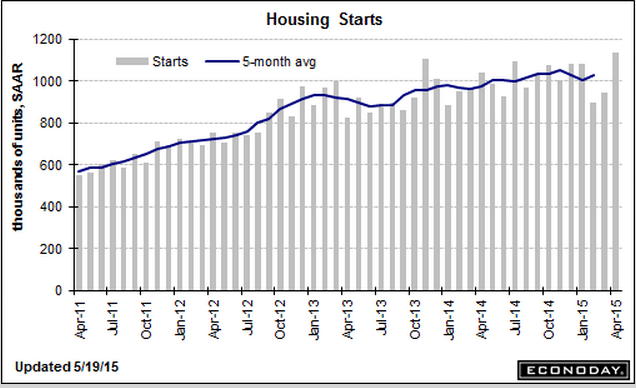
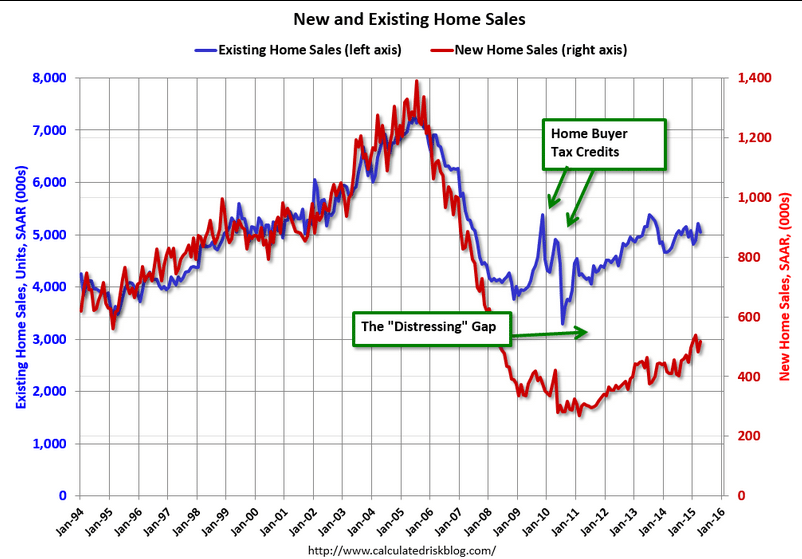
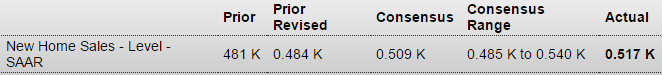
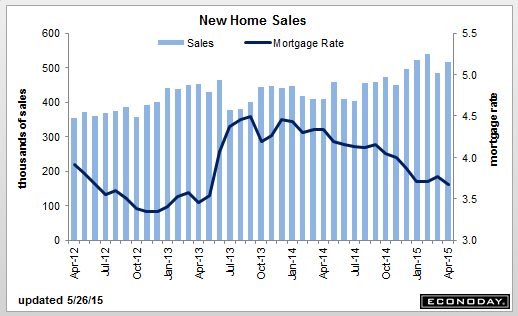
United States : New Home Sales
er-5-26-3
Highlights
New home sales bounced back solidly in April, up 6.8 percent to a 517,000 annual rate that is on the high side of Econoday expectations. Strength is centered in the South which is the largest and important housing region and where sales rose 5.8 percent, this however fails to reverse the region’s 11.8 percent drop in the prior month.

Supply rose slightly in the month, to 205,000 new homes on the market, but supply relative to sales fell to 4.8 months from 5.1 month. Low supply should encourage builders to bring more homes on the market but at the same time low supply hurts current sales. Price readings are mostly favorable led by a 4.1 percent rise in the median price to $297,300 for a strong 8.3 percent year-on-year gain.

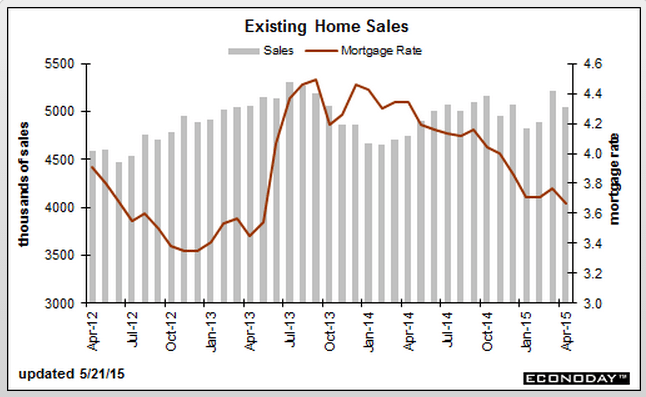
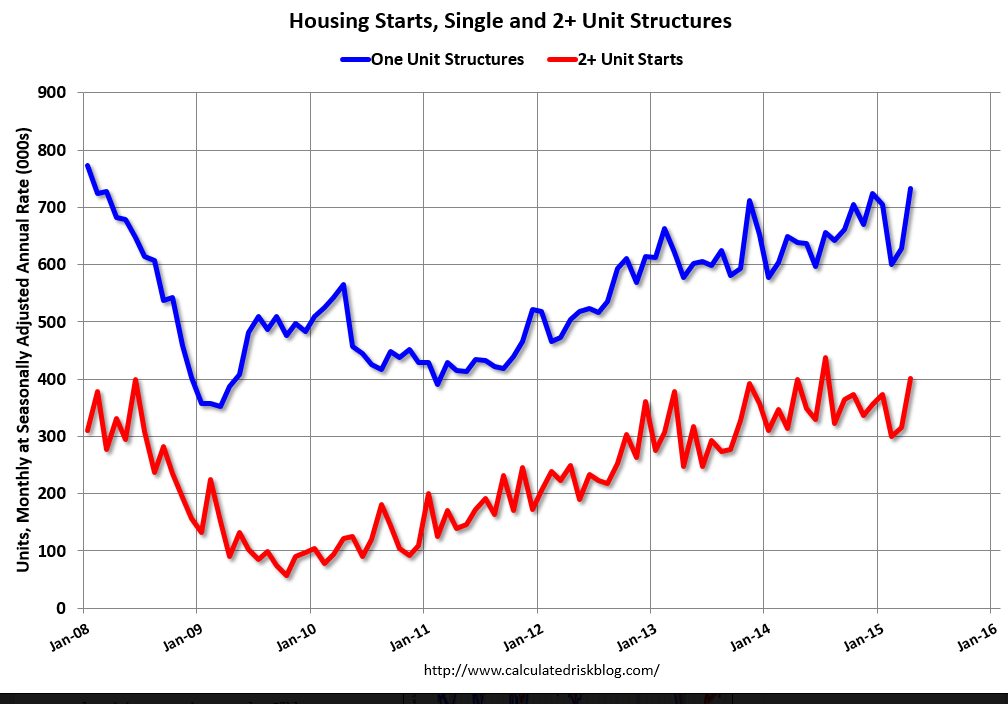
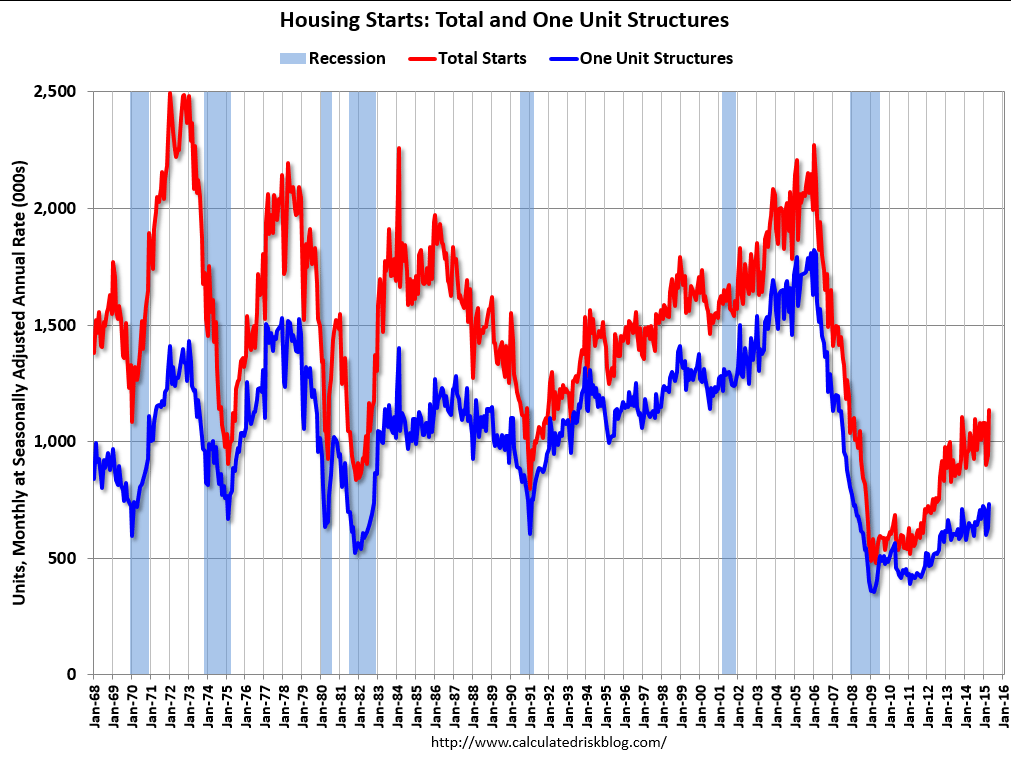
Readings in this report are always volatile month-to-month but the gains for April underscore the recent surge in housing starts & permits and help offset last week’s disappointing weakness in existing home sales. The housing sector is still trying to get off the ground but indications, taken together, are improving.
er-5-26-4
er-5-26-5

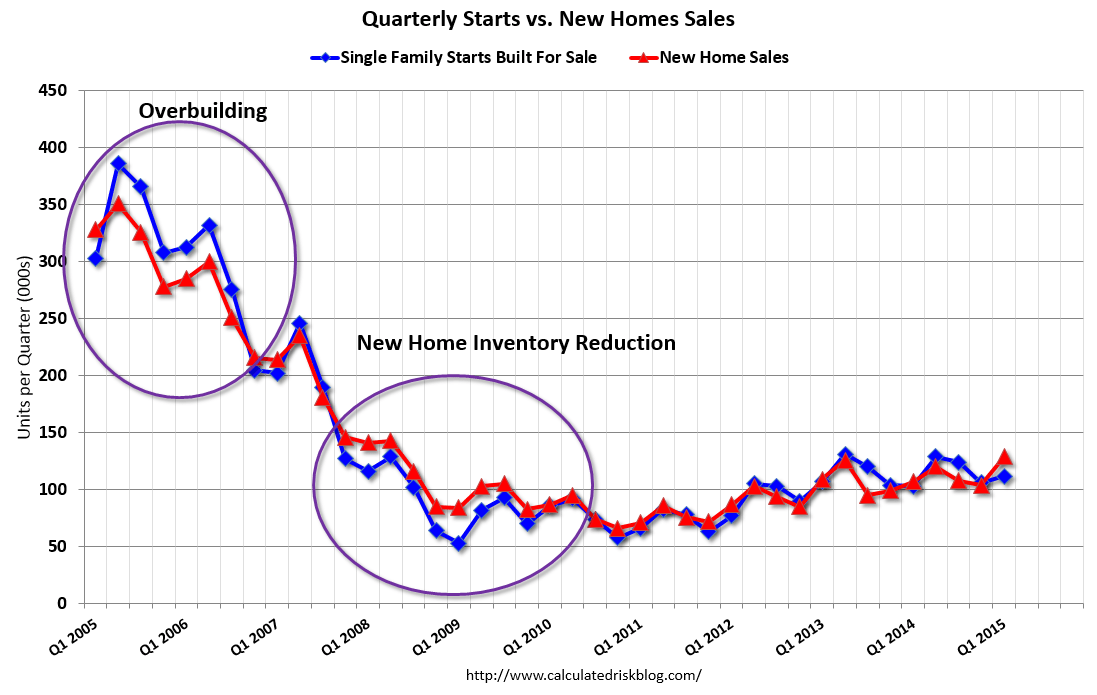
Again, doesn’t look like Q2 is doing any better than Q1 here either:

er-5-26-6

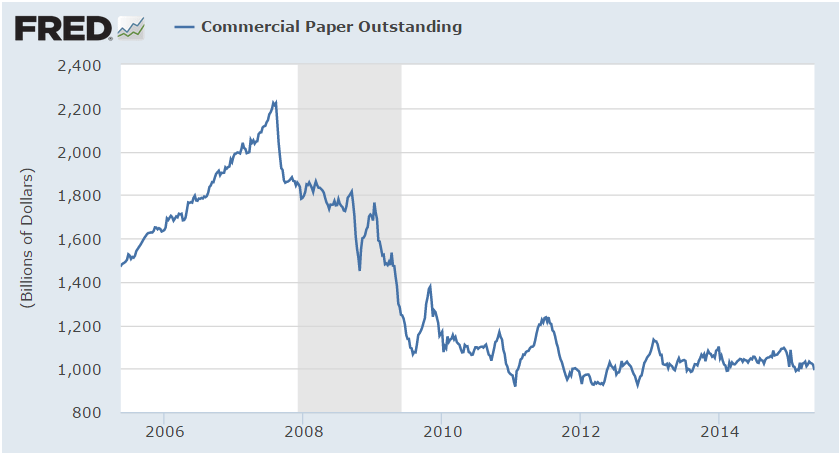
This is notable as my narrative is about the end of the energy capex that was chasing $100 oil that had been keeping total US GDP positive in 2014. This key indicator of that energy investment is showing the deep cuts have not stabilized but are continuing to take their toll, and the drop in total spending and income necessarily ripples out to the rest of the US and global economies. And note the continuing reports of weakness in exports, as the foreign sector drop in oil capex reduces their ability to import:

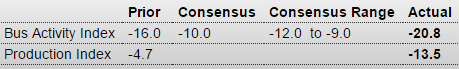
United States : Dallas Fed Mfg Survey
er-5-26-7

Highlights
Contraction in the energy sector continues to pull the Dallas Fed report into deeply negative ground, to a headline minus 20.8 vs minus 16.0 and minus 17.4 in the prior two months. Production shows a turn for the worse, at minus 13.5 vs April’s minus 4.7, as does employment, at minus 8.2 vs plus 1.8. New orders remain deeply negative, at minus 14.1 vs minus 14.0. Prices paid also fell further though the decline is easing, to minus 1.7 from minus 11.2.

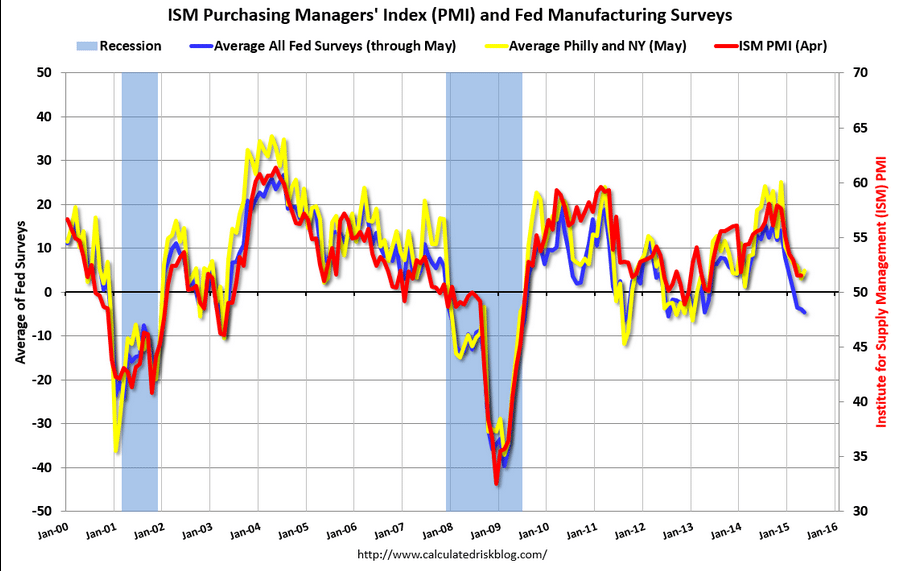
The regional Fed reports all point to another slow month for the manufacturing sector which is struggling with energy contraction, especially evident in this report, as well as weakness in exports.

Dallas Fed: Texas Manufacturing Activity Contracts Further

Texas factory activity declined again in May, according to business executives responding to the Texas Manufacturing Outlook Survey. … The general business activity index fell to -20.8 in May, its lowest reading since June 2009.

Labor market indicators reflected employment declines and shorter workweeks. The May employment index declined 10 points to -8.2, after rebounding slightly above zero last month. Twelve percent of firms reported net hiring, compared with 21 percent reporting net layoffs. The hours worked index fell from -5 to -11.6.

United States : Richmond Fed Manufacturing Index
er-5-26-8
Highlights
Regional Fed reports on the manufacturing sector continue to be soft with Richmond’s at only plus 1 for May following two prior months of declines. New orders, after three straight declines, did rise but only to plus 2. Backlog orders, however, remain deep in the negative column at minus 10.

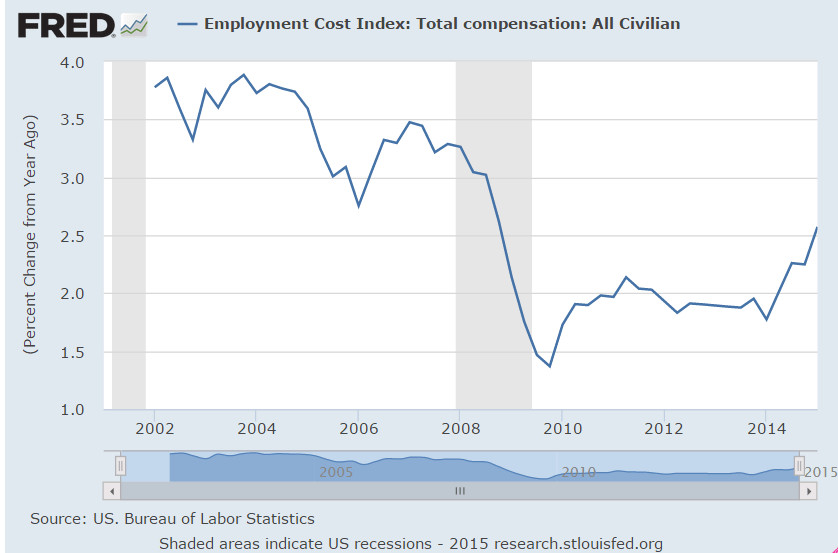
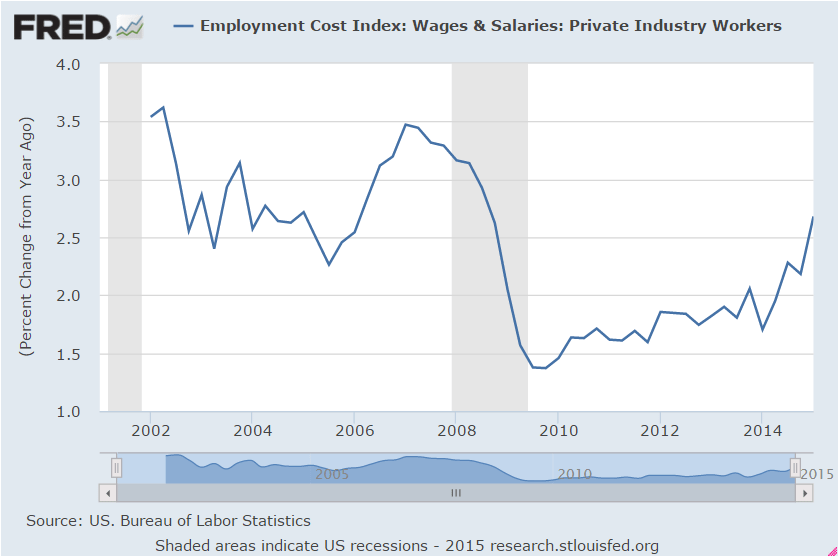
Employment growth is down while shipments are in contraction for a 4th month. Price readings are flat except for wages which show a big 11-point gain to 20. Wage pressures are a trigger for an FOMC rate hike and this reading, though isolated, will get the attention of the hawks at the Fed.

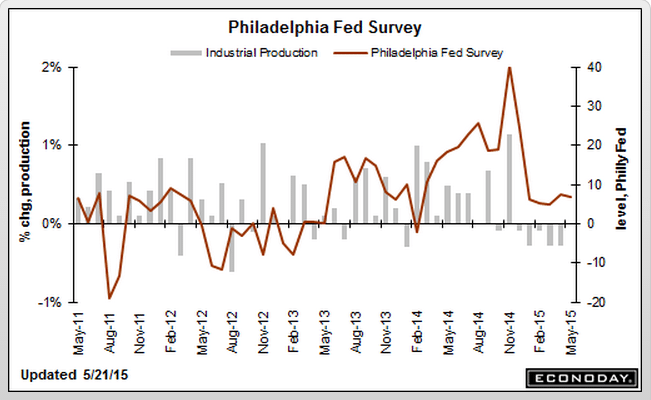
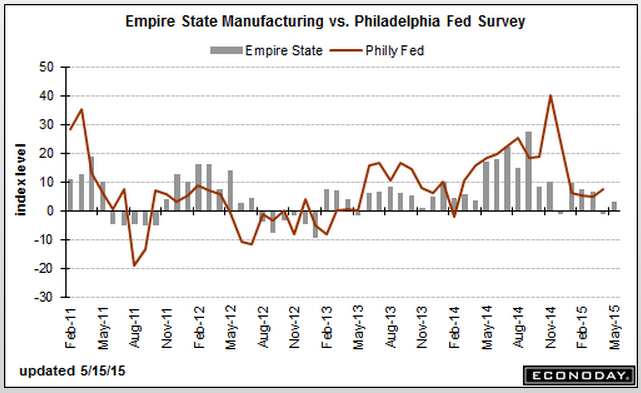
First it was Empire State, then the Philly Fed, then Kansas City, all showing weakness this month and now including Richmond. Data from the Dallas Fed, also released this morning, is especially weak. The manufacturing sector is having a tough time gaining momentum, held down by weak exports and contraction in the energy sector.

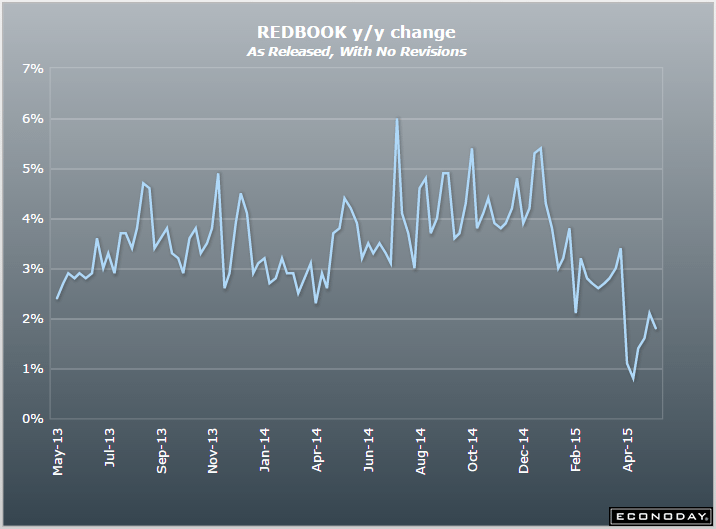
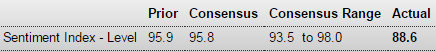
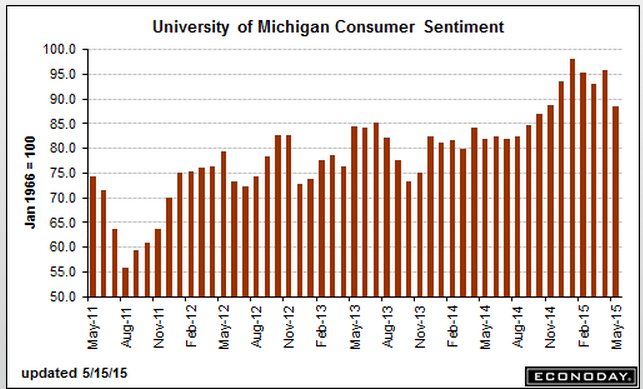
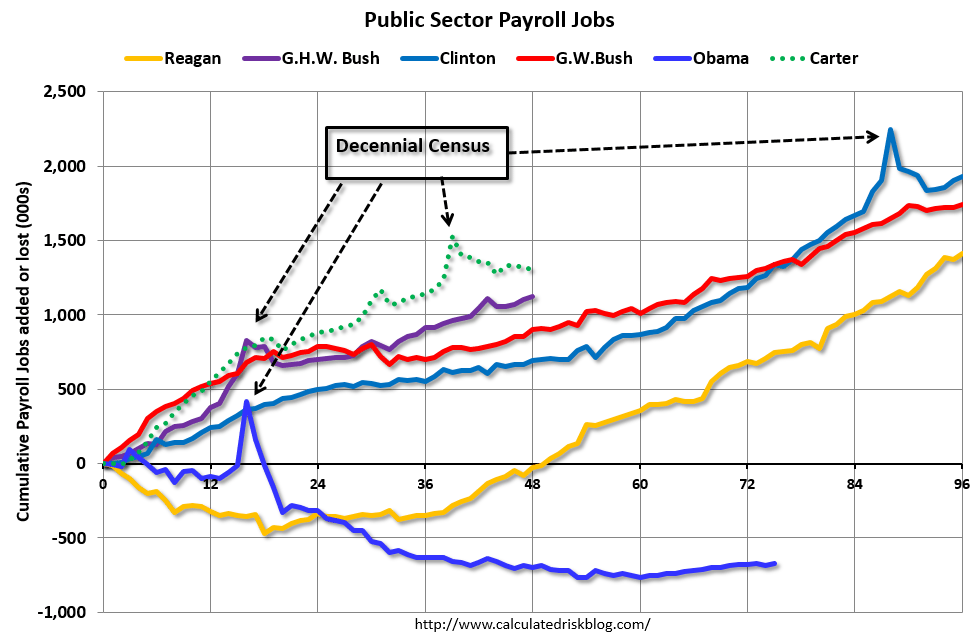
This is one man one vote, not one dollar one vote, and is another indicator where Q2 isn’t doing as well as Q1:
er-5-26-9

CPI

Today’s markets reacted entirely to the .3 increase in core CPI which was actually 0.26 which rounded to 0.3. This, for example, caused the dollar to gap up for the day vs the euro, as traders and portfolio managers acted on the beliefs that it made a Fed hike more likely to come earlier, and that higher rates would fundamentally support the dollar.

However, fundamentally, inflation is in fact a redefinition of a currency downward, as the same number of $ buy less. Likewise, higher domestic costs are a force that reduces exports and higher domestic incomes increases imports, both contributing to trade flows that weaken the currency in line with the loss of value due to inflation. And with floating exchange rates, changes in rates alter the difference between spot and forward price, but not the ‘general level’ of the currency. But no matter, in the near term technicals rule over potential longer term changes to trade flows and the dollar went up.
er-5-23-1

Consumer Price Index
er-5-23-2
Highlights
Pull forward that rate hike is what some of the hawks are thinking after reading today’s consumer price report where a benign looking headline, up only 0.1 percent in April, masks rising pressure through many components.

Excluding food and energy, core prices rose 0.3 percent which doesn’t seem that much but is outside Econoday’s high-end forecast for 0.2 percent. It is also the highest since January 2013. The year-on-year rate for the core is plus 1.8 percent which, after dipping to 1.6 percent earlier in the year, is closing in on the Fed’s general inflation target of 2.0 percent.

Readings showing pressure are outside energy including medical costs (up a very steep 0.7 percent in the month) and education costs (up 0.5 percent). Shelter costs, reflecting rising rents, came in at plus 0.3 percent for the 3rd time in 4 months which is the hottest streak for this reading since way back in late 2006 and early 2007. Also standing out are gains in furniture (up 1.3 percent) and used cars (up 0.6 percent).

Oil prices have been on the rise but not energy costs, at least in the April report which fell a heavy 1.3 percent. Gasoline fell 1.7 percent in the month. Two other readings also showed downward pressure: airfares (minus 1.3 percent) and apparel (minus 0.3 percent). Food costs were flat.

The headline CPI is down 0.2 percent year-on-year which looks downright deflationary. But the lack of pressure is due entirely to energy which is down a very deflationary 19.4 percent year-on-year. Energy prices are bound to firm given the recent move in oil from the high $40s for WTI to $60. That and emerging price pressures through the bulk of the consumer economy raise the risk that inflation may be brewing after all.
er-5-23-3

seasonal adjustments, export reports, Atlanta Fed, Chicago Fed, PMI manufacturing, Philadelphia Fed Survey, Existing home sales, KC Fed

Note that if/when the adjustments are changed it looks like they make Q4 and Q1 a bit higher and Q2 and Q3 a bit lower. The net adjustments are 0 for the year.

Nicole Mayerhauser, chief of BEA’s national income and wealth division, which oversees the GDP report, said in the statement that the agency has identified several sources of trouble in the data, including federal defense service spending. Mayerhauser said initial research has shown this category of spending to be generally lower in the first and the fourth quarters. The BEA will also be adjusting “certain inventory investment series” that have not previously been seasonally adjusted. In addition, the agency will provide more intensive seasonal adjustment quarterly service spending data.

My narrative goes something like this: The CB euro selling drives the price down to the point where the euro zone net exports increase sufficiently to absorb the cb selling, at which point the euro reverses as the trade flows overwhelm the selling from those portfolios and the euro then continues to rise until the current account surplus goes away:

Job creation at four-year high despite slower pace of economic growth

May 21 (Markit) — Eurozone PMI Composite Output Index at 53.4 (53.9 in April), Services PMI Activity Index at 53.3 (54.1 in April), Manufacturing PMI at 52.3 (52.0 in April), and Manufacturing PMI Output Index at 53.5 (53.4 in April). Faster growth in manufacturing was offset by a slowdown in services, though the pace in the latter merely eased slightly further from March’s eight-month high to suggest a broad-based upturn remains in place. Weaker order book growth was centred on the service sector, with manufacturing reporting the strongest inflows of new orders for just over a year, linked to improved export performance.


PMI data signals further slowing of private sector output growth

May 21 (Markit) — PMI data signals further slowing of private sector output growth () Germany Composite Output Index at 52.8 (54.1 in April), Services Activity Index at 52.9 (54.0 in April), Manufacturing PMI at 51.4 (52.1 in April), and Manufacturing Output Index at 52.7 (54.3 in April). Mirroring the trend for output, German private sector companies also signalled a weaker rise in new business. While a pick-up in construction activity and rising domestic demand were reasons behind the overall increase, some survey participants linked the slowing in the rate of growth to economic uncertainties. Meanwhile, manufacturers reported a fourth successive monthly rise in new export orders.

Recent data leaves their forecast unchanged:
er-5-22-1
Negative and looking weak:
er-5-22-3
Weaker here too:

PMI Manufacturing Index Flash
er-5-22-4

Highlights
Markit’s US manufacturing sample had been far stronger than other readings on the sputtering sector but is a little less so with the May report where the index slipped slightly to a 16-month low of 53.8, 8 tenths below the Econoday consensus.

Slowing growth in new orders, including weakness in export orders tied directly to strength in the dollar, held down the May index. Another area of weakness remains the energy sector where business spending is down. Shipment growth slowed to its slowest rate so far this year.

Strength in the report is centered in employment, but this won’t last if orders continue to slow. Deliveries continue to be delayed in part by persistent bottlenecks tied to the long since resolved port strike. Costs are up but inflation remains marginal.

The manufacturing sector is having a tough spring following six prior months of slowing. Watch for the Philly Fed report coming up this morning at 10:00 a.m. ET.

Less than expected and weak:
er-5-22-5
Less than expected and weak:

Existing Home Sales
er-5-22-6

Highlights
Existing homes sales are not living up to springtime expectations, down 3.3 percent in April to a 5.04 million annual rate which is just below the low-end Econoday forecast. Three of 4 regions show contraction in April with the sharpest decline, minus 6.8 percent, in the South, which is by far the largest housing region. Year-on-year, total sales are still up a respectable 6.1 percent.

Another positive is a rise in supply with 2.21 million used homes on the market vs 2.01 million in March. This rise, together with the drop in sales, raises supply relative to sales to 5.3 months from 4.6 months. And another positive is a 4.1 percent rise in the median price to $219,400 which is up 8.9 percent year-on-year.

But this report in sum is a disappointment, failing to point to any building momentum. Strength in the housing sector may be switching, from existing home sales to new home sales at least based on this report compared to the historic surge earlier this week in housing starts & permits. But housing data month-to-month are always volatile and, on net, it’s too soon to decipher how strong the spring housing season is right now.
er-5-22-7
er-5-22-8

And one last negative for today:

Kansas City Fed Manufacturing Index
er-5-22-111
Highlights
The early indications on May’s manufacturing activity have been slightly positive, that is until the Kansas City Fed report where the composite index is in deeply negative ground at minus 13. This is the weakest of the recovery for this reading and follows an already weak minus 7 in April.

New orders this month are deeply negative, at minus 19, as are backlog orders at minus 21. These readings, reflecting contraction for export orders and trouble in the energy sector, point to significant trouble for the region’s manufacturing activity in the months ahead.

Shipments are already in contraction, at minus 9, as is employment, at a deeply negative minus 17 that contrasts with mostly positive employment indications in other reports.

IMF re France, truck tonnage, China PMI, Japan PMI

More of same pro cyclical pressure:

France slammed by IMF for record-high spending

By Holly Ellyatt

May 20 (CNBC) — The International Monetary Fund (IMF) has warned France that it must reduce government spending and debt levels, as well as tackling its sticky unemployment rate.

The IMF said in its latest economic outlook on France, published on Tuesday, that although it sees a “solid short-term recovery (in France), structural rigidities continue to weigh on medium-term prospects.”

“Continued efforts are needed to tackle France’s fundamental economic problems: high structural unemployment, low potential growth, and record-high public spending,” the group added.

Indeed, the IMF noted that high and rising government spending has been “at the heart” of France’s fiscal problems for decades.

Trucking Tonnage Index Slumps in April 2015. Lowest Level In One Year.

Econintersect: The American Trucking Associations’ (ATA) trucking index declined 3% following an downwardly revised improvement of 0.4% in March. From ATA Chief Economist Bob Costello:

Still headed south. Maybe just a few more rate cuts…

New export orders declined means exporters putting more pressure on the govt to buy its euro back…

:(

China : PMI Flash Mfg Index
er-5-21-1
Highlights
May’s flash manufacturing PMI remained mired in contraction with a reading of 49.1 which was an improvement over April’s reading of 48.9. The output index which was at the breakeven point between growth and contraction in April, skidded to a reading of 48.4. New orders decreased at a slower rate while new export orders declined after increasing in April. Five sub-indexes decreased but at a slower rate. These included employment, output and input prices, backlogs of work and stocks of purchases.

A bit of hope here as weak currency/lower relative wages drives a few export orders:

Japan : PMI Manufacturing Index Flash
er-5-22-2
Highlights
Japanese manufacturing returned to growth in May with its best performance since February. Japan’s flash May manufacturing PMI reading was 50.9, up a full point from the April final of 49.9. A reading above 50 signifies growth. The flash output index climbed to 51.7 from 49.3 in April. Along with these readings, new orders increased, changing direction. Both export orders and employment increased at a faster pace in May. However, backlogs decreased at a faster rate. Both the stocks of purchases and finished goods changed direction and decreased. The readings, if confirmed when the final PMI is released for May is a favorable sign that points to stabilization in the economy.

Japan Q1 GDP, Sea Containers, home building charts

Looks like mainly inventory building:

Japan : GDP
er-5-20-1
Highlights
The Japanese economy appears to be recovering with its second consecutive quarter of growth. First quarter gross domestic product was up 0.6 percent on the quarter – consensus was for a 0.4 percent quarterly gain. On an annualized basis, GDP was up 2.4 percent. However, GDP was down 1.4 percent when compared with the same quarter a year ago. Fourth quarter GDP was revised down to a gain of 0.3 percent on the quarter or an annualized pace of 1.1 percent.

Among the components, domestic demand contributed 0.8 percentage point while net exports subtracted 0.2 percentage point. CAPEX contributed 0.1 percent while inventories added 0.5 percentage point. Private consumption was up 0.4 percent on the quarter as was CAPEX. Government consumption was up 0.1 percent.

From CNBC:

Economists have been watching Japan’s economic data closely for signs Abenomics, or Japanese Prime Minister Shinzo Abe’s plan to kick-start the long-moribund economy out of its decades-long struggle against deflation, has made any progress.

Some are unconvinced that the GDP data will herald a sustained recovery.

“The acceleration in GDP growth last quarter was mostly due to a jump in inventories, and a range of indicators point to a slowdown in the second quarter,” Marcel Thieliant, a Japan economist at Capital Economics, said in a note Wednesday. He expects Japan’s GDP growth will be around zero for the year, adding that the data suggest that the near-term chances of further easing from the Bank of Japan have diminished.

And not everyone is convinced domestic demand is making a comeback. In a note, DBS says private consumption on an annualized basis, while up 1.4 percent, grew at a similar rate as in the third and fourth quarters of 2014

“The cumulative growth in consumption in the past three quarters has remained far from enough to offset the contraction in early-2014 caused by the sales tax hike. This means that consumer spending remained far weaker than the normal levels prior to the tax hike,” DBS said.

“Admittedly, the pace of consumption recovery has remained very slow so far and whether it could pick up and match expectations in the coming quarters will remain to be seen,” the note added.

April 2015 Sea Container Counts Continue to Demonstrate Weak Conditions in the USA and Globally

By Steven Hansen

The data for this series continues to be weak. Not only is year-to-date volumes contracting for both imports and exports – but both April exports and imports are contracting month-over-month and year-over-year. This continues to indicate weak economic conditions domestically and globally.

And note how depressed sales and starts remain:
er-5-20-2

er-5-20-3

United States : MBA Mortgage Applications

er-5-20-4

Highlights
The ongoing run up in mortgage rates may be easing demand for mortgage applications just at the time that demand for purchase applications had been gaining steam. Purchase applications fell 4.0 percent in the May 15 week though, year-on-year, applications are still up a very strong 11.0 percent. Refinancing applications slipped 0.3 percent in the week. The average 30-year mortgage for conforming loan balances ($417,000 or less) rose to its highest level of the year, up 5 basis points to 4.04 percent. Watch for existing home sales on tomorrow’s calendar.

Down big:
er-5-20-5

The Fed’s concerned about the employment cost index?

Not even up to the growth rate lows of the last cycle:

er-5-20-6
Just got through prior growth rate lows after years of being much lower:
er-5-20-7

Atlanta Fed, LA port traffic, EU trade surplus, German ZEW, housing starts, redbook retail sales

No positive change here yet:
er-5-19-1

This was supposed to rebound:

LA area Port Traffic Decreased in April

By Bill McBride

May 18 (Calculated Risk) — Note: LA area ports were impacted by labor negotiations that were settled on February 21st. Port traffic surged in March as the waiting ships were unloaded (the trade deficit increased in March too), and port traffic declined in April.

Container traffic gives us an idea about the volume of goods being exported and imported – and usually some hints about the trade report since LA area ports handle about 40% of the nation’s container port traffic.

The following graphs are for inbound and outbound traffic at the ports of Los Angeles and Long Beach in TEUs (TEUs: 20-foot equivalent units or 20-foot-long cargo container).

To remove the strong seasonal component for inbound traffic, the first graph shows the rolling 12 month average.

On a rolling 12 month basis, inbound traffic was down 0.2% compared to the rolling 12 months ending in March. Outbound traffic was down 1.1% compared to 12 months ending in March.

Inbound traffic had been increasing, and outbound traffic had been moving down recently. The recent downturn in exports might be due to the strong dollar and weakness in China.

The 2nd graph is the monthly data (with a strong seasonal pattern for imports).

LA Area Port TrafficUsually imports peak in the July to October period as retailers import goods for the Christmas holiday, and then decline sharply and bottom in February or March (depending on the timing of the Chinese New Year).

Imports were down 2% year-over-year in April; exports were down 11% year-over-year.

The labor issues are now resolved – the ships have disappeared from the outer harbor – and the distortions from the labor issues are behind us. This data suggests a smaller trade deficit in April.
er-5-19-2
er-5-19-3

Strong number.

Currencies with trade surplus don’t ordinarily go down…
;)

European Union : Merchandise Trade
er-5-19-4

A bit on the weak side, to say the least, and even with negative rates and QE…
;)

Germany : ZEW Survey
er-5-19-5

Solid improvement here. First good number in quite a while.
The 5 month average is almost back to where it was in November…

United States : Housing Starts
er-5-19-6
Highlights
There were hardly any indications before today, but the spring housing surge is here. Today’s housing starts & permits report is one of the very strongest on record with starts soaring 20.2 percent in April to a much higher-than-expected annual rate of 1.135 million with permits up 10.1 percent to a much higher-than-expected 1.143 million. Both readings easily top the Econoday high-end forecast of 1.120 million for each. The gain for starts is the best in 7-1/2 years with the gain in permits the best in 7 years. Today’s report is an eye-opener and will re-establish expectations for building strength in housing, a sector held down badly in the first quarter by severe weather.
er-5-19-7
er-5-19-8
er-5-19-9

Half way through May and this one isn’t bouncing back:

United States : Redbook
er-5-19-10
er-5-19-11

home builder’s index

Doesn’t look like Q2 will be any better than Q1:

Housing Market Index

er-5-18-1
Highlights
The housing market index has long been signaling strength in the new home market that has yet to appear, but the signal is less strong in May. The index fell 2 points from April to 54 which is below the low-end Econoday forecast.

The dip reflects a 2-point slowing in present sales, which however remain well above breakeven 50 at 59, and a 1 point slowing for traffic to a very weak 39. Weakness in traffic has been a major feature of this report, underscoring the lack of first-time buyers in the housing sector. A plus in today’s report is a 1 point gain in future sales, a component that is well out in front at a very strong 64.

Regional trends show the South just out in front, at 57 for the 3-month composite average, vs 55 for both the Midwest and West. The Northeast, at 41, always lags far behind in the new home market.

Despite strength in this report, construction and sales of new homes have been holding down the economy. Housing starts & permits for April, to be released tomorrow, are expected to bounce back from a depressed March.
er-5-18-2

Railcar traffic, Draghi statement, NY manufacturing survey, Industrial production, Consumer confidence

Rail Week Ending 09 May 2015: Data Still Not Pretty. Rail Softness Continues.

(Econintersect) — Week 18 of 2015 shows same week total rail traffic (from same week one year ago) declined according to the Association of American Railroads (AAR) traffic data. Intermodal traffic improved, which accounts for half of movements – but weekly railcar counts goes deeper into contraction.

This analysis is looking for clues in the rail data to show the direction of economic activity – and is not necessarily looking for clues of profitability of the railroads. The weekly data is fairly noisy, and the best way to view it is to look at the rolling averages which generally are in a weak growth cycle.

er-5-15-1
er-5-15-2
A summary of the data from the AAR:

The Association of American Railroads (AAR) today reported U.S. rail traffic for the week ending May 9, 2015.

For this week, total U.S. weekly rail traffic was 551,034 carloads and intermodal units, down 2.3 percent compared with the same week last year.

Total carloads for the week ending May 9, 2015 were 273,433 carloads, down 7.9 percent compared with the same week in 2014, while U.S. weekly intermodal volume was 277,601 containers and trailers, up 3.8 percent compared to 2014.

Four of the 10 carload commodity groups posted increases compared with the same week in 2014. They include: motor vehicles and parts, up 8.9 percent to 18,997 carloads; petroleum and petroleum products, up 6.1 percent to 15,464 carloads; and miscellaneous carloads, up 3.6 percent to 9,220 carloads. Commodity groups that saw decreases during this one week included: coal, down 16.1 percent to 93,691 carloads; metallic ores and metals, down 12.1 percent to 23,572 carloads; and grain, down 11.2 percent to 17,959 carloads.

For the first 18 weeks of 2015, U.S. railroads reported cumulative volume of 5,043,559 carloads, down 1.8 percent from the same point last year; and 4,679,513 intermodal units, up 1.7 percent from last year. Total combined U.S. traffic for the first 18 weeks of 2015 was 9,723,072 carloads and intermodal units, a decrease of 0.1 percent compared to last year.

North American rail volume for the week ending May 9, 2015 on 13 reporting U.S., Canadian and Mexican railroads totaled 368,931 carloads, down 7.5 percent compared with the same week last year, and 350,845 intermodal units, up 3.2 percent compared with last year. Total combined weekly rail traffic in North America was 719,776 carloads and intermodal units, down 2.6 percent. North American rail volume for the first 18 weeks of 2015 was 12,681,610 carloads and intermodal units, up 1 percent compared with 2014.

Here we go. This kind of thing previously had caused the euro to fall vs the dollar. If it doesn’t happen this time there’s a serious problem brewing. And right now the euro is up on the day…

Draghi helps stocks

Aside from individual stocks, sentiment received a boost from the ECB on Friday. Draghi said Thursday that the central bank will “implement in full” its bond-buying program and it will stay in place “as long as needed.”

“While we have already seen a substantial effect of our measures on asset prices and economic confidence, what ultimately matters is that we see an equivalent effect on investment, consumption and inflation,” Draghi said, according to the text of a speech delivered in Washington.

“To that effect, we will implement in full our purchase program as announced and, in any case, until we see a sustained adjustment in the path of inflation.”
er-5-15-3
Empire State Mfg Survey
er-5-15-4
Highlights
The first indication on May conditions in the manufacturing sector is soft, as indications have been all year. The Empire State index came in at 3.09, below what were already weak Econoday expectations for 5.00. Shipments look respectable at 14.94 but are way ahead of new orders, at only 3.85, and even further ahead of backlog orders which are in deep contraction at minus 11.46. Employment growth is down as is the 6-month outlook, both pointing to a lack of optimism.

Price readings in this report stand out, pointing to even less pressure than in April with input cost inflation very subdued, down nearly 10 points to 9.38, and with virtually no price traction at all for finished goods, at only 1.04.

The manufacturing sector, hurt in part by weak exports, looks to be more and more of a drag at a time when economic growth is supposed to be on a springtime rebound. Next indication on the May manufacturing sector will be next Thursday with the Philly Fed report. Later this morning the industrial production report will offer the first definitive data on the April manufacturing sector.

er-5-15-5

This is bad too:

Industrial Production
er-5-15-6
Highlights
Industrial production is stalling, down 0.3 percent in April for a 5th straight monthly contraction. Factories are cutting back with capacity utilization down 4 tenths to 78.2 percent. And the manufacturing component, which has been flat to negative all year, is unchanged. All these readings are at or near the Econoday low-side forecasts.

Among manufacturing subcomponents, consumer goods output fell 0.3 percent with business goods down 0.4 percent. Construction supplies rose only fractionally but at 0.1 percent the reading is the best all year (this a reminder of how weak construction and housing has been). A positive is a second strong month for auto output, up 1.3 percent on top of March’s 4.3 percent surge, but whether output increases further will depend on auto sales which, in yesterday’s retail sales report, turned lower in April.

The two other main components in today’s report show even greater weakness with mining, hurt by oil & gas, at minus 0.8 percent for the 6th contraction in 7 months and utilities at minus 1.3 percent for a 2nd straight decline.

The industrial economy remains flat and is holding down what is supposed to be the economy’s springtime bounce. The news from the factory sector, including this morning’s Empire State report, won’t be pulling forward expectations for the Fed’s first rate hike.
er-5-15-7

Even this has suddenly broken:

Consumer Sentiment
er-5-15-8
Highlights
Consumer confidence had been holding, as the FOMC assured us just a couple of weeks ago, at high levels, but perhaps less so now with the consumer sentiment index at 88.6 which is nearly 5 points below Econoday’s low-side forecast. Both components show weakness with current conditions down 7.2 points to 99.8 and expectations down 7.3 points to 81.5. These are the lowest readings since October and November of last year.

At the same time that confidence is going down, inflation expectations, reflecting rising gasoline prices, are going up. Expectations 1-year out are up 3 tenths to 2.9 percent while expectations 5-years out are up 2 tenths to 2.8 percent. Despite the turn higher, however, these are still low levels.

The drop in current conditions hints at softness in this month’s jobs market while the drop in expectations is a downgrade for the outlook on jobs. The hawks at the Fed have been anticipating, perhaps over anticipating, that strong consumer confidence levels would eventually translate to gains for retail sales. Retail sales have been flat along and now consumer confidence, based at least on today’s consumer sentiment report, is moving backwards.
er-5-15-9
Of the nearly 1.6 million loan originations in Q1, 471,822 were purchase loan originations, down 25% from the prior quarter and up less than 1% from a year ago. There were 1,080,043 refinance originations in Q1, an increase of 6% from the prior quarter and 27% from a year ago.

claims, producer prices, euro comments, public sector jobs

Just a reminder, claims measure those losing jobs who file for benefits, not new hires:

Jobless Claims
er-5-14-1
er-5-14-2

The euro has been moving higher vs the dollar, as CB selling winds down as they reach the lower limits of their reserve targets along with fundamental support from a large and growing EU current account surplus that’s drained those euro sold by those CB’s and other sellers from global markets. This may have left the short sellers and others needing to recover euro allocations subject to a dramatic short squeeze for as long as the current account surplus continues. And this poses an extreme risk to the EU. Growth forecasts have been largely based on ‘weak euro’ and as it moves higher that growth never materializes, and instead the economy deteriorates/unemployment goes higher, etc. etc. and, making matters worse, the ECB is left ideologically bankrupt, having seen negative rates and QE do nothing more than exacerbate the deflation they were trying to reverse. All they can do is try more of the same, which will be a very depressing environment for those who have been suffering under the failed policies. All of which has the potential to accelerate the already growing support for the various anti euro forces.
sg2015051440308

Yes, President Obama wins the Tea Party trophy for downsizing government:
er-5-14-3