Income and spending and pricing low and lower than expected:
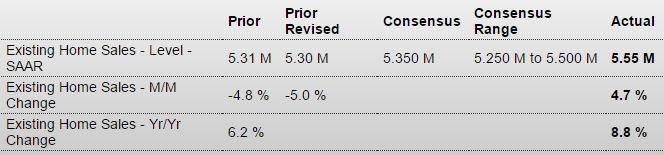
Personal Income and Outlays
Highlights
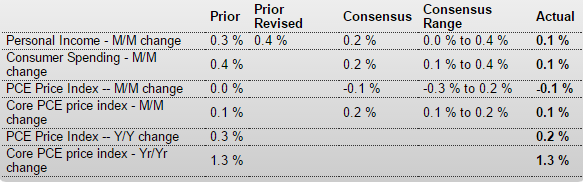
Inflation is not building based on the Fed’s favorite reading, the core PCE price index which inched a lower-than-expected 0.1 percent higher in September with the year-on-year rate steady and flat at only plus 1.3 percent. These results will not lift the odds for a December hike at the next FOMC.
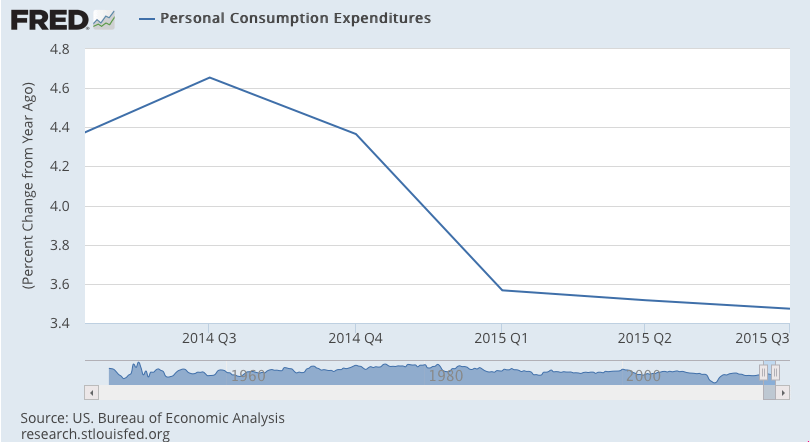
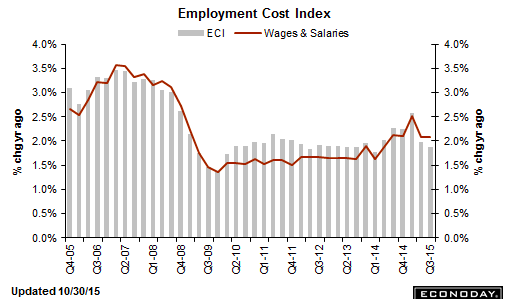
Income and spending data also came in below expectations, at plus 0.1 percent each vs expectations for plus 0.2 percent each. Income got no boost from wages & salaries in September which were unchanged following, however, strong gains of 0.5 percent in the two prior months that underscore this morning’s employment cost index which shows pressure in the third quarter. Spending in September was pulled down by a 1.2 percent plunge in nondurable goods that likely reflects the low price of fuel. Spending on durable goods, driven by vehicles, rose a strong 0.8 percent with spending on services up a solid 0.4 percent.
Other details include a 0.1 percent decline for the total PCE price index, again an effect likely based on fuel. Here the year-on-year rate is barely over zero at plus 0.2 percent. The savings rate continues to edge higher, up 1 tenth to 4.8 percent in a gain that hints at strength for future consumer spending.
Third-quarter consumer activity slowed in September, pointing to lack of momentum for October consumer data. Still, the consumer is in charge in the U.S. economy and, given low unemployment, the outlooks for holiday spending and fourth-quarter acceleration are favorable.
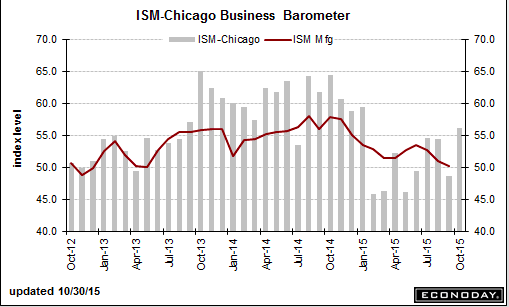
Nice move up here:
Chicago PMI
Highlights
Volatility is not that unusual for the Chicago PMI which surged 7.5 points from September and 6.0 points over consensus to a 56.2 level that points to sudden acceleration and solid growth this month for the whole of the Chicago economy. New orders and especially production are showing strength with both at their best levels of the year. The production reading, in fact, surged nearly 20 points in a reminder of how volatile this series can be.
Inventories are also up sharply, suggesting that Chicago businesses may be ramping up for stronger output going into the holidays. Hiring fell back to neutral following three months of gains and, in another negative, order backlogs are down for an eighth straight month. And for a third straight month, prices are in contraction.
Advance indications on the October economy are mixed with a sweep of regional Fed surveys pointing to another month of contraction for the factory sector but other readings, including this one, mixed to upbeat. Still, the volatility of this report should limit its impact on the month’s outlook.
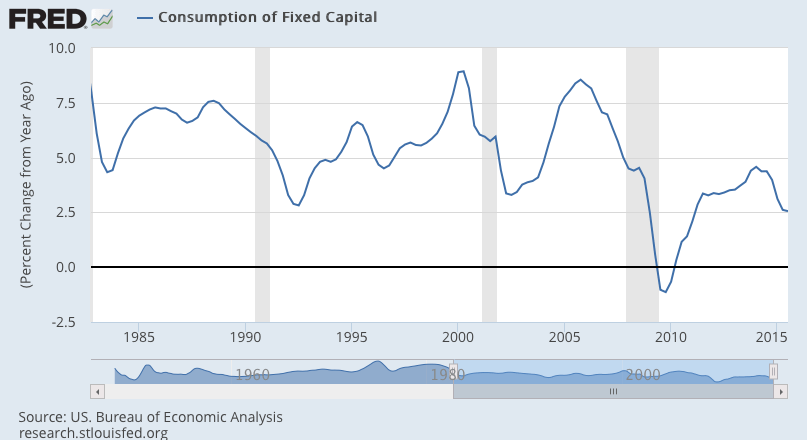
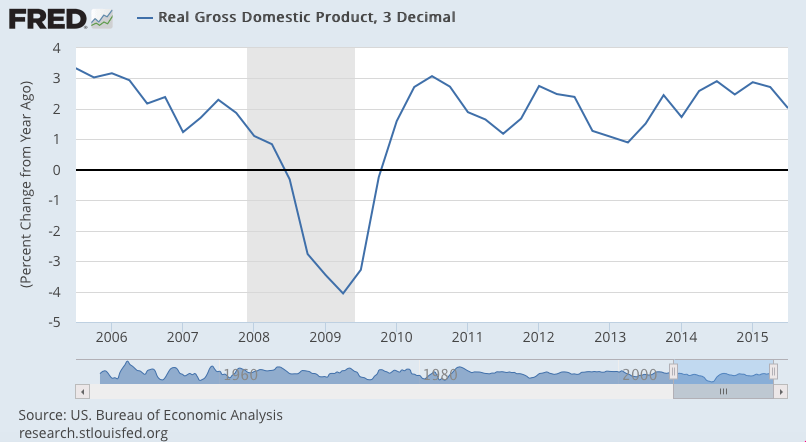
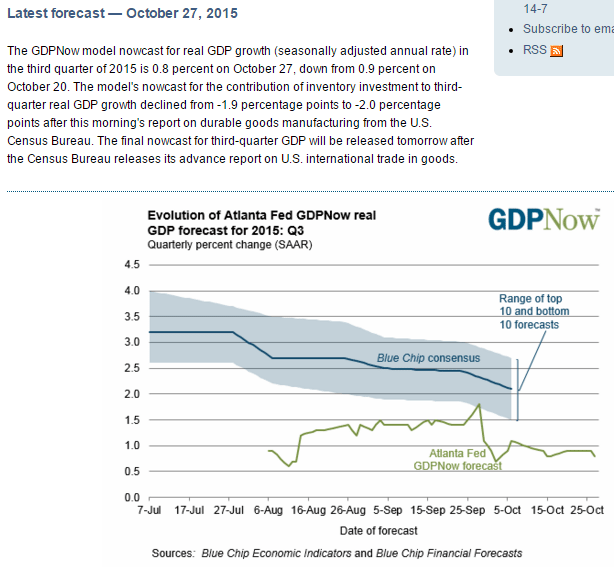
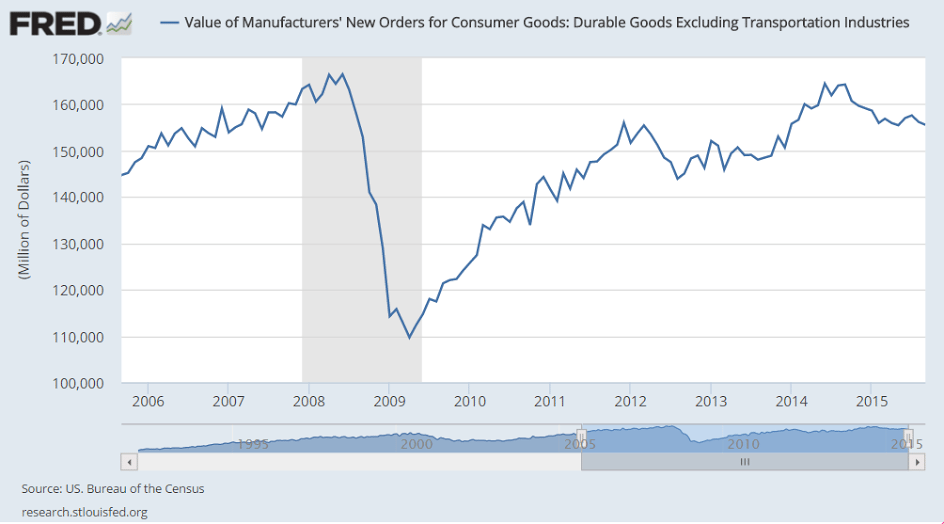
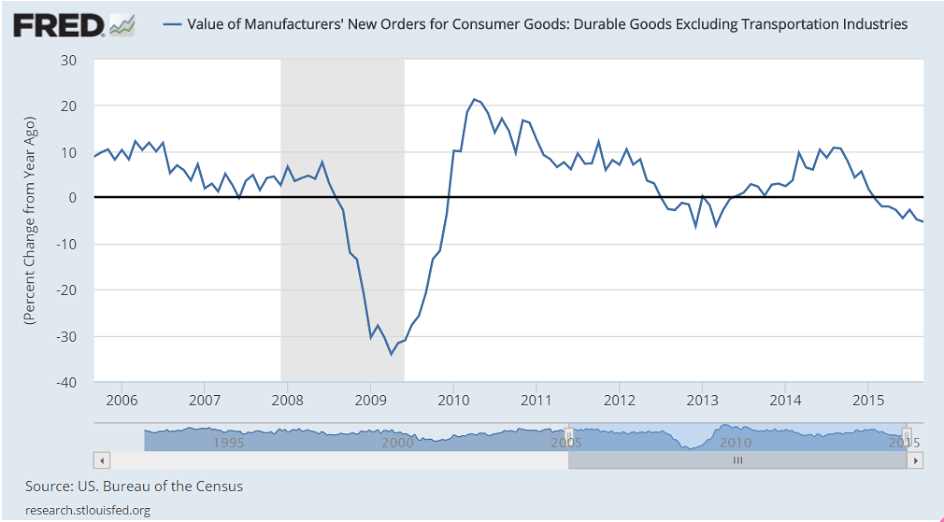
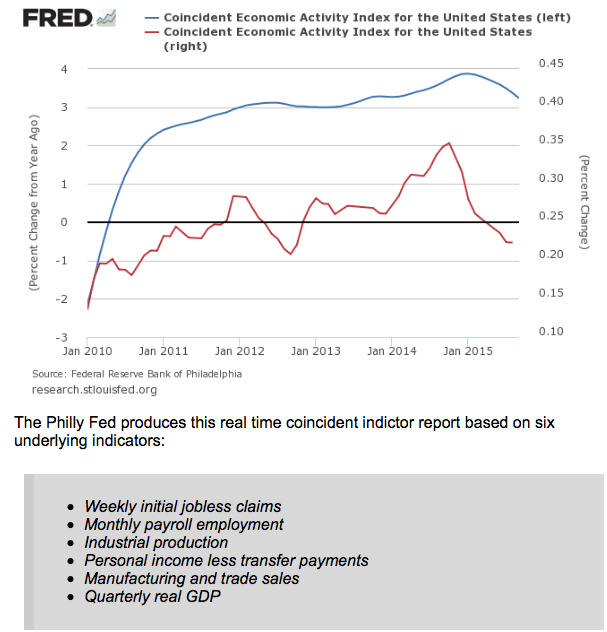
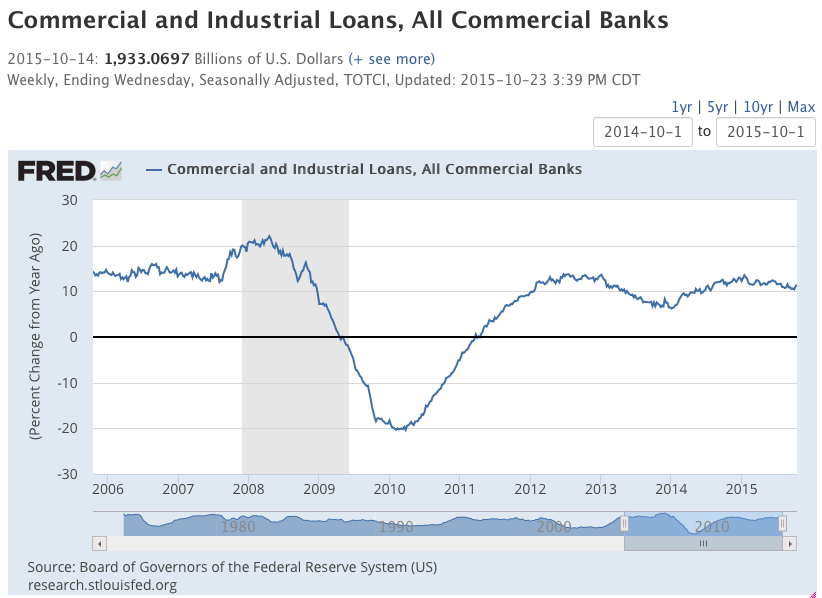
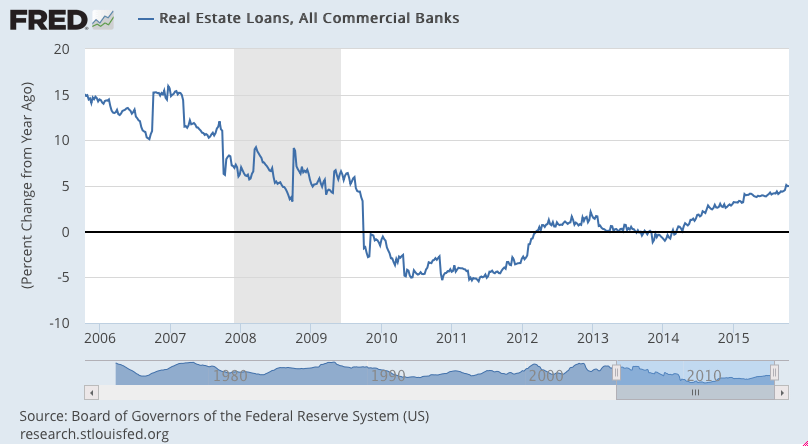
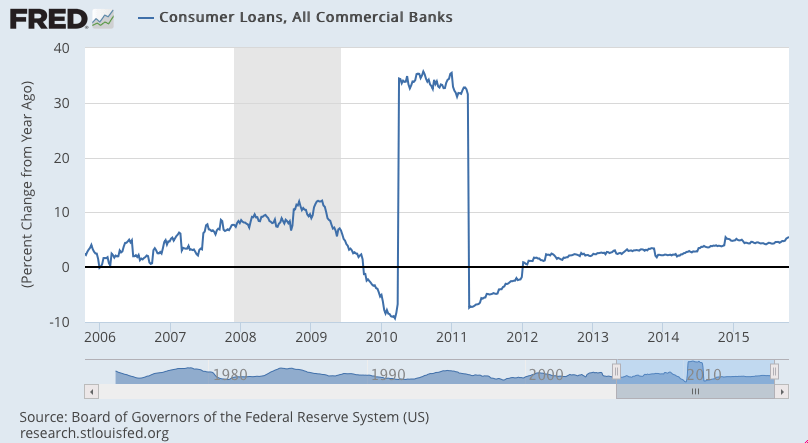
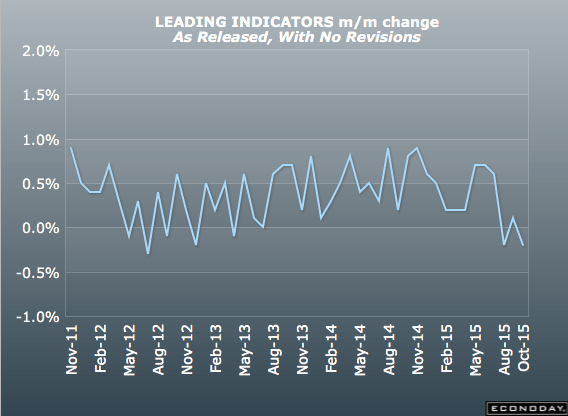
Nothing here to push the Fed:
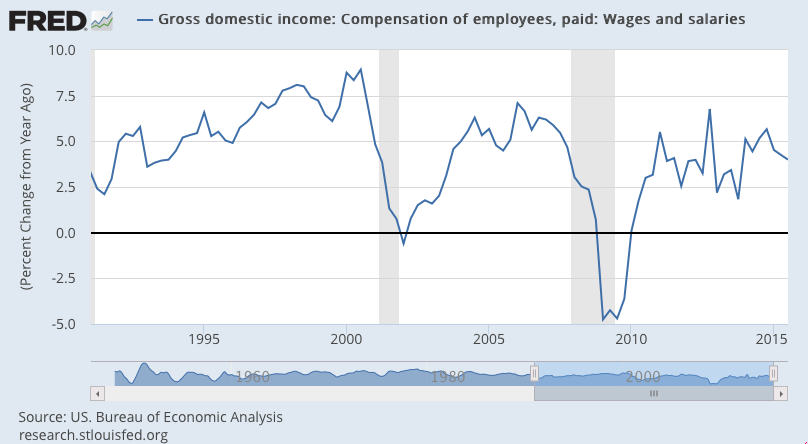
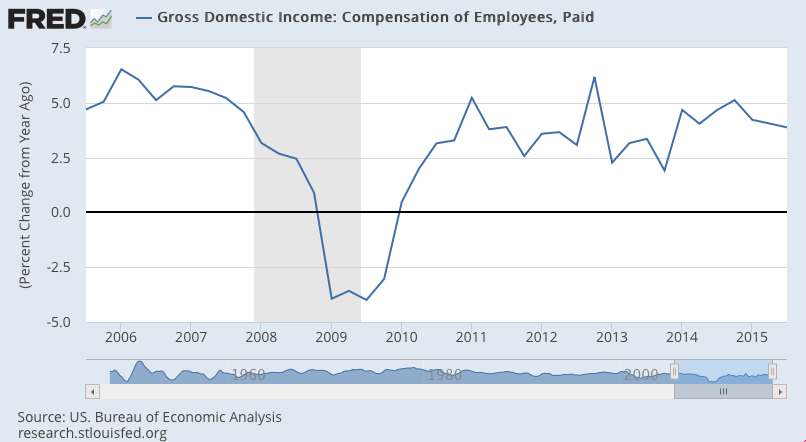
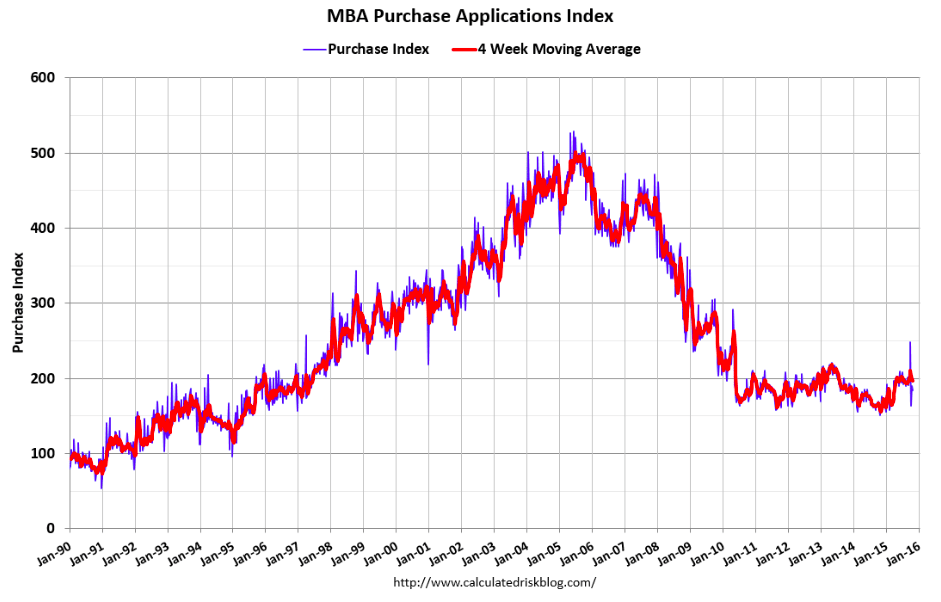
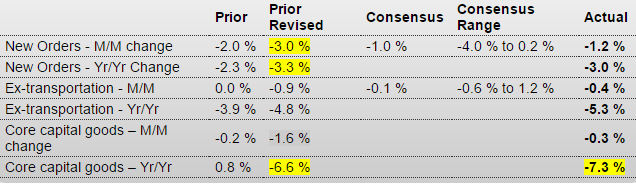
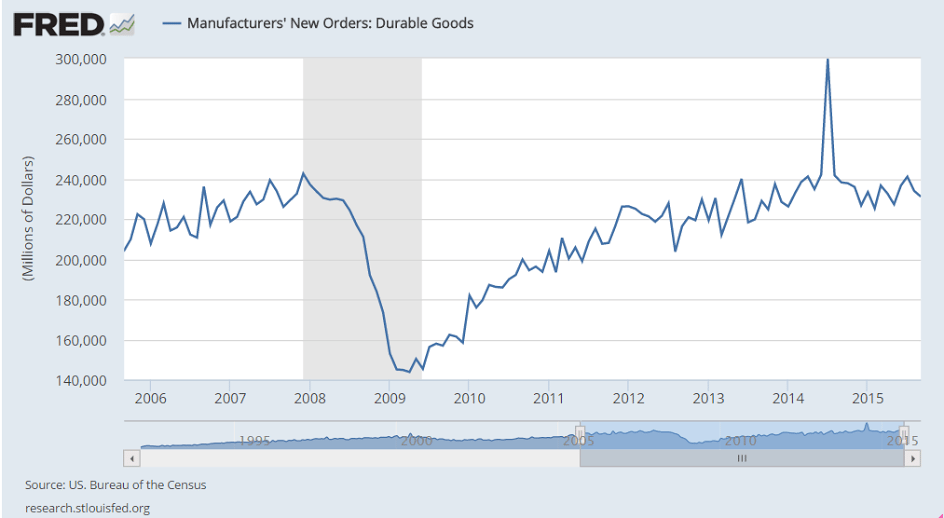
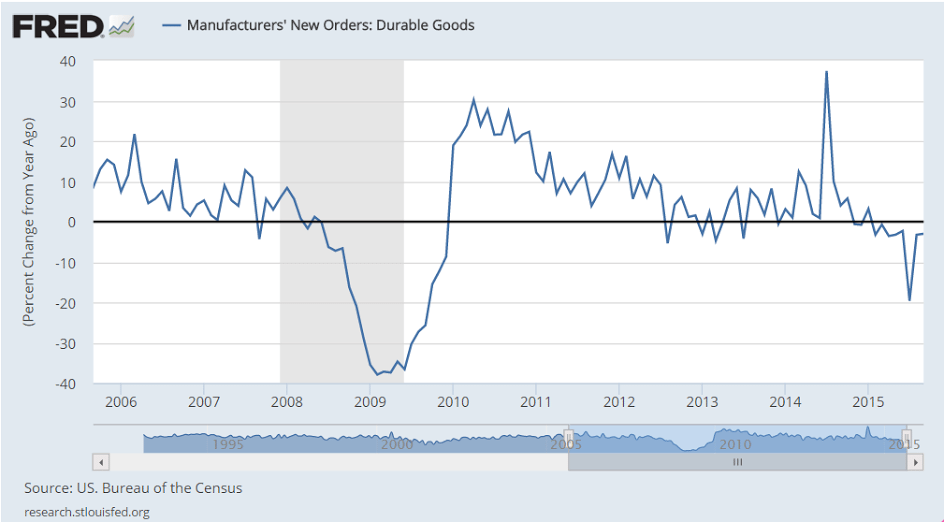
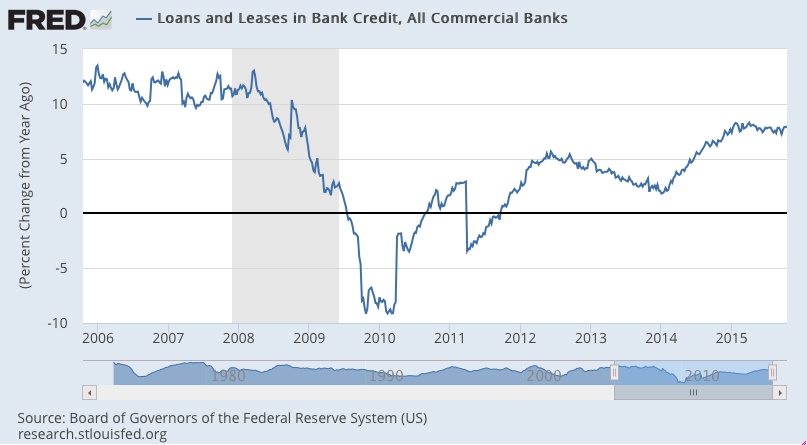
Typical very late cycle pattern here: