LA port traffic, Philly Fed Forecasting Survey, Job Growth Chart, Japan

LA area Port Traffic declined in October

By Bill McBride

First, from the WSJ: Quiet U.S. Ports Spark Slowdown Fears

For the first time in at least a decade, imports fell in both September and October at each of the three busiest U.S. seaports, according to data from trade researcher Zepol Corp. analyzed by The Wall Street Journal. …

The declines came during a stretch from late summer to early fall known in the transportation world as peak shipping season, when cargo volumes typically surge through U.S. ports. It is a crucial few months for the U.S. economy as well: High import volumes can signal a confident view on the economy among retailers and manufacturers, while fears of a slowdown grow when ports are quiet.

Note: There were some large swings in LA area port traffic earlier this year due to labor issues that were settled in late February. Port traffic surged in March as the waiting ships were unloaded (the trade deficit increased in March too), and port traffic declined in April.
er-11-16-1

They’ve been starting too high and revising down for a very long time now!

Fourth Quarter 2015 Survey of Professional Forecasters Shave Their Growth Estimates for 2016 and 2017

from the Philadelphia Fed

Growth in real GDP in 2016 and 2017 looks a little slower now than it did three months ago, according to 45 forecasters surveyed by the Federal Reserve Bank of Philadelphia. The forecasters currently see growth in the annual-average level of real GDP at 2.6 percent in 2016 and 2.5 percent in 2017. These current estimates represent downward revisions to the outlook of three months ago, when the forecasters thought 2016 growth would be 2.8 percent and 2017 growth would be 2.6 percent. Notably, the forecasters have raised their growth estimates for 2018. They now see real GDP growing 2.8 percent in 2018, up from the previous estimate of 2.4 percent.

Jobs growth slowing:
er-11-16-2

Japan economy shrinks 0.8 pct in Q3, back in recession

PPI, Retail Sales, Consumer Sentiment, Business Sales and Inventories

er-11-13-11

More deflation news here:

PPI-FD
er-11-13-10

er-11-13-9

Nothing good here, and of course sales = income, so lower sales = lower incomes.

Also, the boost to prior months from car sales looks like it’s fading:

Retail Sales
er-11-13-8
Highlights
Retail sales slowed in October but fundamentally remain solid. Sales rose only 0.1 percent, 2 tenths under the Econoday consensus. But when excluding vehicles, which slipped back after surging in prior months, and when also excluding gasoline stations, where sales once again fell on price weakness, core sales rose a respectable 0.3 percent which hits the consensus.

And there are solid gains including for housing-related components of furniture & home furnishings and building materials & garden equipment. Nonstore retailers also show a strong gain as do restaurants.

Aside from vehicles and gas, other areas that declined are electronics & appliance stores, grocery stores, and the big category of general merchandise sales. Declines in the latter may be related to import-price effects which are deflating sales. A positive, however, is a gain for department stores which are a subset of general merchandise. Apparel sales, which are definitely being held down by import prices, were unchanged following two small declines.

Year-on-year rates really tell the story especially a respectable plus 4.1 percent rate for sales excluding gasoline stations, a component that is down 20.1 percent and has been badly skewing total sales all year. Total sales are up only 1.7 percent.

The headline is weak and year-on-year rates did ease off, including for core ex-auto ex-gas to plus 3.5 from 3.8 percent, but this report is better than it looks, showing underlying strength that shouldn’t scale down expectations for a December FOMC rate hike.

er-11-13-7

er-11-13-6

er-11-13-5

er-11-13-4

er-11-13-3
Looks to me like the excess inventory situation has gone from bad to worse, as sales continue to lag output:

MANUFACTURING AND TRADE INVENTORIES AND SALES September 2015 Sales.

The U.S. Census Bureau announced today that the combined value of distributive trade sales and manufacturers’ shipments for September, adjusted for seasonal and trading-day differences but not for price changes, was estimated at $1,320.3 billion, virtually unchanged (±0.2%)* from August 2015, but was down 2.8 percent (±0.4%) from September 2014.

Inventories.

Manufacturers’ and trade inventories, adjusted for seasonal variations but not for price changes, were estimated at an end-of-month level of $1,817.5 billion, up 0.3 percent (±0.1%) from August 2015 and were up 2.5 percent (±0.5%) from September 2014. Inventories/Sales Ratio.

The total business inventories/sales ratio based on seasonally adjusted data at the end of September was 1.38. The September 2014 ratio was 1.31.

er-11-13-2

er-11-13-1

Debt and Recession, Jolts

This shows how private sector credit deceleration is associated with recessions. It’s about the need for those spending more than their incomes to offset those spending less than their incomes. And most often private sector deficit spending decelerates some time after public sector deficit spending decelerates and fails to provide the income and net financial assets that supports private sector deficit spending.

er-11-12-3

United States : JOLTS
er-11-12-4
Highlights
In a positive sign for labor demand, job openings in the JOLTS report popped back up in September, to 5.526 million from a revised 5.377 million in August. Openings peaked in July at a recovery best 5.668 million. High job demand will absorb yet more slack from what is a dwindling supply of available labor, in what could precede wage inflation and become a major concern for Fed policy makers. But in a contrasting indication of worker hesitance, confidence in the strength of the labor market may be limited based on the report’s quits rate which remains stubbornly low, unchanged for a sixth month at 1.9 percent.

Mtg Purchase Apps, Saudi Pricing History, China

So much for housing leading the way up- looks to have gone from flat to down:

MBA Mortgage Applications
er-11-12-1

sg2015111243711
For the most part Saudis have been lowering premiums and increasing discounts which causes prices to fall to get their sales up to their pumping capacity:
er-11-12-2

Not without a bit of pain, which they may have come to believe inevitable due to long term supply/demand dynamics:

Saudi Arabia risks destroying Opec and feeding the Isil monster

(Telegraph) &#8212 The rumblings of revolt against Saudi Arabia and the Opec Gulf states are growing louder. The International Energy Agency (IEA) estimates that the oil price crash has cut Opec revenues from $1 trillion a year to $550bn. US output has dropped by 500,000 b/d since April, but the fall in October slowed to 40,000 b/d. Total production of 9.1m b/d is roughly where it was a year ago when the price war began. A confidential order from King Salman has frozen new hiring by the state, stopped property contracts and purchases of cars, and halted a long list of projects.

We’ll see what this means in actual practice:

Li promises full use of fiscal weapons

(Xinhua) — To lead to a major lift in the nation’s productivity, the government will ensure a steady business environment for all major sectors of the market, the president said. The government will make full use of fiscal policies, reduce taxes properly and help companies to overcome their difficulties and upgrade structure, Li told the meeting. The government will invest more to improve infrastructure in central and western China to achieve balanced development, and private companies are welcome to invest in such projects, Li said.

Saudi statement, NFIB detail

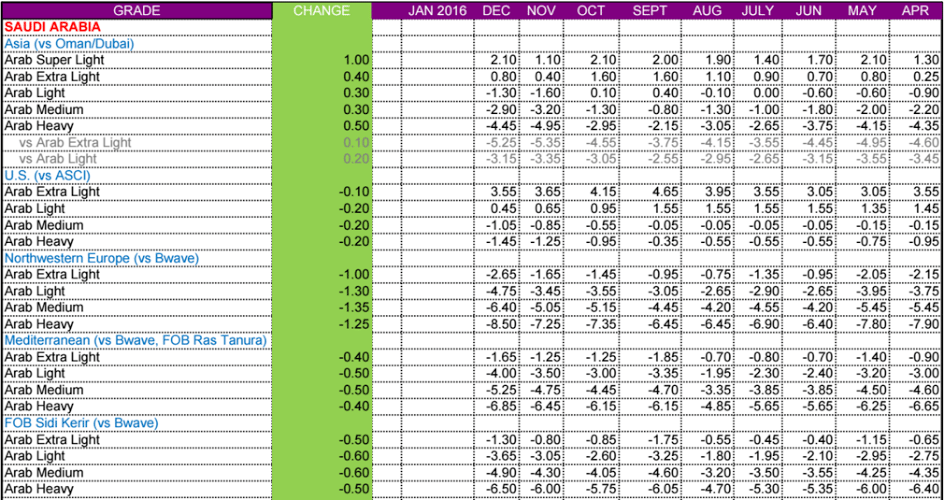
This means they continue with their discount policy until their entire output capacity is being sold, and then continue to sell their full output capacity at ‘market prices’. That is, they no longer want the high priced producers to benefit from their willingness to to be swing producer and support prices by not selling their full output:

Moving ahead, Opec — led by Saudi Arabia — plans to pump as much as it can towards meeting global oil demand, leaving higher-cost producers to make up the remainder.
For higher-cost producers, “$100 oil was perceived as a guarantee of no risk for investment”, said Mr Falih. “Now, the insurance policy that’s been provided free of charge by Saudi Arabia does not exist any more.”

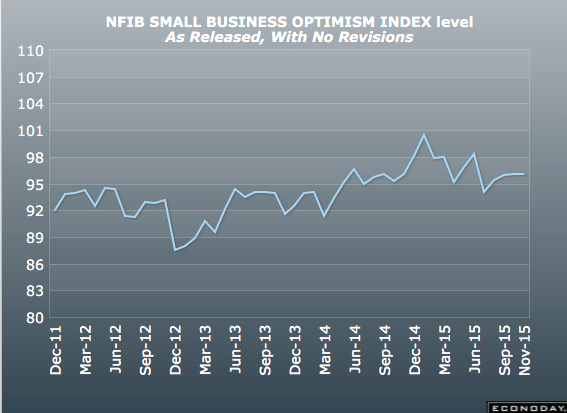
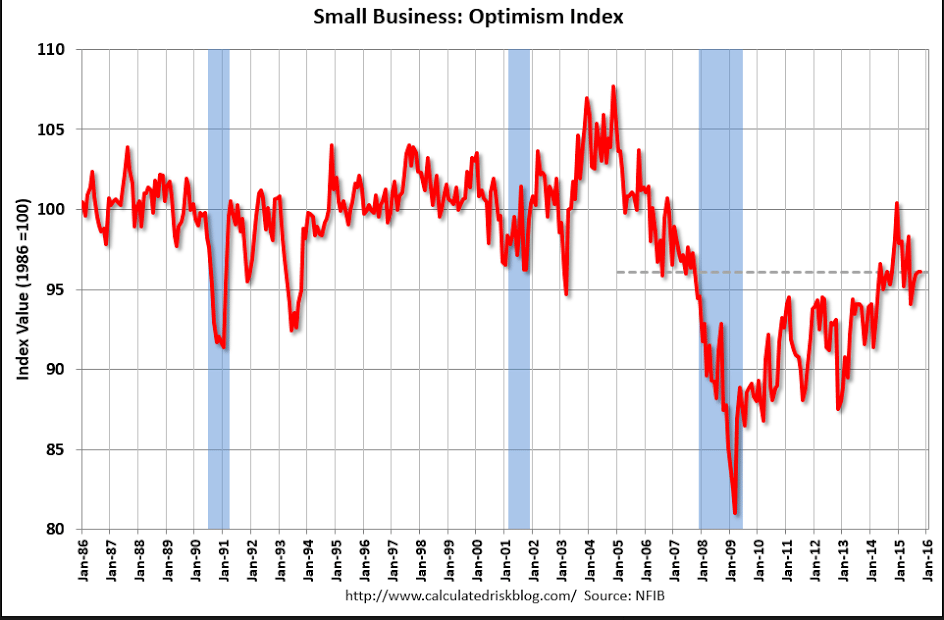
Regarding the NFIB small business survey for October released yesterday:

GDP growth languished in Q3, and will not likely impress in Q4. The industrial sector is weakening and the small business sector has not returned to its historical role in the production of GDP and jobs. The October NFIB survey gave no indication of a resurgence in growth in the small business sector, readings remaining below average.

NFIB chief economist Bill Dunkelberg states:

The October NFIB survey gave no indication of a resurgence in growth in the small business sector with the Index remaining below the 42 year average of 98. The labor market components might have held at historically strong levels but this time owners reported no net growth in employment, which is a significant drop from reports in the previous four months.

Profits and Wages. Earnings trends deteriorated 3 points, falling to a negative 16 percent. Far more owners are reporting profits lower quarter to quarter than higher. A seasonally adjusted net 21 percent of owners reported raising worker compensation, down 2 points from September and 4 points below the expansion high reading reached in January and May. The net percent planning to increase compensation rose 1 point to 17 percent, still strong for this recovery.

Labor Markets. Reported job creation came to a halt in October, with owners adding a net 0.0 workers per firm in recent months. Fifty-five percent reported hiring or trying to hire (up 2 points), but 48 percent reported few or no qualified applicants for the positions they were trying to fill. Fourteen percent reported using temporary workers, unchanged from September. Twentyseven percent of all owners reported job openings they could not fill in the current period, unchanged from September. A seasonally adjusted net 11 percent plan to create new jobs, down 1 point. A seasonally adjusted net 21 percent of owners reported raising worker compensation, down 2 points from the past few months. The percent of owners citing the difficulty of finding qualifed workers as their Most Important Business Problem fell 3 points to 13 percent, but still third on the list of problems behind taxes and regulations and red tape.

Profits and Wages. Earnings trends deteriorated 3 points, falling to a negative 16 percent. Far more owners are reporting profits lower quarter to quarter than higher. A seasonally adjusted net 21 percent of owners reported raising worker compensation, down 2 points from September and 4 points below the expansion high reading reached in January and May. The net percent planning to increase compensation rose 1 point to 17 percent, still strong for this recovery.

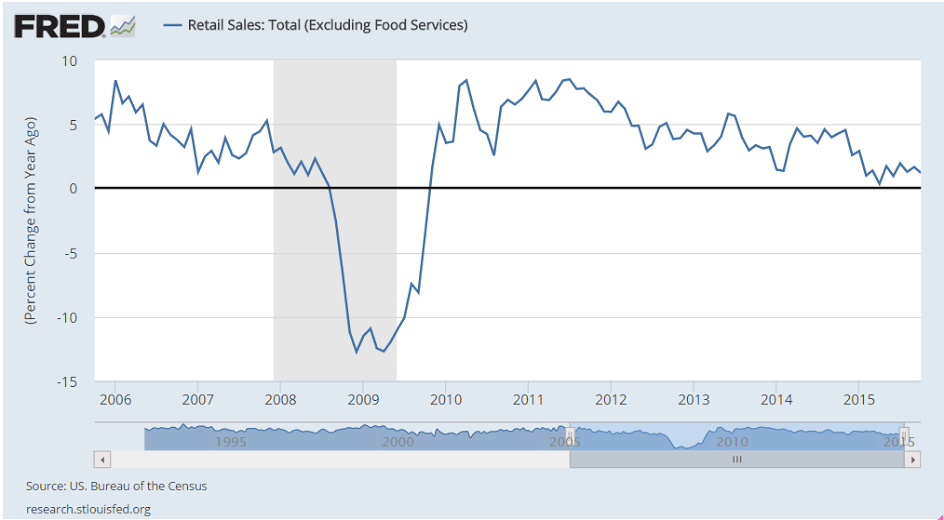
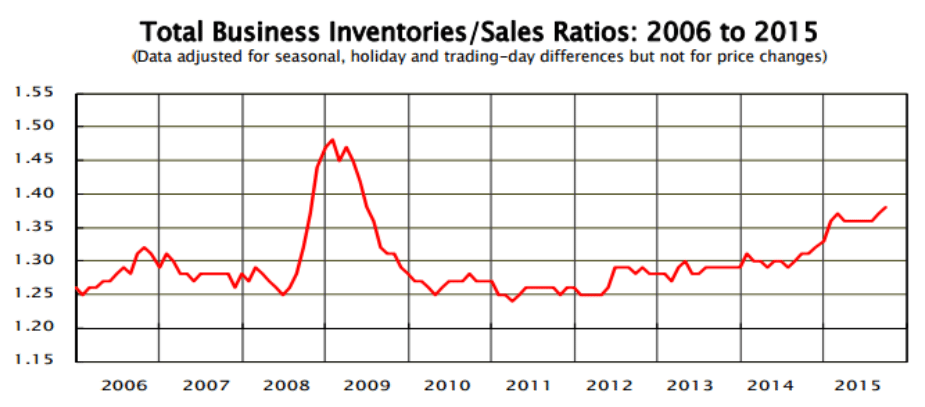
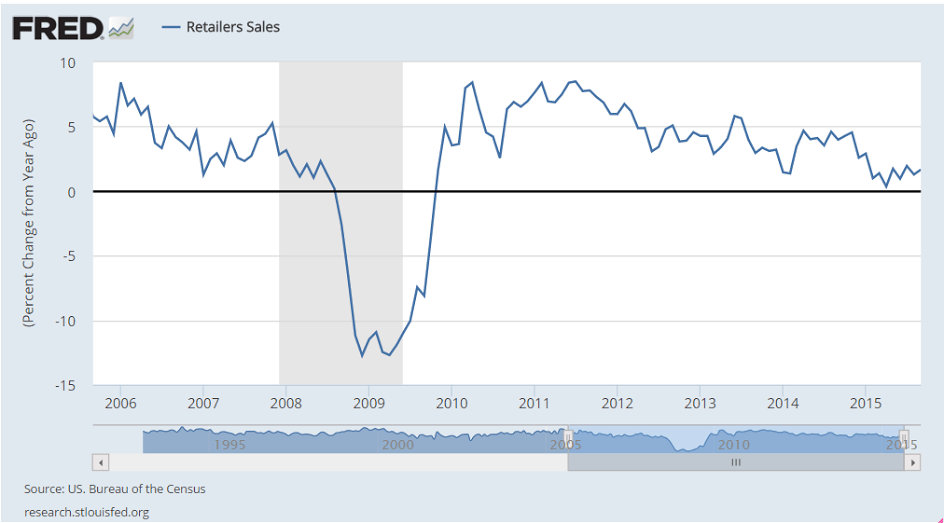
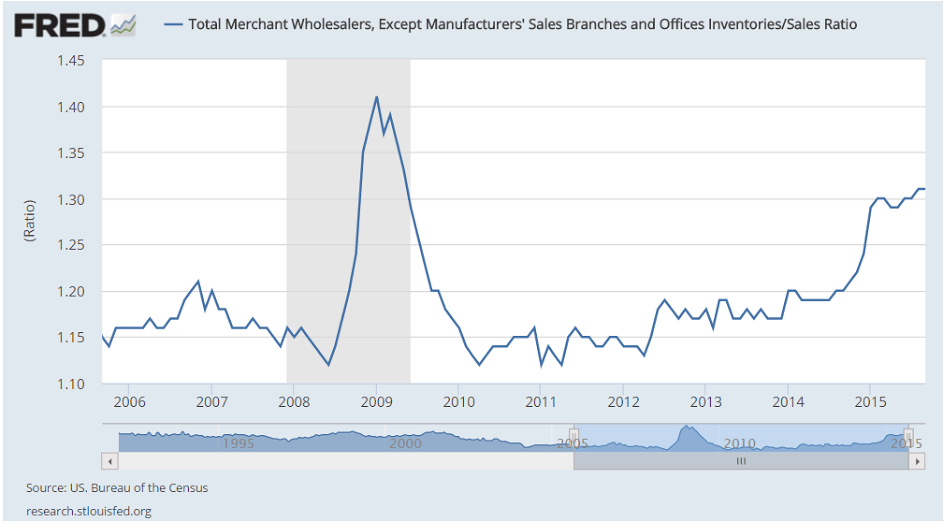
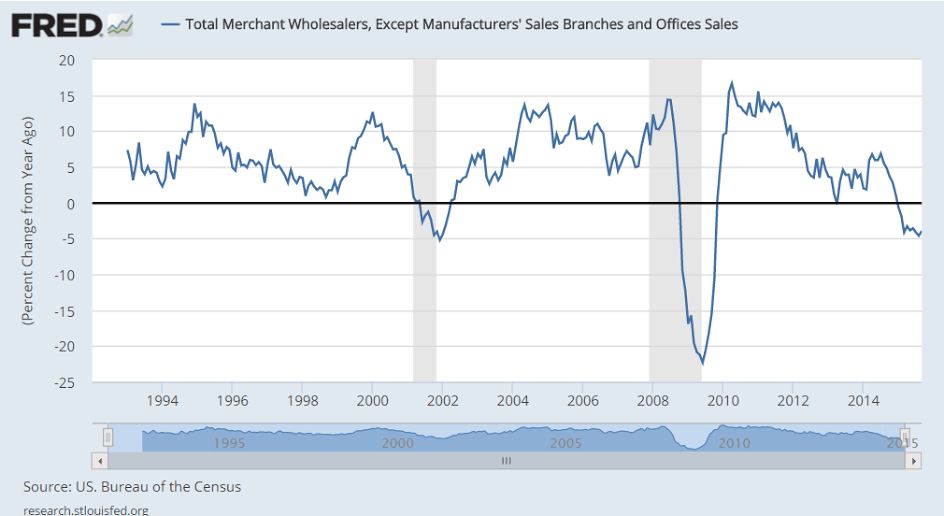
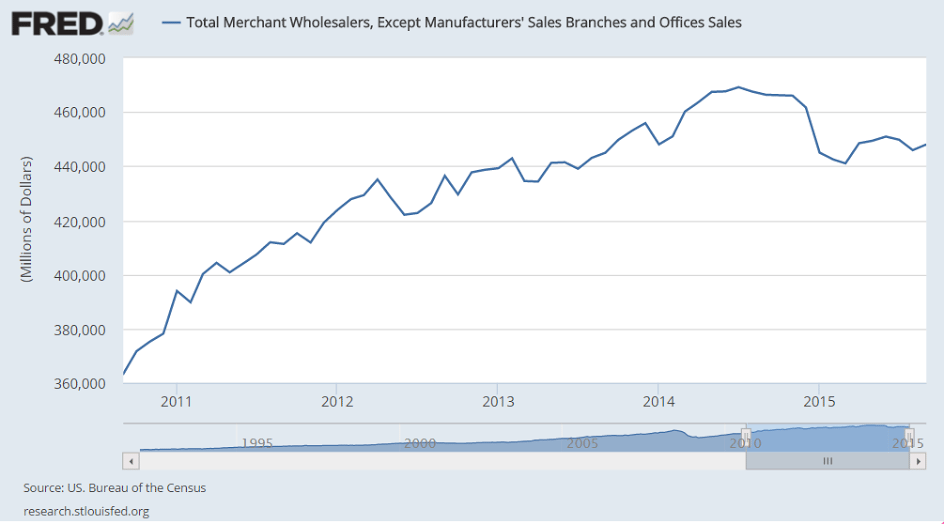
Inventory and Sales. The net percent of all owners (seasonally adjusted) reporting higher nominalsales in the past 3 months compared to the prior 3 months deteriorated 7 percentage points to a net negative 8 percent. Twelve percent cited weak sales as their top business problem, up 1 point. Expected real sales volumes posted a 3 point improvement, rising to a seasonally adjusted net 4 percent of owners expecting gains, a long way down from the 20 percent reading in December 2014. Overall, not a very positive outlook, but at least positive. The net percent of owners reporting inventory increases was a net negative 2 percent (seasonally adjusted), down 2 points. The net percent of owners viewing current inventory stocks as “too low” was unchanged a net negative 4 percent, as weak sales made current stocks look excessive and future sales are not expect to grow much. The net percent of owners planning to add to inventory fell 3 points to a net 0 percent, not much help for Q4 GDP growth.

Capital Spending. Fifty-eight percent reported capital outlays, unchanged from August and September. The percent of owners planning capital outlays in the next 3 to 6 months gained 1 point to 26 percent, not a strong reading historically but among the best in this expansion. Owner expectations for the economy overall appear to anticipate a continuation of “under-performance”. Investment plans remain historically sub-par, and owners have little interest in borrowing to support investment spending that promises little return. The small business sector remains in “maintenance mode”.

SNB $US reserves

Note the ‘currency allocation’ of 33% to $US.

The SNB was buying euro and selling swiss francs to keep the franc from strengthening beyond 1.20 vs euro. To then get the $US exposure, they would have to sell some of their euro to buy $US.

So that means, on average, that for euro sold to buy swiss francs, 33% of those euro were then sold for $US.

So agents ‘fleeing the euro’ by buying swiss francs were in fact partially selling their euro to buy $US, with the SNB their ‘agent’.

It’s just one of the channels for portfolio selling of euro that’s been driving down the euro. Meanwhile, this type of driving down the euro supports the euro area trade surplus which is increasingly ‘draining’ euro from global markets, leaving the sellers of euro ‘short’ and ‘under allocated’ with, collectively, no way to get back their euro (financial assets).

Also, in case, the SNB never has to sell it’s $ or euro, as it can hold them indefinitely and let its currency float. That could trigger a weakening of the swiss franc vs the euro should holders of swiss francs someday want to sell them to get their euro back, which is likely since most likely ultimately have euro liabilities to fund:

snb

Lumber Prices, Small Business Index, Import Export Prices, Redbook Retail Sales, Wholesale Trade

Along with most indicators, this one turned south as oil capex collapsed:

Update: Framing Lumber Prices down Sharply Year-over-year

Here is another graph on framing lumber prices. Early in 2013 lumber prices came close to the housing bubble highs.

The price increases in early 2013 were due to a surge in demand (more housing starts) and supply constraints (framing lumber suppliers were working to bring more capacity online).

Prices didn’t increase as much early in 2014 (more supply, smaller “surge” in demand).

In 2015, even with the pickup in U.S. housing starts, prices are down year-over-year. Note: Multifamily starts do not use as much lumber as single family starts, and there was a surge in multi-family starts.
er-11-10-1

There were hopes that the last tic up was the beginning of a reversal but now seems the downtrend since the oil capex collapse may still be in progress:
er-11-10-2
er-11-10-3
The deflationary forces continue:

Import and Export Prices
er-11-10-4

er-11-10-5
No sign of consumer strength here:
er-11-10-6
Inventories remain high going into Q4:

Wholesale Trade
er-11-10-x
Highlights
Wholesale inventories rose 0.5 percent in September following an upward revised 0.3 percent gain in August. The September build appears to be intentional based on a 0.5 percent rise in September sales that keeps the stock-to-sales ratio for wholesalers unchanged at 1.31.

Inventories of autos rose 2.3 percent as wholesalers try to keep up with what is very strong retail demand for autos. Excluding autos, the stock-to-sales wholesale ratio is unchanged at 1.27.

Inventory draws reflecting gains in sales include computer equipment, electrical goods, and apparel. Wholesale inventories of furniture rose on a swing lower for sales.

Inventories in general are heavy and businesses, waiting for a pick up in sales, are being careful to keep them in check. Today’s results are in line with Commerce Department assumptions and should have little bearing on third-quarter GDP revisions. Watch Friday for the business inventories report which will include data from the retail sector.

er-11-10-7
Sales looking like recession:
er-11-10-8
er-11-10-9
Autos are just holding their own:
er-11-10-10

Employment chart, China trade, SNB

The red line tends to drag down the blue line, often when deficit spending gets too low:
er-11-9-1

er-11-9-2

Exports drop again, imports drop more, so the trade surplus grows, and the US should see more imports and fewer exports, while euro zone imports are down which adds to their trade surplus:

China’s Trade Drop Means More Stimulus Measures Are Coming

Exports drop for a fourth month, import declines match record

Trade surplus to help ease currency depreciation pressure

China’s exports fell for a fourth straight month and imports matched a record stretch of declines, signaling that the mounting drag from slower global growth will push policy makers toward expanding stimulus.

Overseas shipments dropped 6.9 percent in October in dollar terms, the customs administration said Sunday, a bigger decline than estimated by all 31 economists in a Bloomberg survey. Weaker demand for coal, iron and other commodities for China’s declining heavy industries helped drag imports down 18.8 percent in dollar terms, leaving a record trade surplus of $61.6 billion.
er-11-9-3
Fiscal stimulus this year includes more infrastructure spending and expanding the lending capacity for the China Development Bank and other policy banks. The PBOC has also made repeated reductions to the amount of reserves required of lenders.

Exports to Japan slumped 9 percent in the first 10 months from a year earlier, while those to the European Union declined 3.7 percent. Shipments to Hong Kong dropped 11.7 percent during the same period.

Slowing Growth

Exports to the U.S., China’s largest trading partner, jumped 5.8 percent in the first 10 months from a year earlier, while those to the Association of Southeast Asian Nations increased 4.2 percent. Shipments to India rose 8.9 percent.

Imports from all 10 of the major trade partners listed by the customs administration declined in the first 10 months. Imports from Australia, a major source of China’s iron ore during the real estate boom, plunged 25.7 percent.

The record trade surplus helped spur a surprise increase in foreign-exchange reserves in October despite an erosion of holdings after the PBOC intervened to boost the yuan. The central bank’s stockpile rose to $3.53 trillion last month from $3.51 trillion at the end of September, the PBOC said Saturday.

“The large trade surplus could offset capital outflow” and curb expectations for the yuan’s depreciation, Liu Ligang, chief Greater China economist at Australia & New Zealand Banking Group Ltd. in Hong Kong, wrote in a note.

Looks like the Swiss National Bank, with about 550 billion in reserves in its portfolio obtained selling it’s currency for euro to hold the peg, may have been selling some of those euro to buy $ to buy US stocks:

SNB’s Stake in Apple, Microsoft, Exxon Rose in Third Quarter

By Catherine Bosley

Nov 4 (Bloomberg) — The Swiss National Bank owned more shares of Apple Inc., Microsoft Corp. and Exxon Mobil Corp. in the third

quarter, taking its U.S. equity portfolio to $38.95 billion.

Switzerland’s central bank held 10.3 million shares in the iPhone maker on Sept. 30, according to a regulatory filing made to the U.S. Securities and Exchange Commission and published on Wednesday. That compares with 9.4 million shares at the end of June, an increase of nearly 10 percent.

The SNB’s stake in Exxon rose by a similar extent, while in Microsoft it registered an increase of just over 9 percent.

Consumer Credit, Credit Check, Rail Traffic, Employment Charts

Consumer Credit

er-11-7-20

Highlights
In a record report, consumer credit data are strongly confirming the strength of the consumer. Credit outstanding surged $28.9 billion in September for the largest gain in the history of the series which goes back to 1941. Nonrevolving credit, in part reflecting vehicle financing and also student loans, rose $22.2 billion. Revolving credit, reflecting a rise in credit-card debt, jumped $6.7 billion to extend an emerging run of strength that suggests consumers are now less reluctant to run up their credit cards which, for retailers certainly, is a good omen for the holidays.

er-11-7-19

Hard to detect anything happening here except some volatility and maybe consumers borrowing more in response to low personal income growth?
er-11-7-18

er-11-7-17

er-11-7-16

er-11-7-15

er-11-7-14

Fed rate hikes are meant to slow credit growth.

I don’t see any credit growth they’d want to be slowing?
er-11-7-13

er-11-7-12

This has recently flattened at grow rates associated with the last recession:
er-11-7-11

er-11-7-10

er-11-7-9

Rail Week Ending 31 October 2015: Monthly Data Now Contracting 4.3% Year-over-Year

Week 43 of 2015 shows same week total rail traffic (from same week one year ago) and monthly total rail traffic (from same month one year ago) declined according to the Association of American Railroads (AAR) traffic data. Intermodal traffic contracted year-over-year, which accounts for approximately half of movements. and weekly railcar counts continued in contraction. October 2015 is down 4.3% over October 2014.

Yes, this earnings measure did pop up some, but way behind prior cycles and just a one month move at this point. The 2014 move they were worried about reversed itself before it got anywhere near ‘danger’ levels, whatever that actually means:
er-11-7-8
Again, a one month move that could just as easily reverse next month, and in any case far from posing any kind of problem to ‘inflation’ or employment (the Fed’s mandates):
er-11-7-7
And this is from the GDP report:
er-11-7-6
This was just starting to begin to recover when the oil price collapse bent the curve downward:
er-11-7-5

er-11-7-4

No ‘demographic’ effect here, just weakness:
er-11-7-3

er-11-7-2

This also began decelerating when oil capex collapsed:
er-11-7-1