NAHB Housing Market Index, IP

This is the home builders index which has been influencing forecaster’s optimism for housing. Note that it’s stalled well below levels of prior cycles, and that there are far fewer home builders this time around as well:

Housing Market Index


Highlights
The drop this month in interest rates isn’t driving up demand for housing, based on weekly mortgage bankers data for purchase applications and now on the housing market index from the nation’s home builders which is down 5 points to 54. The key in October’s report is the traffic component which is down a full 6 points to 41. Lack of traffic points to lack of interest including lack of interest from the important group of first-time home buyers. The report’s two other components are also down with present sales down 6 points to 57 and future sales down 3 points to 64.

All regions show declines in their composite scores especially the Midwest which is down 8 points to 53 and the West which is down 7 points to 54. The South, which is by far the largest region for new homes, continues to lead, at 59 for a 4 point dip in the month. The Northeast is by the smallest region for new homes and trails in this report at 40 for a 2 point dip.

New home builders can’t blame high interest rates or high unemployment for the weakness in their sector. Housing starts for September will be posted tomorrow morning at 8:30 a.m. ET.

NAHB: Builder Confidence decreased to 54 in October

All three HMI components declined in October. The index gauging current sales conditions decreased six points to 57, while the index measuring expectations for future sales slipped three points to 64 and the index gauging traffic of prospective buyers dropped six points to 41.

Looking at the three-month moving averages for regional HMI scores, the Northeast and Midwest remained flat at 41 and 59, respectively. The South rose two points to 58 and the West registered a one-point loss to 57.

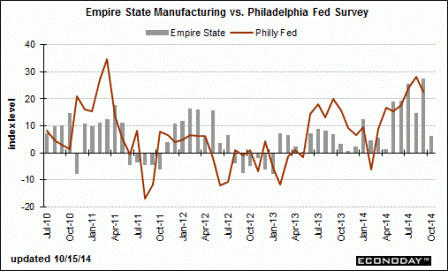
Industrial Production keeps chugging along, reversing last month’s dip so the two month average is about the average annual growth rate:

NFIB, Mtg apps, retail sales, Empire State

Today’s releases are causing analysts to reduce their GDP forecasts for Q3, which ended Sept 30. Note the difficulty in forecasting the past when considering the difficulty in forecasting the future…

This was released yesterday, turned down from not so good levels:

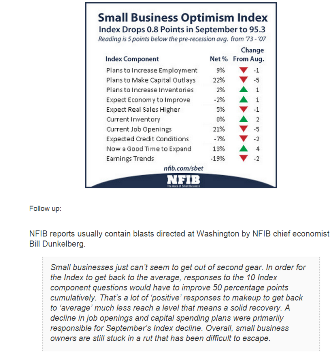
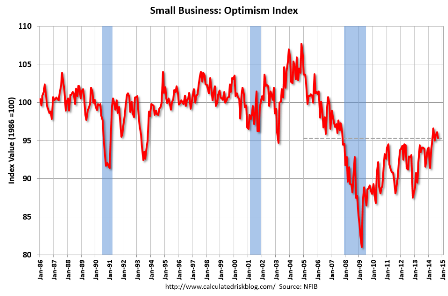
NFIB Small Business Optimism Index


Full size image

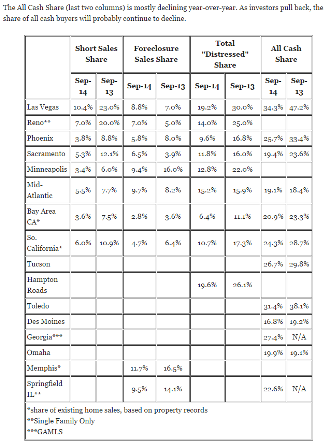
Mtg purchase apps down and cash sales down as well, makes it problematic for total sales to rise?

MBA Purchase Applications


Highlights
The steep drop underway in mortgage rates is sharply stimulating demand for refinancing but isn’t yet doing much for home purchases. The refinancing index surged 11.0 percent in the October 10 week as the average rate for conforming loans ($417,000 or less) fell 10 basis points in the week to 4.20 percent which is the lowest average since June last year. But in contrast, the purchases index fell 1.0 percent in the week for a year-on-year decline of 4.0 percent.


Full size image

Bank mtg lending way down from a year ago, flattish this year:

At Wells Fargo and Chase, mortgage lending inches up

By Ruth Mantell

Oct 14 (MarketWatch) — Wells Fargo the country’s No. 1 mortgage originator, said it made $48 billion in new home loans in the third quarter, a hair up from the prior quarter, and down 40% from the year-earlier period. Meanwhile, J.P. Morgan Chase JPM the second-largest mortgage lender, said its third-quarter originations hit $21 billion, up from $17 billion in the second quarter, and down 48% from a year earlier. Some qualified borrowers can’t get a mortgage because of many lenders’ strict standards that aim to shield banks from the financial risks that come with the possibility of having to buy back a questionable loan, said John Stumpf, chairman and chief executive at Wells, on aTuesday conference call.

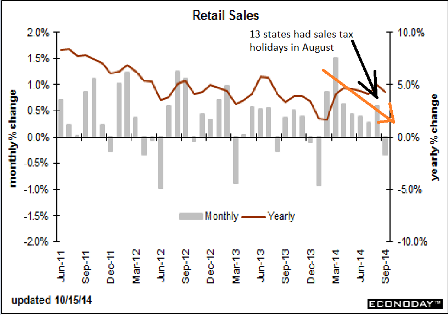
Recall last month when retail sales were up an unexpected .6% I wrote about how 13 state had tax holidays in August which may have moved sales forward from September, which just came out weaker than expected at -.3%, leaving the down trend intact:

Retail Sales


Highlights
As expected, auto sales and gasoline sales tugged down on retail sales in September. But core numbers were weaker than expected. Retail sales in September declined 0.3 percent after jumping 0.6 percent in August. Analysts forecast a 0.1 percent dip for September. Excluding autos, sales slipped 0.2 percent after gaining 0.3 percent in August. Expectations were for a 0.3 percent increase. Excluding both autos and gasoline sales dipped 0.1 percent, following a jump of 0.5 percent in August. Expectations were for 0.5 percent.

Within the core, softness was seen in declines furniture & home furnishings, building materials, nonstore retailers, clothing & accessories, and sporting goods & hobbies. Gains were posted for electronics & appliances (likely iPhones), health & personal care, general merchandise, and food services & drinking places.

Today’s report is very mixed. It was not surprising that a downswing in autos after a strong August pulled down sales. And the same was expected for gasoline prices pulling down sales. But core sales eased despite a surge in electronics sales. Core sales eased after a very strong August. On a very positive note, food services & drinking places gained a robust 0.6 percent, matching the pace for August.

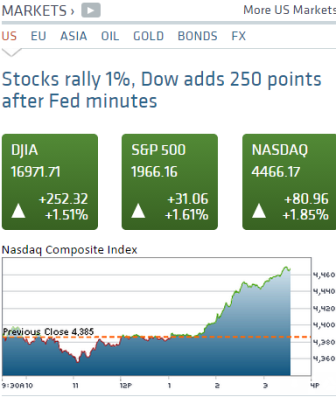
I don’t put much stock in these as they seem to follow the stock market, as this exceptional drop seems to confirm. Or maybe the stock market leads weakness…

Weekly credit update comments

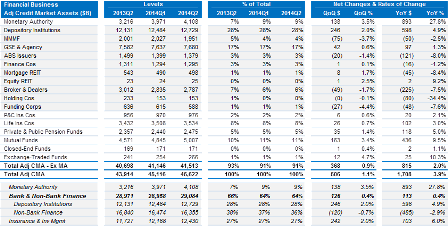
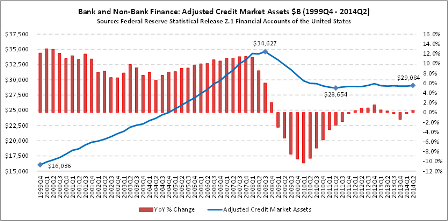
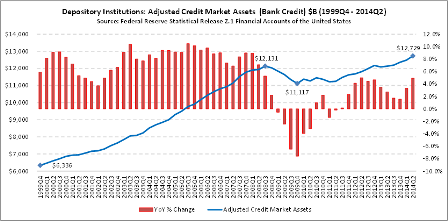
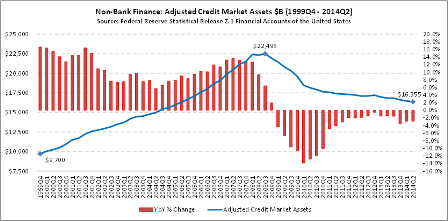
I got this email supporting the idea that bank credit expansion has been at the expense of non bank lenders, with low total credit growth.

As previously discussed, I don’t see the credit growth necessary to sustain the 3%+ GDP growth being forecast. Instead, I see the q1 negative growth and H1 total growth of only 1.2% as indicative of the underlying trend.

Warren: With respect to the recent “surge” in bank credit, please see below info that I prepared from Z.1. I recall you once suggesting that the expansion in bank credit may be attributed to banks taking share from non-bank lenders. Based on below table and graphs, that appears to be the case. When you combine bank and non-bank lenders (what I refer to as “Bank & Non-Bank Finance”), growth in credit market assets is essentially zero/nominal over recent periods, and you can see the recent increase in bank credit appears to be largely offset by a decrease in non-bank credit. Most non-banks are essentially “agents” of banks in my opinion so should view together for macro perspective. Note below that my definition of “Adjusted Credit Market Assets” is the FRB’s definition plus money market, rev repo and security credit. Not sure if this is the “correct” way to view things and I could be way off base but figured may be worth passing along. Also, for the “Insurance & Inv Mgmt” Sectors, I think the growth there may support your demand leakage narrative (but excludes equities). Thx


Full size image


Full size image


Full size image


Full size image

There is no right time for the Fed to raise rates!

There is no right time for the Fed to raise rates!

Introduction
I reject the belief that economy is strong and operating anywhere near full employment. I also reject the belief that a zero-rate policy is inflationary, supports aggregate demand, or weakens the currency, or that higher rates slow the economy and reduce inflation. Additionally, I reject the mainstream view that employment is materially improving, the output gap is closing, and inflation is rising and returning to the Fed’s targets.

What I am asserting is that the Fed and the mainstream have it backwards with regard to how interest rates interact with the economy. They have it backwards with regard to both the current health of the economy and inflation, and, therefore, their discussion of appropriate monetary policy is entirely confused and inapplicable.

Furthermore, while I recognize that raising rates supports both aggregate demand and inflation, I am categorically against raising rates for that purpose. Instead, I propose making the zero-rate policy permanent and supporting demand with a full FICA tax suspension. And for a stronger price anchor than today’s unemployment policy, I propose a federally funded transition job for anyone willing and able to work to facilitate the transition from unemployment to private sector employment. Together these proposals support far higher levels of employment and price stability.

So when is the appropriate time to raise rates? I say never. Instead, leave the fed funds rate at zero, permanently, by law, and use fiscal adjustments to sustain full employment.

Analysis
My first point of contention with the mainstream is their presumption that low rates are supportive of aggregate demand and inflation through a variety of channels, including credit, expectations, and foreign exchange channels.

The problem with the mainstream credit channel is that it relies on the assumption that lower rates encourage borrowing to spend. At a micro level this seems plausible- people will borrow more to buy houses and cars, and business will borrow more to invest. But it breaks down at the macro level. For every dollar borrowed there is a dollar saved, so any reduction in interest costs for borrowers corresponds to an identical reduction for savers. The only way a rate cut would result in increased borrowing to spend would be if the propensity to spend of borrowers exceeded that of savers. The economy, however, is a large net saver, as government is an equally large net payer of interest on its outstanding debt. Therefore, rate cuts directly reduce government spending and the economy’s private sector’s net interest income. And looking at over two decades of zero-rates and QE in Japan, 6 years in the US, and 5 years of zero and now negative rates in the EU, the data is also telling me that lowering rates does not support demand, output, employment, or inflation. In fact, the only arguments that they do are counter factual- the economy would have been worse without it- or that it just needs more time. By logical extension, zero-rates and QE have also kept us from being overrun by elephants (not withstanding that they lurk in every room).

The second channel is the inflation expectations channel. This presumes that inflation is caused by inflation expectations, with those expecting higher prices to both accelerate purchases and demanding higher wages, and that lower rates will increase inflation expectations.

I don’t agree. First, with the currency itself a simple public monopoly, as a point of logic the price level is necessarily a function of prices paid by government when it spends (and/or collateral demanded when it lends), and not inflation expectations. And the income lost to the economy from reduced government interest payments works to reduce spending, regardless of expectations. Nor is there evidence of the collective effort required for higher expected prices to translate into higher wages. At best, organized demands for higher wages develop only well after the wage share of GDP falls.

Lower rates are further presumed to be supportive through the foreign exchange channel, causing currency depreciation that enhances ‘competitiveness’ via lower real wage costs for exporters along with an increase in inflation expectations from consumers facing higher prices for imports.

In addition to rejecting the inflation expectations channel, I also reject the presumption that lower rates cause currency depreciation and inflation, as does most empirical research. For example, after two decades of 0 rate policies the yen remained problematically strong and inflation problematically low. And the same holds for the euro and $US after many years of near zero-rate policies. In fact, theory and evidence points to the reverse- higher rates tend to weaken a currency and support higher levels of inflation.

There is another aspect to the foreign exchange channel, interest rates, and inflation. The spot and forward price for a non perishable commodity imply all storage costs, including interest expense. Therefore, with a permanent zero-rate policy, and assuming no other storage costs, the spot price of a commodity and its price for delivery any time in the future is the same. However, if rates were, say, 10%, the price of those commodities for delivery in the future would be 10% (annualized) higher. That is, a 10% rate implies a 10% continuous increase in prices, which is the textbook definition of inflation! It is the term structure of risk free rates itself that mirrors a term structure of prices which feeds into both the costs of production as well as the ability to pre-sell at higher prices, thereby establishing, by definition, inflation.

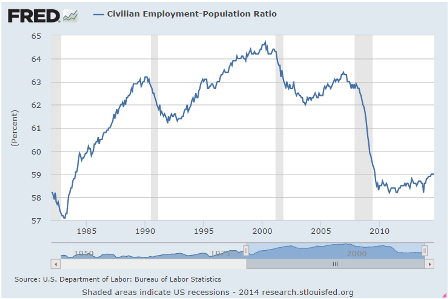
Finally, I see the output gap as being a lot higher than the mainstream does. While the total number of people reported to be working has increased, so has the population. To adjust for that look at the percentage of the population that’s employed, and it’s pretty much gone sideways since 2009, while in every prior recovery it went up at a pretty good clip once things got going:

The mainstream says this drop is all largely structural, meaning people got older or otherwise decided they didn’t want to work and dropped out of the labor force. The data clearly shows that in a good economy this doesn’t happen, and certainly not to this extreme degree. Instead what we are facing is a massive shortage of aggregate demand.
Conclusion
There is no right time for the Fed to raise rates. The economy continues to fail us, and monetary policy is not capable of fixing it. Instead the fed funds rate should be permanently set at zero (further implying the Treasury sell only 3 month t bills), leaving it to Congress to employ fiscal adjustments to meet their employment and price stability mandates.

Export and import prices

Deflationary chill coming in through the trade channel.

Import and Export Prices


Highlights
Cross-border inflationary pressures remain dormant including import prices which fell 0.5 percent in September for the third straight decline. Year-on-year, import prices are deep into the deflationary zone at minus 0.9 percent. The drop in imported petroleum prices, down 2.0 percent in the month and down 6.6 percent year-on-year, is a key factor in the import-price decline, but even when excluding petroleum, import prices fell 0.2 percent in the month. Year-on-year, the ex-petroleum reading is in the plus column but not by much, at plus 0.7 percent.

Export prices fell 0.2 percent for a second straight monthly decline and are also down 0.2 percent year-on-year. Here, agricultural prices are a key factor, down 0.9 percent in the month and down 2.9 percent year-on-year. When excluding agriculture, export prices also fell 0.2 percent on the month and are unchanged year-on-year.

Macro update

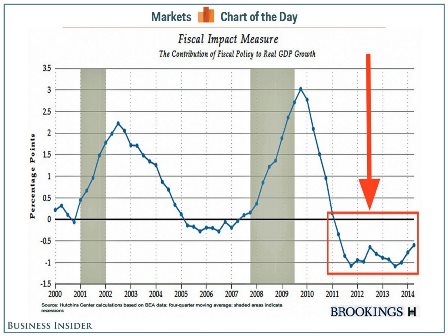
First this, supporting what I’ve been writing about all along:

Here’s Proof That Congress Has Been Dragging Down The Economy For Years

By Shane Ferro

Oct 8 (Business Insider) — In honor of the new fiscal year, the Brookings Institution released the Fiscal Impact Measure, an interactive chart by senior fellow Louise Sheiner that shows how the balance of government spending and tax revenues have affected US GDP growth.

The takeaway? Fiscal policies have been a drag on economic growth since 2011.


Full size image

And earlier today it was announced that August wholesale sales were down .7%, while inventories were up .7%. This means they produced the same but sold less and the unsold inventory is still there. Not good!

Unfortunately the Fed has the interest rate thing backwards, as in fact rate cuts slow the economy and depress inflation. So with the Fed thinking the economy is too weak to hike rates, they leave rates at 0 which ironically keeps the economy where it is. Not that I would raise rates to help the economy. Instead I’ve proposed fiscal measures, as previously discussed.

Fed Minutes Show Concern About Weak Overseas Growth, Strong Dollar (WSJ) “Some participants expressed concern that the persistent shortfall of economic growth and inflation in the euro area could lead to a further appreciation of the dollar and have adverse effects on the U.S. external sector,” according to the minutes. “Several participants added that slower economic growth in China or Japan or unanticipated events in the Middle East or Ukraine might pose a similar risk.” “Several participants thought that the current forward guidance regarding the federal funds rate suggested a longer period before liftoff, and perhaps also a more gradual increase in the federal funds rate thereafter, than they believed was likely to be appropriate given economic and financial conditions,” the minutes said.

The case for patience strengthens yet further by a consideration of the risks around the outlook. Across GS economics and markets research, we have recently cut our 2015 growth forecasts for China, Germany, and Italy, noted the continued weakness in Japan, and made a further upgrade to our already-bullish dollar views. So far, our analysis suggests that the spillovers from foreign demand weakness and currency appreciation only pose modest risks to US growth and inflation. But at the margin they amplify the asymmetric risks facing monetary policy at the zero bound emphasized by Chicago Fed President Charles Evans. If the FOMC raises the funds rate too late and inflation moves modestly above the 2% target, little is lost. But if the committee hikes too early and has to reverse course, the consequences are potentially more serious given the limited tools available at the zero bound for short-term rates.

Germany not looking good:

German exports plunge by largest amount in five-and-a-half years (Reuters) German exports slumped by 5.8 percent in August, their biggest fall since the height of the global financial crisis in January 2009. The Federal Statistics Office said late-falling summer vacations in some German states had contributed to the fall in both exports and imports. Seasonally adjusted imports falling 1.3 percent on the month, after rising 4.8 percent in July. The trade surplus stood at 17.5 billion euros, down from 22.2 billion euros in July and less than a forecast 18.5 billion euros. Later on Thursday a group of leading economic institutes is poised to sharply cut its forecasts for German growth. The top economic priority of Merkel’s government is to deliver on its promise of a federal budget that is in the black in 2015.

UK peaking?

London house prices fall in Sept. for first time since 2011: RICS (Reuters) The Royal Institution of Chartered Surveyors said prices in London fell for the first time since January 2011. The RICS national balance slid to +30 for September from a downwardly revised +39 in August. The RICS data is based on its members’ views on whether house prices in particular regions have risen or fallen in the past three months. British house prices are around 10 percent higher than a year ago, and house prices in London have risen by more than twice that. Over the next 12 months, they predict prices will rise 1 percent in London and 2 percent in Britain as a whole. Over the next five years, it expects average annual price growth of just under 5 percent.

British Chambers of Commerce warns of ‘alarm bell’ for UK recovery (Reuters) “The strong upsurge in manufacturing at the start of the year appears to have run its course. We may be hearing the first alarm bell for the UK,” said British Chambers of Commerce director-general John Longworth. The BCC said growth in goods exports as well as export orders for goods and services was its lowest since the fourth quarter of 2012. Services exports grew at the slowest rate since the third quarter of 2012. Manufacturers’ growth in domestic sales and orders slowed sharply from a record high in the second quarter to its lowest since the second quarter of 2013. However, sales remained strong in the services sector and confidence stayed high across the board.

Not to forget the stock market is a pretty fair leading indicator.

Some even say it causes what comes next:

Fed minutes

Bill McBride and I agree this is the key takeaway.

That is, the Fed still sees the risks as asymmetrical and therefore prefers to err on the side of ease. So stocks soar on the belief that low rates from the Fed will support earnings and valuations, as interest rates stay low believing the Fed will keep rates lower for longer.

Theory and evidence, however, continues to support my narrative that 0 rates and QE are deflationary and contractionary biases, and therefore the economy won’t accelerate as hoped for and as forecast by those believing otherwise.

FOMC Minutes: “Costs of downside shocks to the economy would be larger than those of upside shocks”

Note: Not every member of the FOMC agrees, but I think this is the key sentence: “the costs of downside shocks to the economy would be larger than those of upside shocks because, in current circumstances, it would be less problematic to remove accommodation quickly, if doing so becomes necessary, than to add accommodation”.

Consumer credit way down and downward revisions as well

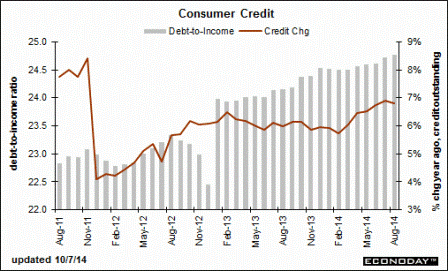
As I suggested previously, the well hyped ‘credit acceleration’ has fizzled indicating most GDP growth forecasts could be grossly overstated:


Highlights
Revolving credit outstanding had been edging higher in what had been a good indication for consumer spending but not in August, slipping $0.2 billion to end five straight months of gains. Non-revolving credit outstanding, boosted by strong vehicle sales and the government’s continued acquisition of student loans from private lenders, rose yet again, up $13.7 billion for the 36th straight month of increase. But the gain for the non-revolving component is the smallest since January and, combined with the slippage in revolving credit, made for a lower-than-expected total increase of $13.5 billion. This compares with Econoday expectations for $20 billion and is the lowest total increase since November. The consumer sector, the largest sector of the economy, has not been a stand-out contributor which has held back the recovery in general, and part of this drag is a reluctance among consumers to borrow.

The 10th Plague

Several years ago I began using the analogy of the 10th plague of the Old Testament, the idea being that the EU wouldn’t move away from austerity until it brought down Germany itself. It’s looking like that day is getting a whole lot closer, as austerity has not only damaged Germany’s export markets in the rest of the EU, but has also caused the rest of the EU to become more competitive vs Germany in the external markets, which have themselves been weakened by their own austerity policies.

German industry output plunges most in over 5 years

Oct 7 (Reuters) — German industrial output fell far more than expected in August and posted its biggest drop since the financial crisis in early 2009, Economy Ministry data showed on Tuesday, the latest figures to raise question marks about Europe’s largest economy.

The 4.0 percent month-on-month drop missed the consensus forecast in a Reuters poll for a 1.5 percent decrease and came short even of the lowest forecast for a 3.0 percent fall. It was the biggest drop since a 6.9 percent fall in January 2009.