Same story, mortgage purchase apps down and cash sales down keeps total sales low:
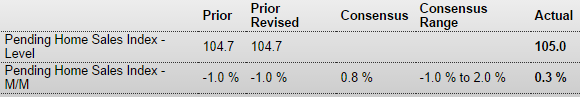
Pending Home Sales Index

Pending Home Sales Index
Whoops, last month’s ‘acceleration’ revised away.
Again, with purchase mtgs down and cash buyers down, hard to see total sales rising. And prices down as well, continuing that troubling tendency…
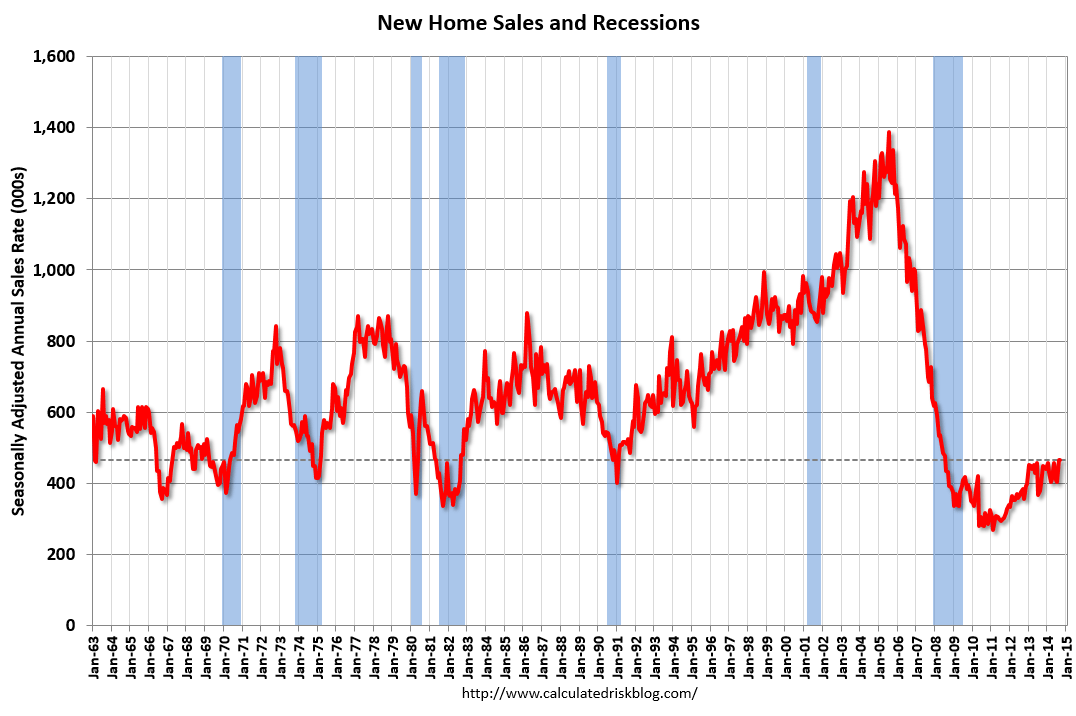
Highlights
New home sales, at a 467,000 annual rate, managed to top August’s great surge but only after August was revised sharply lower, from 504,000 to 466,000. Still, September’s 467,000 rate is the best of the recovery, going back to July 2008 with August’s 466,000 right behind in second place.
Price concession may be a key factor behind the September and August gains, gains that have lifted sales from this year’s earlier run in low 400,000s. The median price plunged a monthly 9.7 percent to $259,000. The year-on -year rate is in the minus column, at minus 4.0 percent, for only the second time in the last two years. Before this month, the year-on-year price was trending upward in the high single digits.
And cash buying is down.
Still doesn’t bode well for sales…
Slump in mortgage rates fails to rally home buyers
By Diana Olick
Oct 22 (CNBC) — More proof that low mortgage rates are not the key to home ownership today: Mortgage rates dropped to their lowest level in nearly 18 months last week, causing an 11.6 percent rise in mortgage applications, according to the Mortgage Bankers Association (MBA). The gains, however, were driven entirely by refinances, just as they have been for several weeks.
Refinance applications jumped a whopping 23 percent week-to-week on a seasonally-adjusted basis; volume was at the highest level since November 2013. Mortgage applications to purchase a home saw no boost at all from lower rates, falling 5 percent from one week earlier and 9 percent from a year ago.
Not much to get excited about here.
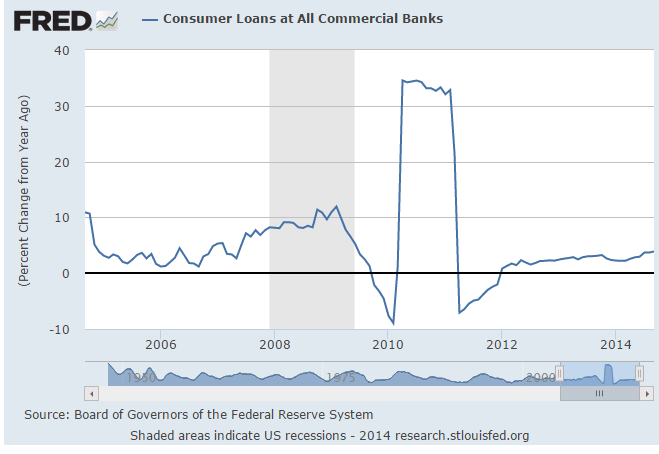
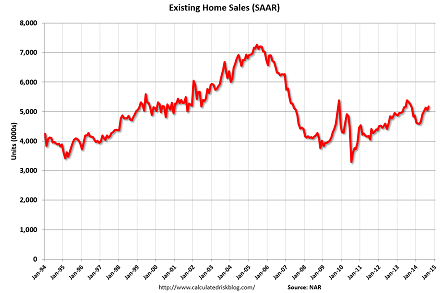
Sales are far below that of prior recoveries, and lower prices is a sign the ‘long cycle’ is over:
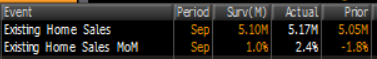
Existing Home Sales
Highlights
Existing home sales rose a solid 2.4 percent in September to a higher-than-expected annual rate of 5.17 million. Year-on-year, however, sales remain flat at minus 1.7 percent. Condo sales were the strongest in the month, up 5.2 percent to a 0.610 million rate though sales of single-family homes rose a solid 2.0 percent to a 4.56 million rate. Year-on-year, condo sales show no change with single-family homes at minus 1.9 percent.
The strength in sales moved supply off the market, to a total of 2.30 million homes and condos on the market vs 2.31 million in the prior week. Supply relative to sales fell to 5.3 months vs 5.5 months in August.
Home prices have been falling, which of course are a plus for sales, and are down 4.0 percent on the month to a median $209,700. Year-on-year, the median price is up 5.6 percent.
Note the highlighted changes in housing starts last year vs this year.
For the economy to grow as much this year as last year, all the pieces have to grow as much, and if any piece doesn’t grow as much, another has to grow that much more to make up for it.
Furthermore, single family is what’s declined, and as a single family unit costs more than a multi family unit, in $ terms it’s worse than this chart shows.
And so far I haven’t seen anything growing that much more than the drop in the rate of growth of housing