Labor market conditions index, Euro and yen charts, Fed discussion

This is the Fed’s own index and it’s on the very weak side:

Labor Market Conditions Index
er-12-7-1
Highlights
Friday’s employment report, led by a 211,000 rise in non-farm payrolls, was solid but didn’t give the labor market conditions index much of a boost, coming in at only plus 0.5 vs expectations for plus 1.7. The October index, however, was revised 6 tenths higher to plus 2.2 reflecting in part the upward revision to that month’s nonfarm payroll growth which now stands at a very impressive 298,000. After dipping in the spring, this indicator, despite November’s soft outcome, is now on a seven-month winning streak.

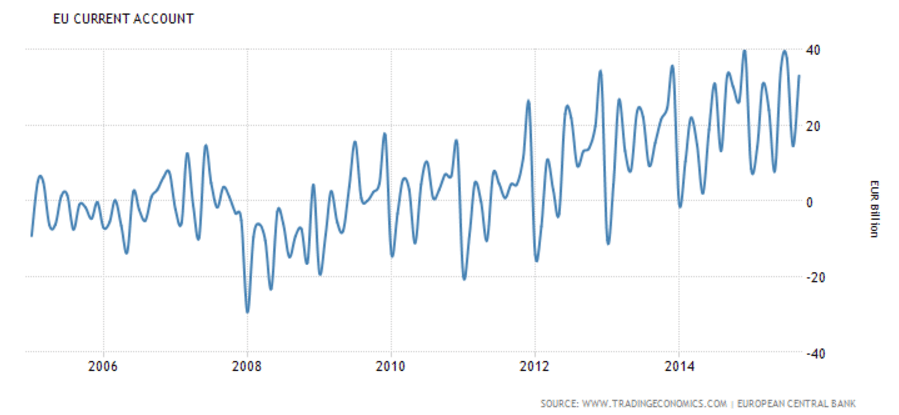
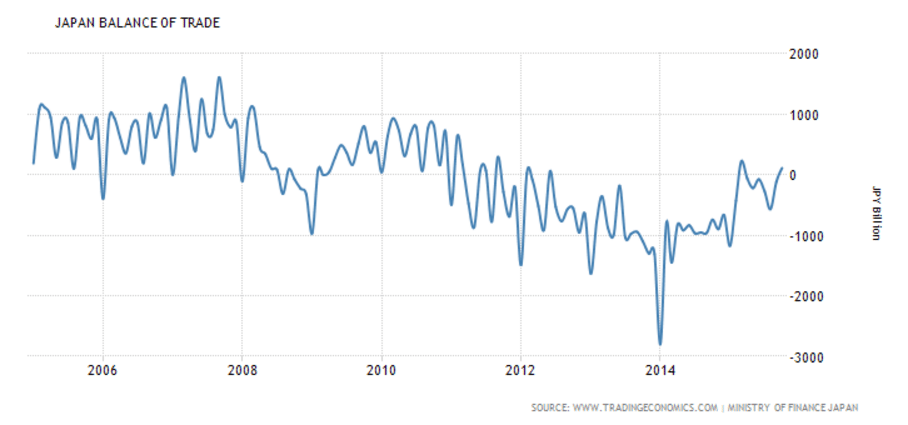
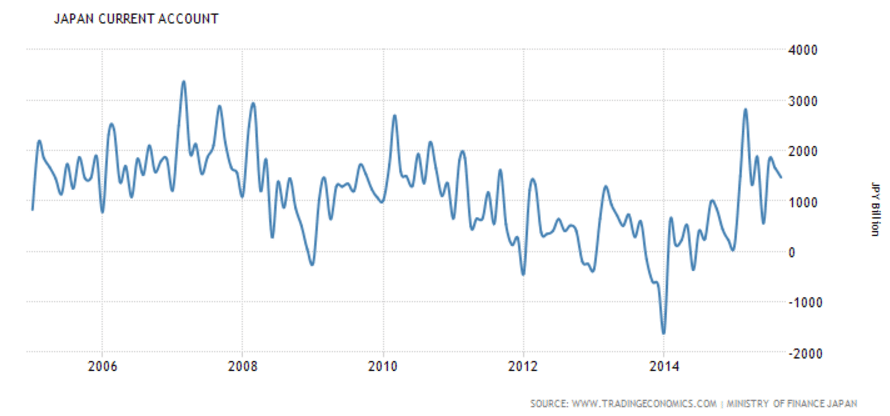
Do you really want to bet against a currency with this kind of trade balance (surplus) and teetering on deflation? Looking like the yen fundamentals used to look when it was the strongest currency in the world, before the tsunami closed the nukes and the surplus turned to deficit? ;)
er-12-7-2
er-12-7-3
er-12-7-4

er-12-7-5
Fed comment:

The Fed uses models that use oil futures as indicators of the future price of oil, so they are currently forecasting a rise in oil prices and therefore a rise in inflation,vwhich feeds into their decision regarding interest rate policy.

Unfortunately, the FOMC doesn’t seem to understand the difference between the analysis of perishable vs non perishable commodities, and therefore they don’t recognize the higher oil futures prices express the cost of storage, rather than an indicator of future spot prices.

CPI, Redbook Retail Sales, Industrial Production, Housing Index, Containers, FHA Capital, EU Car Registrations, Japan

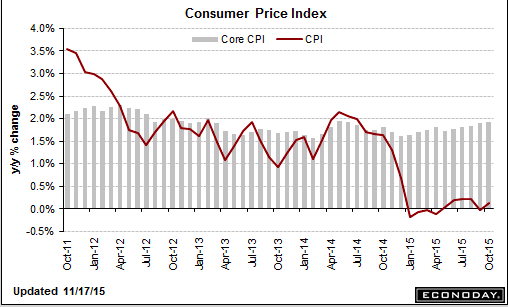
Part of the Fed’s mandate is to hit it’s 2% inflation target:
er-11-17-6
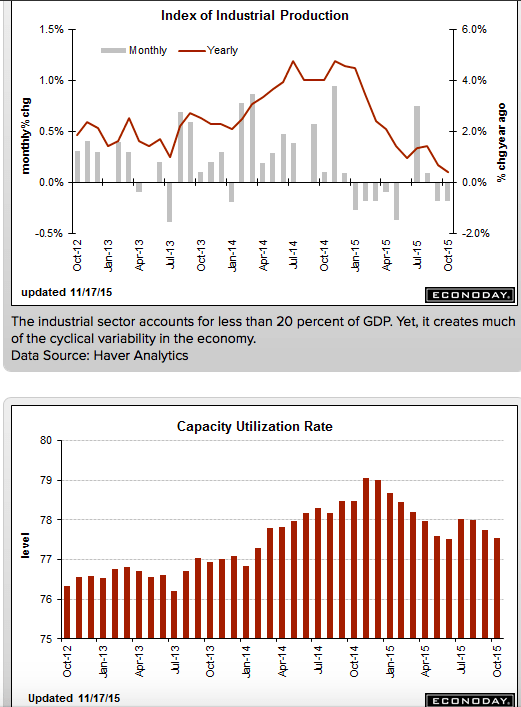
Still at recession type levels:
er-11-17-7
This is also what recession looks like:
er-11-17-8
The anointed ‘driver of the economy’ continues to falter as previously discussed:

Housing Market Index
er-11-17-9
Highlights
The housing market index from the nation’s home builders shows weakness, at 62 for November and missing the Econoday consensus by 2 points. And compared to a revised October, the index is down 3 points. Yet readings in the report, though slowing, remain solid and one important detail is favorable.

Of the report’s three components, future sales are down a sizable 5 points but the level is still in the seventies, exactly at 70. Present sales, which is the most heavily weighted component, fell 3 points to 67, also still a strong level.

The positive in the report is a 1 point rise in traffic, a component which, at 48 in the latest report, has been lagging badly but is getting closer to the breakeven 50 mark. Weakness in this reading has been reflecting lack of first-time buyers in the market.

Turning to regional data, the highest composite score goes to the West, at an enormously strong 77, followed by the South, at 62. Two less watched regions for new homes, the Midwest and North, trail at 59 and 52.

There are positives in this report but the decline in both future and present sales is a reminder that both starts and permits for single-family homes have been slowing. Despite the rise in traffic, this report probably pulls back the housing outlook by a degree.

October 2015 Sea Container Counts Continue to Show Trade Recession Continues

By Steven Hansen

The data for this series continues to be in contraction. The year-to-date volumes are contracting for both exports and imports. The trade sector remains in a recession.

Federal agencies don’t need ‘capital’ to function.

This is simply unspent income that reduces aggregate demand:

FHA Meets Minimum Reserve Requirement for First Time Since 2009

(WSJ) — The Federal Housing Administration, which backs low-down-payment mortgages popular with first-time home buyers, said its insurance fund’s net worth at the end of September was $23.8 billion, up from a year-earlier level of $4.8 billion. Its capital reserve ratio, which by law is required to stay above 2%, rose to 2.07%, the first time it met the threshold since the start of the agency’s 2009 fiscal year. With the private subprime-mortgage market largely gone, the agency offers some of the easiest terms available, letting borrowers with a credit score as low as 580 make a down payment of as little as 3.5%.

Passenger car registrations: +8.2% over ten months; +2.9% in October

(ACEA) — In October 2015, the EU passenger car market continued its upward trend, despite a slower rate of increase (+2.9%), marking the 26th consecutive month of growth. Demand for new passenger cars saw momentum slowing down in all major markets. Registrations in Italy (+8.6%), Spain (+5.2%), Germany (+1.1%) and France (+1.0%) kept growing, even though less strong than in past months, while the UK market declined in October (-1.1%). Across the region, new passenger car registrations totalled 1,104,868 units, also supported by growth in the EU’s new member states (EU-12).

Can’t admit fiscal works and monetary doesn’t:

Abe to call for supplementary budget topping 3tn yen

(Nikkei) — Prime Minister Shinzo Abe will direct the Japanese government to put together a supplementary budget totaling more than 3 trillion yen ($24.2 billion) next week to help shore up a flagging economy. The government is set to compile measures to cope with the Trans-Pacific Partnership trade pact on Nov. 25 and steps for promoting active civic engagement on Nov. 26, with both to be incorporated into the extra budget for fiscal 2015. The prime minister declined to characterize the supplementary budget as a stimulus measure, since doing so could be seen as admitting defeat on Abenomics.

Capital spending delays took toll on July-September GDP

(Nikkei) —Weak capital investment led Japan’s economy to shrink by an annualized 0.8% in the three months ended September. A 1.3% drop in capital investment was the main cause of the decline. Corporations had planned to invest a good deal this fiscal year, though the follow-through has been lacking. Machinery orders, which typically lead capital investment by three to six months, slipped 10% for the July-September quarter. But if the outlook for economic growth overseas remains hazy, more companies could put investment on hold.

Mtg Purchase Apps, Saudi Pricing History, China

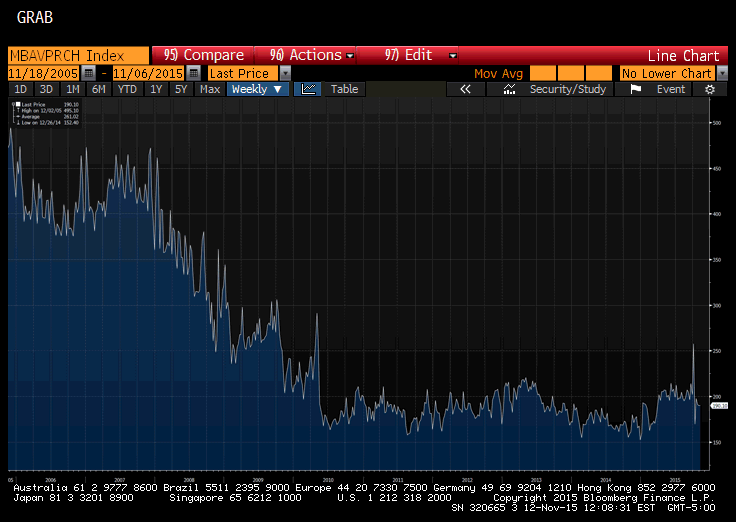
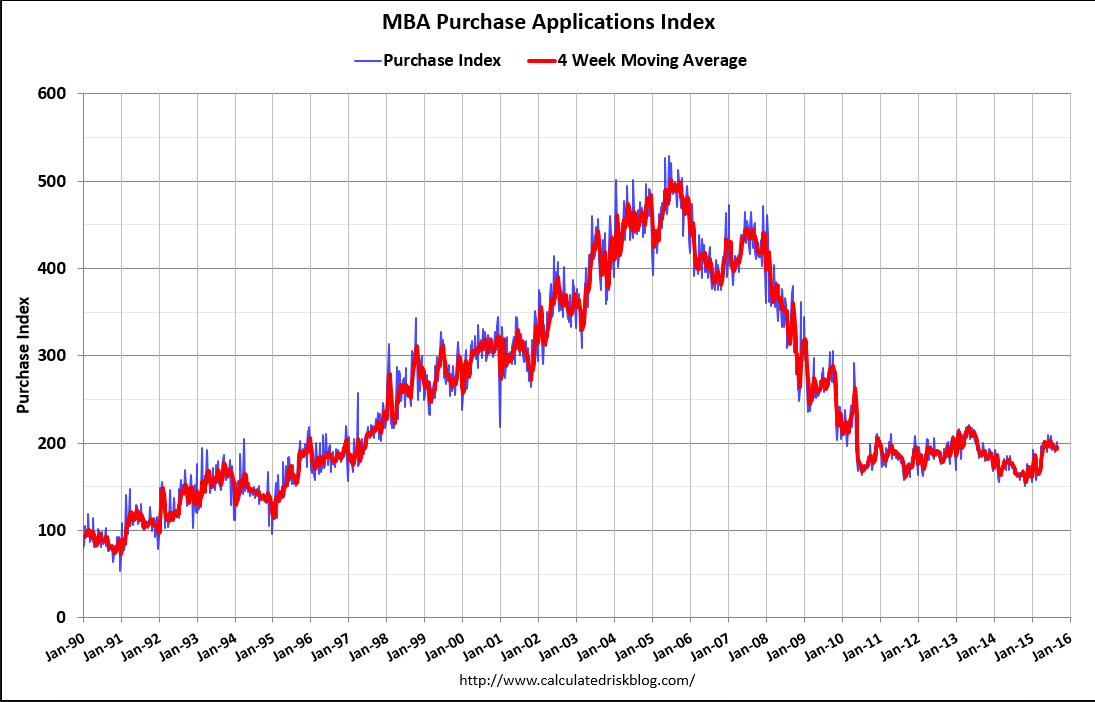
So much for housing leading the way up- looks to have gone from flat to down:

MBA Mortgage Applications
er-11-12-1

sg2015111243711
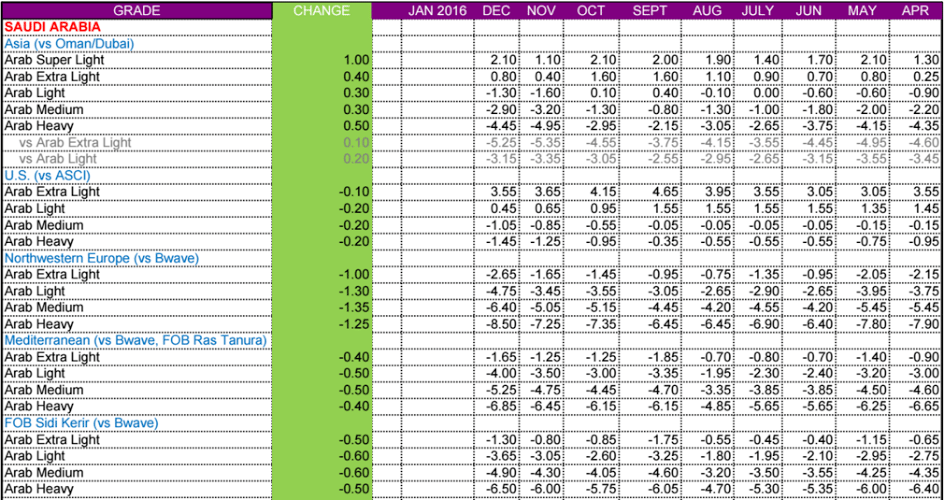
For the most part Saudis have been lowering premiums and increasing discounts which causes prices to fall to get their sales up to their pumping capacity:
er-11-12-2

Not without a bit of pain, which they may have come to believe inevitable due to long term supply/demand dynamics:

Saudi Arabia risks destroying Opec and feeding the Isil monster

(Telegraph) &#8212 The rumblings of revolt against Saudi Arabia and the Opec Gulf states are growing louder. The International Energy Agency (IEA) estimates that the oil price crash has cut Opec revenues from $1 trillion a year to $550bn. US output has dropped by 500,000 b/d since April, but the fall in October slowed to 40,000 b/d. Total production of 9.1m b/d is roughly where it was a year ago when the price war began. A confidential order from King Salman has frozen new hiring by the state, stopped property contracts and purchases of cars, and halted a long list of projects.

We’ll see what this means in actual practice:

Li promises full use of fiscal weapons

(Xinhua) — To lead to a major lift in the nation’s productivity, the government will ensure a steady business environment for all major sectors of the market, the president said. The government will make full use of fiscal policies, reduce taxes properly and help companies to overcome their difficulties and upgrade structure, Li told the meeting. The government will invest more to improve infrastructure in central and western China to achieve balanced development, and private companies are welcome to invest in such projects, Li said.

Healthcare Premiums, UK Gap, EU Credit Growth, Durable Goods, Redbook Retail Sales, Oil

Last I checked this ‘counts’ as ‘personal consumption expenditure’:

Premiums for Health Insurance Bought on Exchanges to Climb in 2016

Oct 26 (WSJ) — The Obama administration said many consumers will see noticeable premium increases when buying health coverage on insurance exchanges in 2016. Federal officials said Monday that the price of the second-lowest-cost midrange “silver plan”—a key metric for premiums around the country—will increase by 7.5% on average across the three-dozen states that rely on Washington to administer the health law for them. And 60% of enrollees—across 30 of the largest markets in the U.S.—will see the average rate for that benchmark plan rise by 6.3%.

Also decelerating since oil prices collapsed:
er-10-27-1
Up off the bottom some but no where near enough to levels historically coincident with lower unemployment, etc:
er-10-27-2
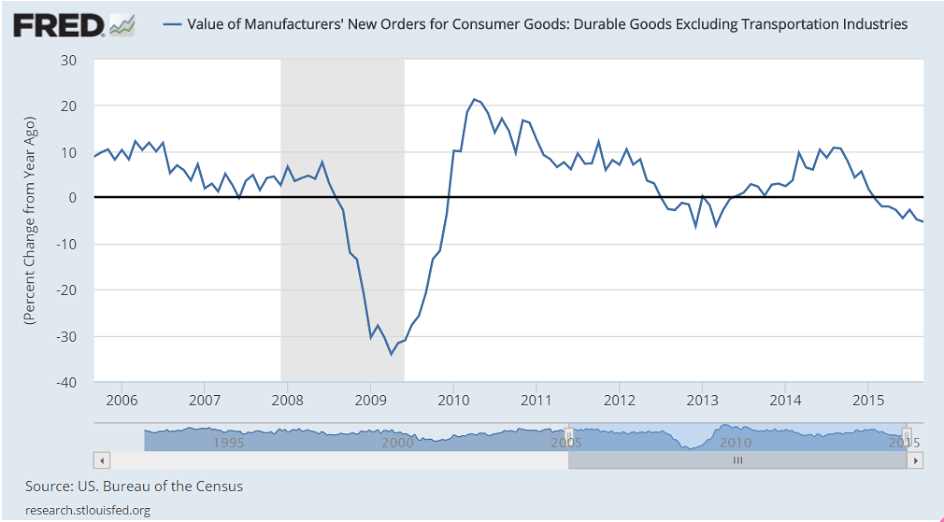
Bad and the prior month revised down, and with employment growth slipping motor vehicles could be hit next:

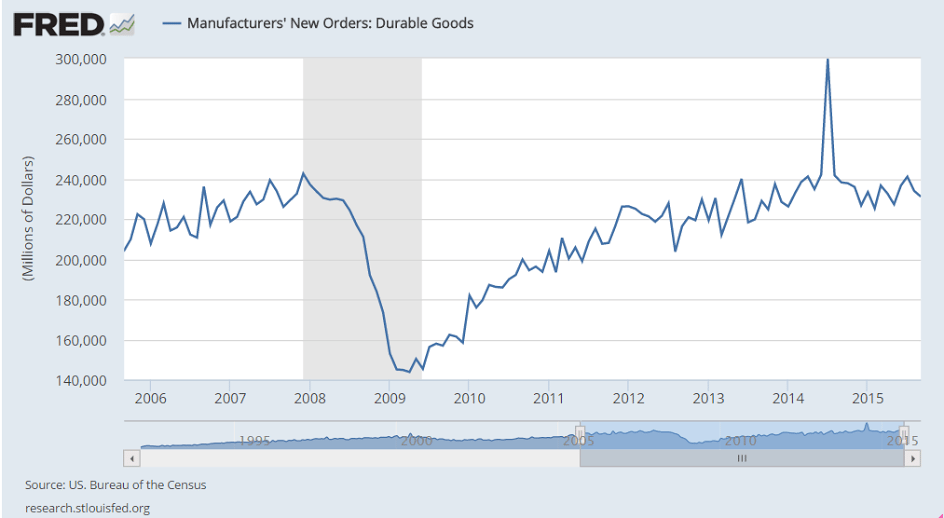
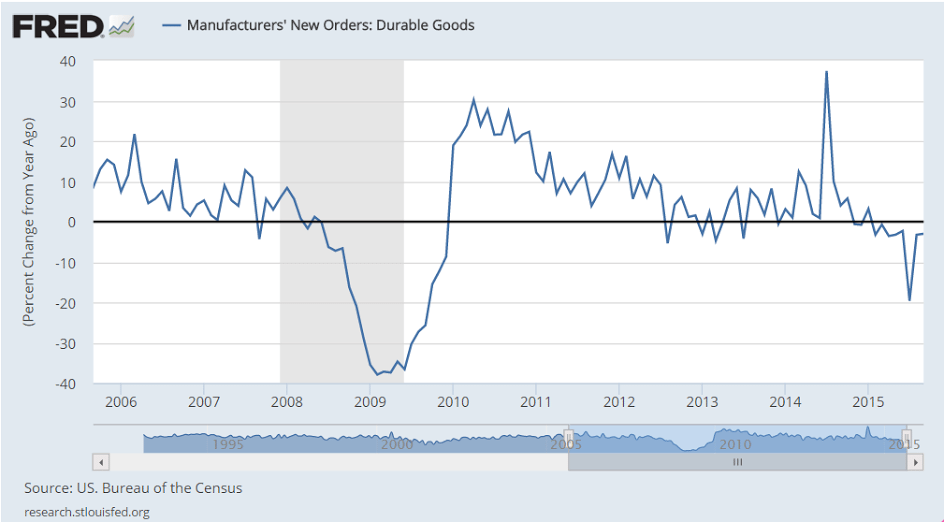
United States : Durable Goods Orders
er-10-27-3
Highlights
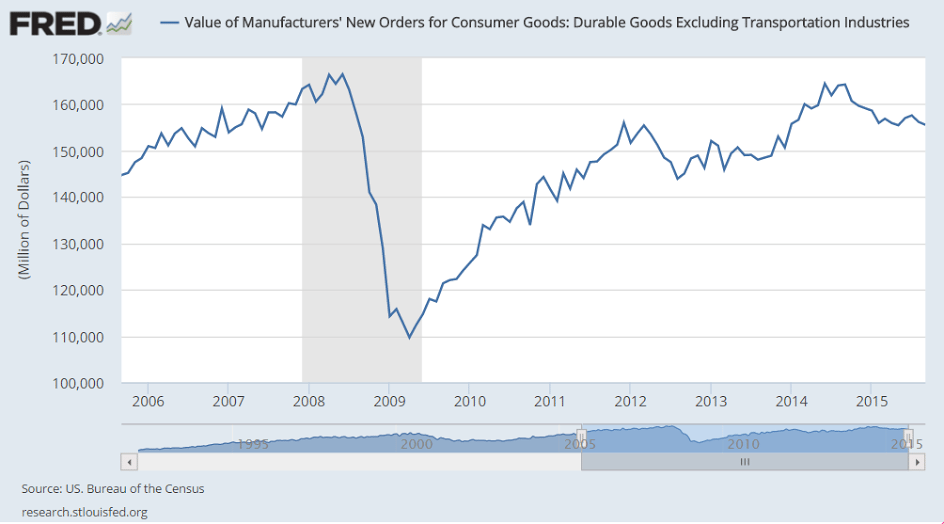
The factory sector is showing cracks with orders contracting slightly more than expected, down 1.2 percent in September with August’s contraction revised lower to minus 3.0 percent. Other readings are likewise weak with ex-transportation down 0.4 percent following a downward revised 0.9 percent decline in August and with core capital goods orders down 0.3 percent after falling a downward revised 1.6 percent in August.

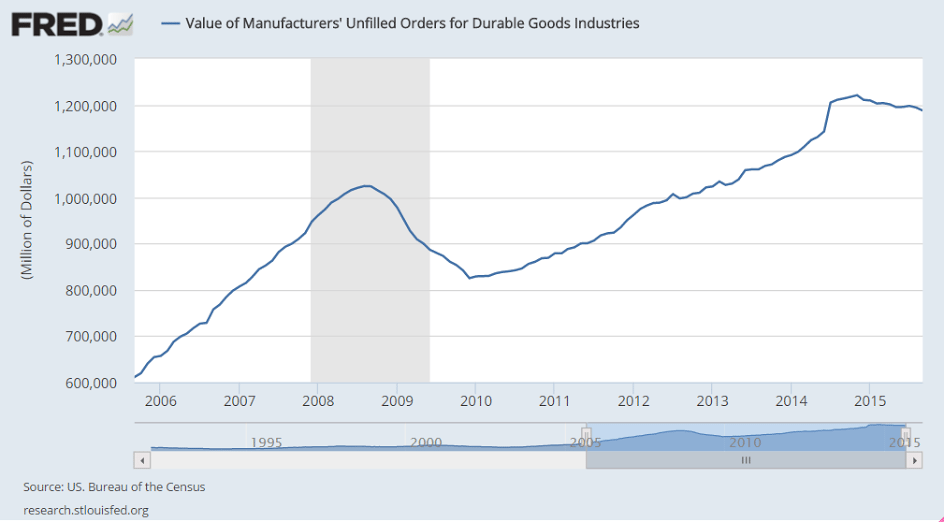
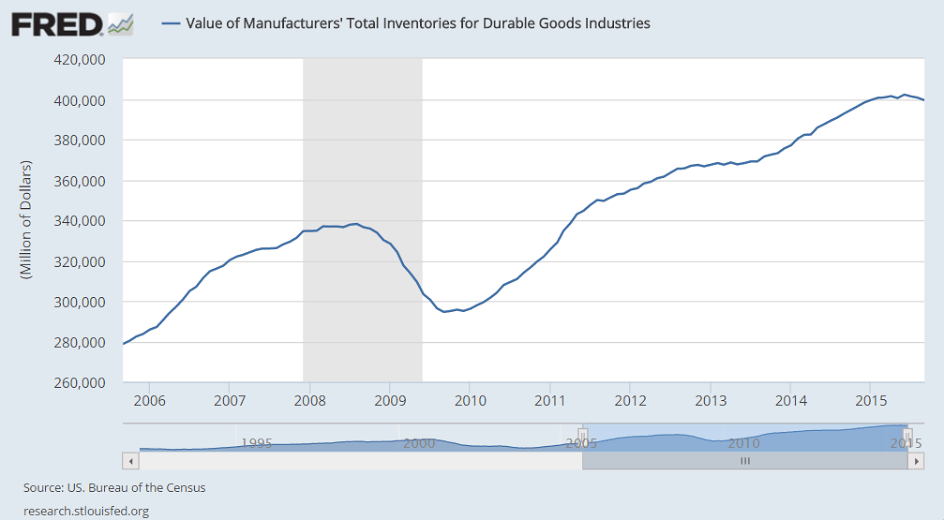
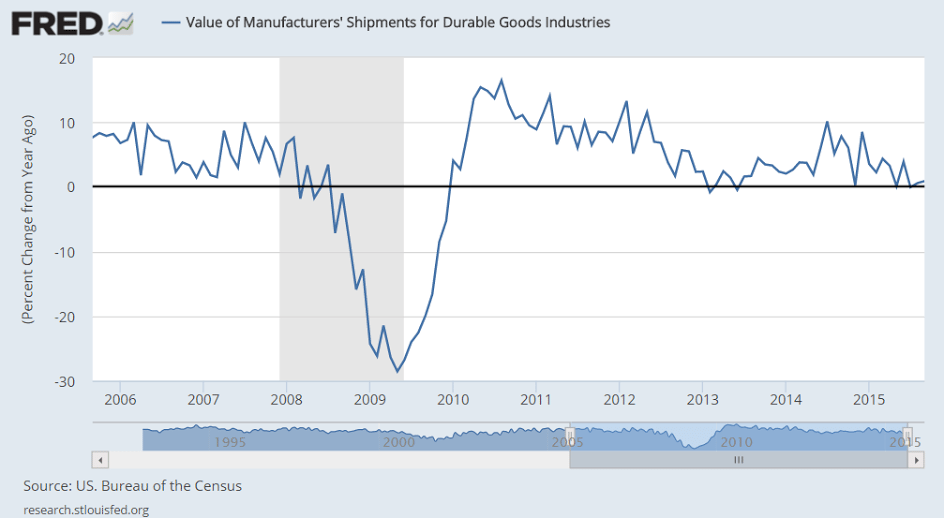
Other readings include a second straight and sharp 0.6 percent decline in unfilled orders and a third straight decline in inventories, down 0.3 percent which is the sharpest decline since May 2013. The decline in unfilled orders suggests that factories, lacking new orders, are working down backlogs while the decline in inventories points to growing caution in the business outlook. But factories are keeping up shipments which is good for GDP, up 0.2 percent after August’s 0.5 percent decline with core capital goods shipments up 0.5 percent after a 0.8 percent decline.

Motor vehicles are a positive in the report, showing a 1.8 percent gain in new orders and a 1.6 percent gain in shipments with both reversing similar sized declines in August. Also positive are electrical equipment and fabricated metals, with both perhaps getting a boost from construction, along with defense aircraft and defense capital goods.

Industries showing declines in new orders include primary metals, machinery, and computers & electronics. Orders for civilian aircraft fell 62 percent in September following a 23 percent decline in August.

This report falls in line with industrial production data where manufacturing in September slipped for the fourth time in five months. Weakness in exports is the balancing factor tipping the factory sector away from growth.

er-10-27-4
er-10-27-5
er-10-27-6
er-10-27-7
er-10-27-8
er-10-27-9
er-10-27-10
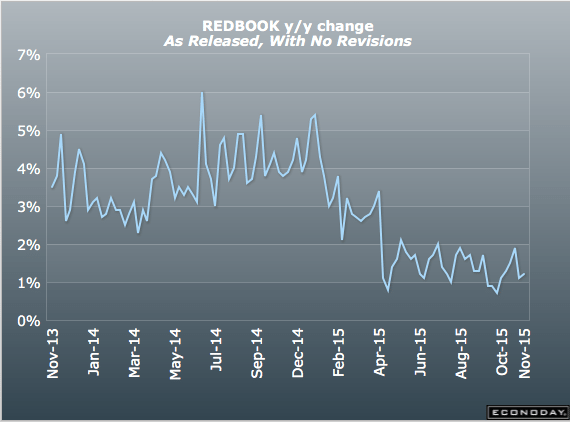
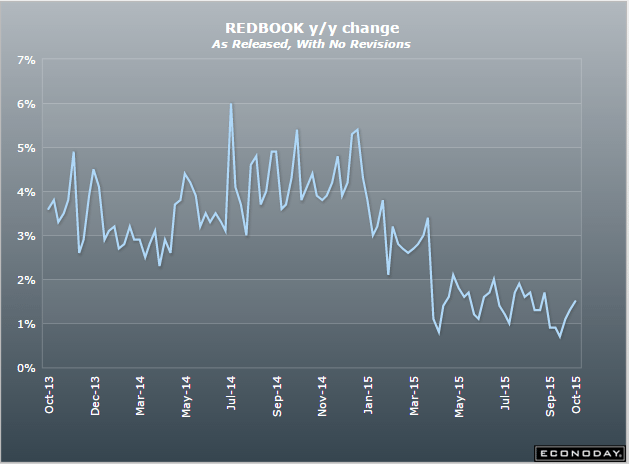
Redbook retail sales still growing at depressed rates:
er-10-27-11
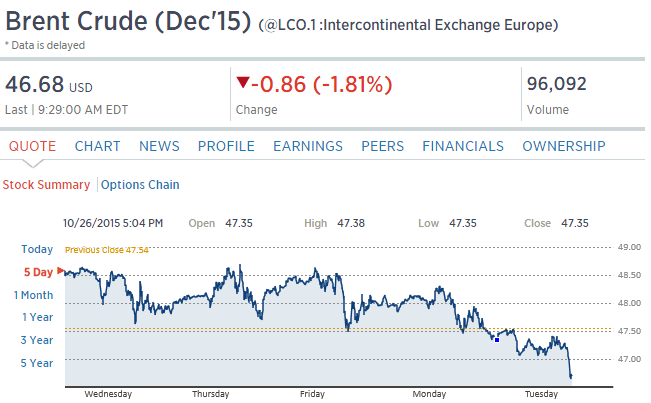
Price continues to fall as the increased Saudi discounts continue:

er-10-27-12

Wholesale Trade, UK Construction, Benefit Checks

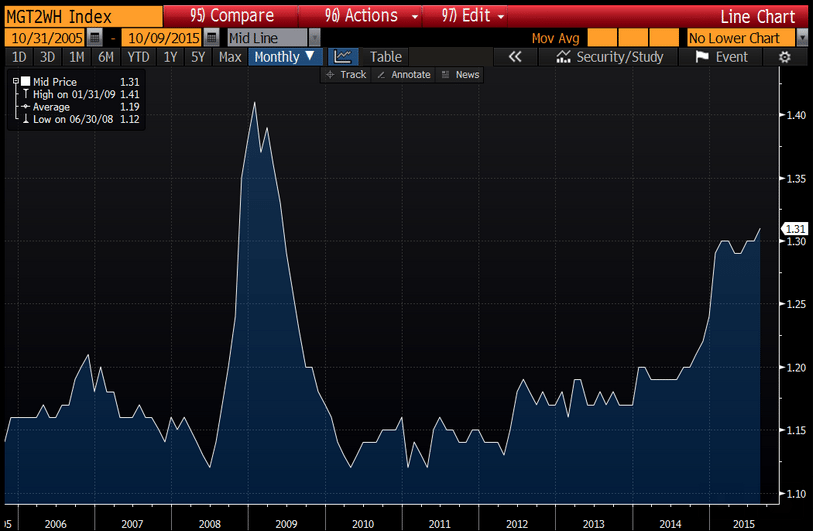
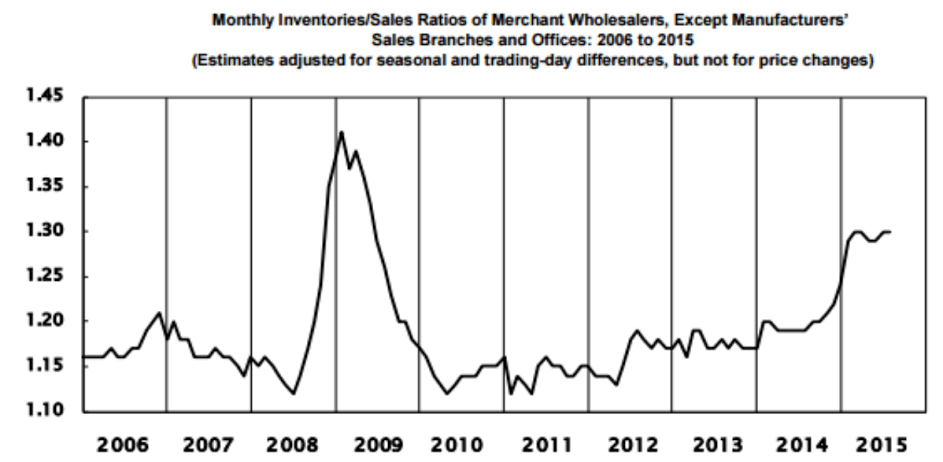
Sales to inventory ratios still looking way high to me, as happens entering a recession:

Wholesale Trade
er-10-9-1

Highlights
Wholesale inventories look to be pulling down on third-quarter GDP, up only 0.1 percent in August following a downwardly revised 0.3 percent decline in July. But relative to sales, which fell 1.0 percent in August and fell 0.3 percent in July, inventories are looking heavy. The stock-to-sales ratio rose to 1.31 in September from July’s 1.30.

Inventories relative to sales rose in autos which is a plus given how strong auto sales proved to be in September. Inventories of machinery also rose but here sales have been uneven and the build might be unwanted. Metals show a large draw on a bounce back for sales.

As far as GDP goes, inventories are looking to have a neutral effect. Businesses are keeping their inventories in check even as sales remain on the slow side. Watch for the business inventories report on Wednesday.

Wholesale Inventories +0.1% in August

U.S. wholesale inventories rose in August, boosted by larger stocks of computers and professional equipment used by businesses. Inventories are a key component of gross domestic product changes. The component of wholesale inventories that goes into the calculation of GDP – wholesale stocks excluding autos -rose 0.1 percent. Inventories for durable goods climbed 0.3 percent, with computers up 1.9 percent. At August’s sales pace it would take 1.31 months to clear shelves, up slightly from 1.30 months in July. An inventory-to-sales ratio that high usually means an unwanted inventory build-up, which would require businesses to liquidate stocks. That in turn could weigh on manufacturing and economic growth.
Inventory to sales ratio:
er-10-9-2
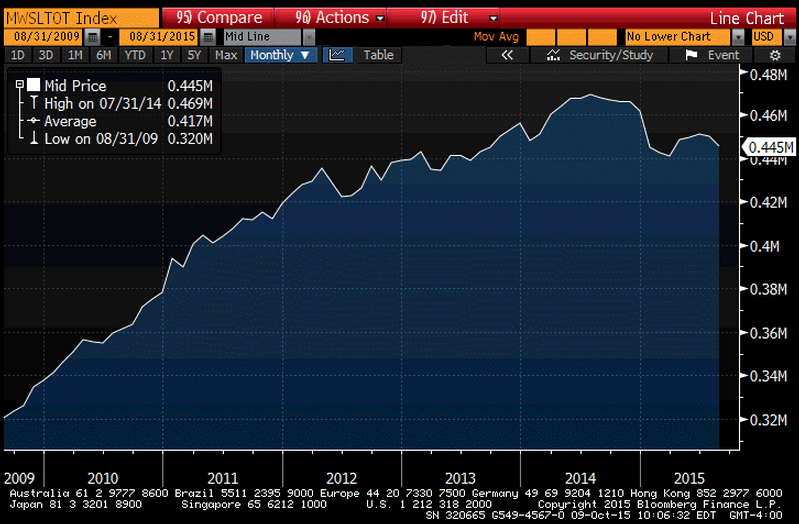
Total sales:
er-10-9-3
er-10-9-4
er-10-9-5

Empire State, Industrial Production, Business Inventories, Retail Sales

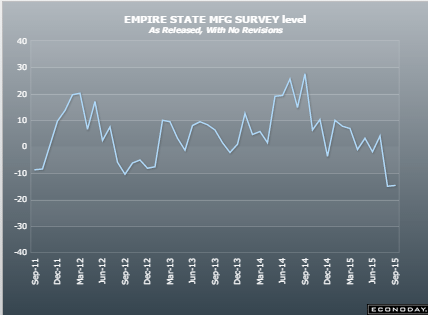
Ugly:

Empire State Mfg Survey
er-9-15-1
Highlights
The shocking weakness in August was no fluke as the Empire State index came in far below expectations for September, at minus 14.67. Next only to August’s minus 14.92, September’s reading is the weakest of the recovery, since April 2009. And, unfortunately, judging by new orders, activity in October may prove to be just as weak. New orders are deeply negative this month, at minus 12.91 vs minus 15.70 in August and the fourth straight negative reading. And manufacturers in the New York region won’t be able to turn to backlogs which are extending their long run of contraction at minus 8.25.

Searching for positives in this report is difficult. Negative signs sweep components including shipments, at minus 7.98 following August’s minus 13.79. If extended to national data, these results point to trouble for third-quarter GDP. Employment is at minus 6.19 which is the first negative reading since all the way back in January 2013. The workweek, reflecting the weakness in shipments, is down very steeply at minus 10.31. Price data show outright contraction for finished goods at minus 5.15 — the first negative reading since November 2013. And rounding things out is a 10 point loss in the 6-month outlook to 23.21 which is the weakest since, once again, January 2013.

The negative signals from this report from August were not confirmed by other regional indications but could be confirmed as early as this morning with the August industrial production report. Strength in the auto sector gave manufacturing a lift in June and July but this lift, given weakness in foreign markets and the energy sector, may not have extended too far, at least based on this report.
er-9-15-2

Bad here too, as excess prior inventory building led to production cuts:

Industrial Production
er-9-15-3
Highlights
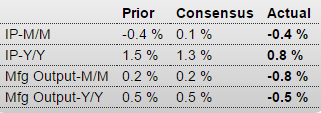
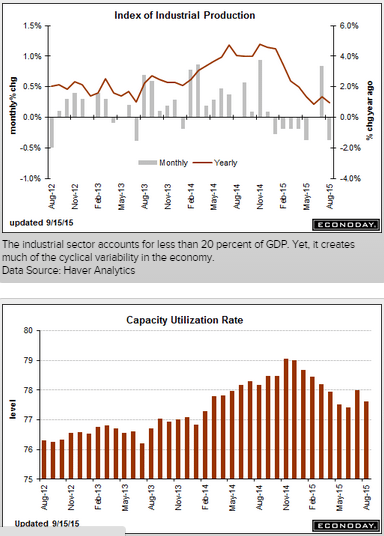
A reversal in the auto sector pulled down industrial production in August, falling 0.4 percent vs the Econoday consensus for a 0.2 percent decline. The manufacturing component fell 0.5 percent, also deeper than the consensus at minus 0.3 percent. In an offset, gains in July proved more robust than initially reported with total industrial production revised 3 tenths higher to plus 0.9 percent and manufacturing revised 1 tenth higher, now also at plus 0.9 percent.

Motor vehicle production is August’s disappointment, down 6.4 percent following July’s giant 10.6 percent spike. When excluding motor vehicle production, however, industrial production was unchanged in August following respectable gains of 0.3 percent in the prior two months. But these readings are far from spectacular and the weakness in the latest month could be a signal of retrenchment tied to Chinese-based volatility.

Turning to the report’s other two components, utility production rose 0.6 percent in August with mining at minus 0.6 percent. Mining, hit by weak commodity prices, has been hurting all year with the year-on-year reading at minus 3.2 percent. Utilities, however, are up 3.2 percent year-on-year which leads the major components as manufacturing’s year-on-year rate is a soft looking plus 1.4 percent. Total industrial production is up only 0.9 percent year-on-year.

This weakness is reflected in capacity utilization which is at 77.6 percent in the August report, down 4 tenths in the month and 2 tenths lower than consensus. Manufacturing utilization is at a soft 75.8 percent vs an unrevised 76.2 percent in July.

The vehicle-led burst in the manufacturing sector faded noticeably by summer’s end, a reminder that foreign demand for U.S. goods is weak and that the domestic energy sector is suffering. The consumer is the lead horse for the economy, making up for factory slack that the doves are certain to cite at this week’s FOMC.
er-9-15-4

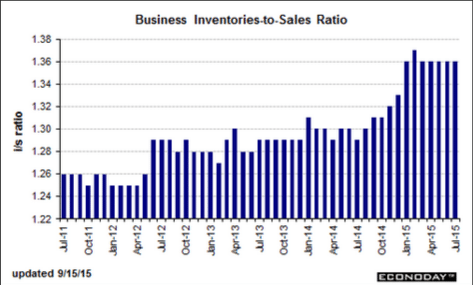
The inventory build was small, but weak sales kept inventory to sales ratio too high.

Note the July inventory build in autos led to the August cutback in production just reported:

Business Inventories
er-9-15-5
Highlights
The nation’s inventories remain slightly on the heavy side, up an as-expected 0.1 percent in July vs a 0.1 percent gain in sales that leaves the stock-to-sales ratio at 1.36, substantially higher than 1.29 a year ago.

Retail inventories rose 0.6 percent in July with the build, however, centered in vehicles which is positive given the strength, evident in this morning’s retail sales report, of strong consumer demand for vehicles. Excluding vehicles, retail inventories rose a manageable 0.2 percent. Building materials rose 0.6 percent which may be a problem given weakness for this component in the August retail sales report. The stock-to-sales ratio for retail is unchanged at 1.46.
er-9-15-6

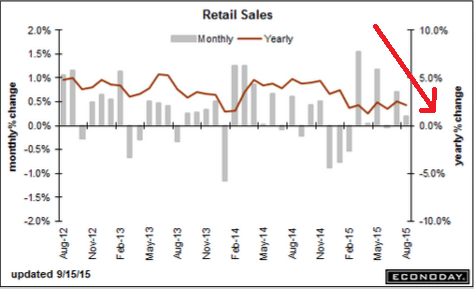
I don’t see this as good news:

Retail Sales
er-9-15-7
Highlights
For a second report in a row, upward revisions highlight solid growth in retail sales. Retail sales rose 0.2 percent in August with ex-auto at plus 0.1 percent and ex-auto ex-gas at plus 0.3 percent. These are all 1 tenth below consensus. July, however, shows broad upward revisions with total sales at a very strong plus 0.7 percent vs an initial plus 0.6 percent. Ex-auto for July is revised upward by 2 tenths to plus 0.6 percent and ex-auto ex-gas revised upward by 3 tenths to plus 0.7 percent.

Turning first to strength in the August data, motor vehicles rose 0.7 percent on top of July’s 1.4 percent gain. These are very solid readings for a very important component that points squarely at a healthy and confident consumer. Restaurants, another component tied to discretionary health, rose a very strong 0.7 percent to extend a run of gains. On the weak side are gasoline stations where, due to lower gas prices, sales fell 1.8 percent. But this decline actually underscores one of the reasons behind the consumer’s health unlike, however, declines in building materials, down 1.8 percent, and furniture, down 0.9 percent. Yet both of these declines follow very strong gains in the prior month.

Taken together, July and August point to a very strong start to the third quarter for the consumer, a fact that plays into the hands of the hawks at this week’s FOMC. Still, the doves can argue that slowing in August could point to negative effects from China-based volatility.
er-9-15-8

Spain, QE chart, Wholesale trade, UK and France industrial production, Import and export prices

Fyi, we will be in Spain next week.

Here are some of the details:

There is a newly formed MMT Group in Spain called APEEP which stands for “Asociación para el Pleno Empleo y la Estabilidad de Precios”.

In an effort to bring MMT into the political debate in Spain, they will be hosting me for a presentation of the Spanish translation of “The Seven Deadly Innocent Frauds of Economic Policy”, starting with a presentation in Madrid on the 14th of September, Valencia on the 15th of September, and Vila-real on the 17th of September.

Here are links for the events, including time/date/location

14th September Madrid
15th September Valencia
17th September VilaReal

And this is the press release for the events containing more details.

Also:

Asociación Para el Pleno Empleo y la Estabilidad de Precios (APEEP) (Association for Full Employment and Price Stability), is a non-profit organization devoted to raising awareness and disseminating Modern Monetary Theory amongst the Spanish public. APEEP believes that full employment and price stability are compatible if public policy is conducted within an MMT framework. The current economic crisis within the Eurozone highlights the need for a Post Keynesian and MMT approach to public policy.

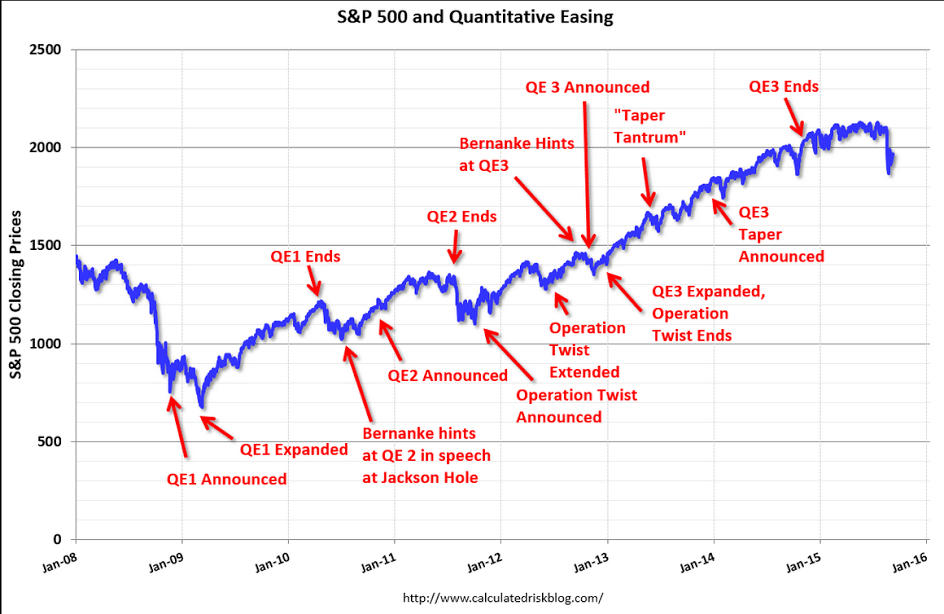
You’d think by now word would be out it’s just a placebo, but ancient beliefs tend to linger on…
er-9-10-1
Not good- sales down and inventories remain elevated:

United States : Wholesale Trade
er-9-10-2

Highlights
Factory inventories held stable in July as did wholesale inventories, down 0.1 percent against a 0.3 percent decline in sales that leaves the stock-to-sales ratio unchanged at 1.30. Wholesale inventories look light for machinery and apparel but heavy for farm products and metals.

The nation’s inventories are heavier than they were last year which may limit future production and hiring. Next data on inventories will be the business inventories report on Tuesday.

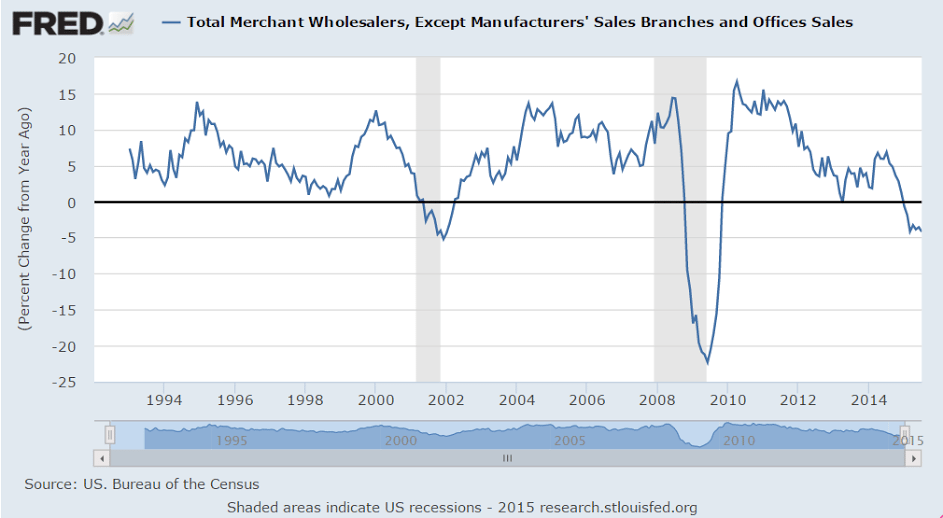
MONTHLY WHOLESALE TRADE: SALES AND INVENTORIES July 2015 Sales. The U.S. Census Bureau announced today that July 2015 sales of merchant wholesalers, except manufacturers’ sales branches and offices, after adjustment for seasonal variations and trading-day differences but not for price changes, were $449.5 billion, down 0.3 percent (+/-0.5)* from the revised June level and were down 4.2 percent (+/-1.4%) from the July 2014 level. The June preliminary estimate was revised upward $1.0 billion or 0.2 percent.

This chart is now looking a lot like prior recessions:
er-9-10-3

Inventories/Sales Ratio. The July inventories/sales ratio for merchant wholesalers, except manufacturers’ sales branches and offices, based on seasonally adjusted data, was 1.30. The July 2014 ratio was 1.19.
er-9-10-4

Great Britain : Industrial Production
er-9-10-5
France : Industrial Production
er-9-10-6
United States : Import and Export Prices
er-9-10-7

None of this is considered the ‘some improvement’ Chairman Yellen was looking for going into the Fed meeting next week…

Mtg purchase applications, UK industrial production, Saudi visit, US budget deficit

Purchase apps came in 41% higher than a year ago, but have been going nowhere for several months and now look to be drifting lower, as in any case they remain at seriously depressed levels:

MBA Mortgage Applications
er-9-9-1
Highlights
After jumping 17.0 percent in the prior week on a rate-related surge in refinancing applications, the refinance index fell back 10 percent in the September 4 week. The purchase index continues to show much less volatility, down 1.0 percent in the week. Rates were little changed in the week with the average 30-year mortgage for conforming loans ($417,000 or less) up 2 basis points to 4.10 percent.
er-9-9-2

Blow up of the last few years. Note the recent decline:
er-9-9-3

Great Britain : Industrial Production
er-9-9-4
Highlights
The UK goods producing sector significantly underperformed expectations in July. Overall industrial production fell 0.4 percent on the month, matching its June decline, while the key manufacturing sector contracted a hefty 0.8 percent, easily eclipsing a 0.2 percent rise last time.

The monthly fall in manufacturing output reflected decreases in seven of the thirteen reporting subsectors. Within this, the steepest drop was posted by basic metals and metals products (5.7 percent), mainly due to weakness in weapons production which can be very volatile and this alone accounted for half of the overall decline. The second largest negative impact came from transportation equipment which subtracted 0.3 percentage points from monthly growth. However, outside of these categories performances were rather better and in particular there was a solid 5.8 percent gain in pharmaceuticals, in part courtesy of surprisingly buoyant export demand.

Total industrial production found some support from a 0.4 percent monthly increase in the volatile mining and quarrying subsector together with rises in electricity, gas, steam and air conditioning (1.3 percent) as well as in water and waste management (0.5 percent).

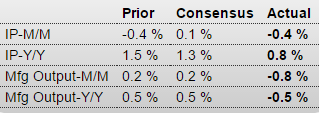
The latest data leave overall goods production in July 0.6 percent below its second quarter average and, on the same basis, manufacturing output down some 0.9 percent. The August manufacturing PMI (51.5) was less than bullish and while last month probably saw kind of a rebound, it looks as if industrial production will not provide much of a boost to real GDP growth this quarter. Whether the Fed tightens or not this month, there is still little pressure on the BoE MPC to hike any time soon.

er-9-9-5

What little growth we do get only tightens the noose further as govt’s net contribution to aggregate demand is further reduced. For 2014 the US economy was supported by oil related capital expenditures that ended when prices collapsed late last year, and so far year I’ve seen nothing stepping up to replace it, apart from increases in unsold inventories and accounting for the new health care premiums as an increase in personal consumption. With the federal deficit now below that of the euro area the rest of the US economy is likely heading in that direction as well:

CBO: Fiscal 2015 Federal Deficit through August more than 10% below Last Year

More good news … the budget deficit in fiscal 2015 will probably decline more than 10% compared to fiscal 2014.

From the Congressional Budget Office (CBO) today: Monthly Budget Review for August 2015

The federal government’s budget deficit amounted to $528 billion for the first 11 months of fiscal year 2015, the Congressional Budget Office estimates. That deficit was $61 billion smaller than the one recorded during the same period last year. Revenues and outlays were both higher than last year’s amounts, by 8 percent and 5 percent, respectively. Adjusted for shifts in the timing of certain payments (which otherwise would have fallen on a weekend), the deficit for the 11-month period decreased by $42 billion.

In its most recent budget projections, CBO estimated that the deficit for fiscal year 2015 (which will end on September 30, 2015) would total $426 billion, about $59 billion less than the shortfall in fiscal year 2014. …
The Treasury will run a surplus in September, and it appears the deficit for fiscal 2015 (ends in September) will be below 2.4% of GDP.

The Treasury will run a surplus in September, and it appears the deficit for fiscal 2015 (ends in September) will be below 2.4% of GDP.

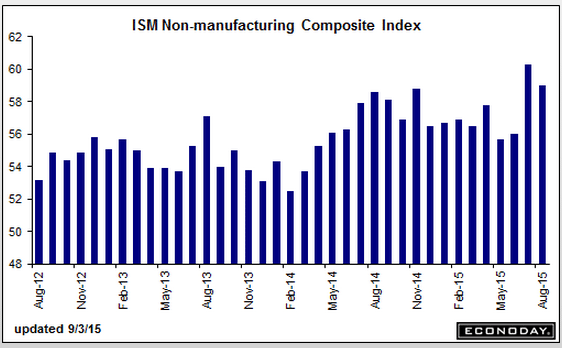
France PMI, Germany PMI, EU PMI, EU Retail Sales, UK service PMI, US Trade, ISM Non Manufacturing, Saudi Pricing

France : PMI Composite
er-9-4-1
Highlights
French private sector activity in August expanded at a significantly slower pace than indicated in the flash report according to the final PMI data for the month. At just 50.2, a 7-month low, the key composite output index was revised down an unusually large 1.1 points versus its preliminary reading to stand 1.3 points below its final July mark and close enough to 50 to signal a period of virtual stagnation in economic activity.
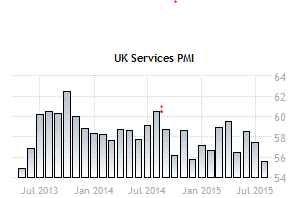
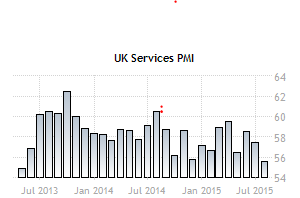
The flash service sector PMI was reduced by 1.2 points to 50.6, also a 7-month trough. As previously indicated, what growth there was reflected stronger new orders and rising backlogs although the growth rate of both hit multi-month lows. Certainly firms were not confident enough to add to headcount although, rather surprisingly, business expectations still climbed to their highest level since March 2012.

Meantime, another increase in input costs saw margins squeezed still further as service provider charges continued to fall.

The final PMI figures suggest that the French economy was really struggling last month. Total output was only flat in the April-June period and the survey data so far suggest little better this quarter.

Germany : PMI Composite
er-9-4-2
Highlights
August’s flash composite output index was revised up a full point to 55.0 in the final data for the month. The new level was 1.3 points above July’s final reading, a 5-month high and strong enough to indicate a solid performance by the economy in mid-quarter.

The adjustment to the composite output gauge came courtesy of the service sector for which the preliminary PMI was revised some 1.3 points firmer to 54.9, also its best reading in five months. New orders rose strongly, backlogs were up and employment posted its largest gain since February. Against this backdrop, business expectations for the year ahead climbed to a 4-month peak.
What little progress they continue to make will evaporate with a strong euro, which I see as inevitable given their trade surplus:

European Union : PMI Composite
er-9-4-3
Highlights
The final composite output index for August weighed in at 54.3, a couple of ticks stronger than its flash estimate and 0.4 points above its final July mark.

The flash services PMI was nudged just 0.1 points higher but, at 54.4, now matches June’s 4-year high. Increased output was supported by rising new orders and a sizeable increase in backlogs which, in turn, helped to ensure that employment growth remained respectably buoyant. Firms also became more optimistic about the economic outlook and business expectations for the year ahead climbed higher following July’s 7-month low. Meantime, inflation developments were mixed. Hence, although higher wages and salaries prompted another rise in input costs, margins were squeezed further as service provider charges declined for a remarkable forty-fifth consecutive month.

Regionally, the best performer in terms of the composite output measure was Ireland (59.7) ahead of Spain (58.8) and Italy (55.0 and a 53-month high). Germany (55.0) also had a good month but France (50.2 and a 7-month low) all but stagnated and remains a real problem for Eurozone economic growth.

The final PMI figures suggest that the Eurozone economy is on course for something close to a 0.4 percent quarterly growth rate in the current period, a slight improvement on the second quarter’s 0.3 percent rate. While this would be good news, faster rates of expansion will likely be needed if inflation is to meet the ECB’s near-2 percent target over the central bank’s 2-year policy horizon.

European Union : Retail Sales
er-9-4-4
Highlights
Retail sales were slightly weaker than expected in August but with July’s decline more than halved, annual growth of purchases still comfortably exceeded the market consensus. Volumes were 0.4 percent firmer on the month after a 0.2 percent drop in June for a workday adjusted yearly rise of 2.7 percent, up from 1.7 percent last time.

July’s monthly rebound was led by a 0.8 percent jump in purchases of auto fuel and without this, non-food sales were just 0.1 percent higher having only stagnated in June. Food recorded a 0.2 percent advance. As a result, overall sales in July were 0.3 percent above their average level in the second quarter when they also increased 0.3 percent.

Regionally the advance was dominated by a 1.4 percent monthly jump in Germany. Spain (0.6 percent) also made a positive contribution but France (minus 0.2 percent) saw its first decline since March. Elsewhere, there were solid gains in Estonia (2.5 percent), Malta and Portugal (both 1.1 percent) but Slovakia (minus 0.2 percent) struggled.

Growth of retail sales has slowed in recent months, in keeping with signs that consumer confidence may have peaked, at least for now. According to the latest EU Commission survey, household morale improved slightly in August but still registered its second weakest reading since January. Consumption may continue to rise over coming months but the signs are that its contribution to real GDP growth will be only limited.
er-9-4-5

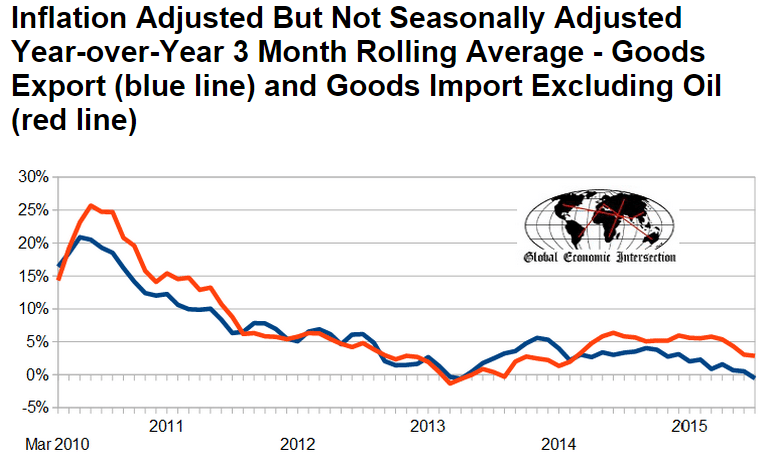
I’ve been suggesting exports would slow more than what’s been reported so far, though year over year numbers are in decline. It may show up in revisions down the road:
er-9-4-6

er-9-4-7

International Trade
er-9-4-9

Highlights
The nation’s trade gap narrowed to a nearly as expected $41.9 billion in July following an upward revised gap of $45.2 billion in June (initially $43.8 billion). The improvement reflects a monthly rise of 0.4 percent in exports, which were led by autos, and a 1.1 percent contraction in imports that reflected a decline in pharmaceutical preparations and cell phones which helped offset a monthly rise in imports of oil where prices were higher in July.

Aside from autos, exports of industrial supplies, specifically nonmonetary gold, were strong in July while exports of capital goods also expanded. This helped offset a monthly decline in exports of civilian aircraft and consumer goods. Turning again to imports, other details include a rise in capital goods in what is the latest sign of life for business investment.

By nation, the gap with China widened slightly, to an unadjusted $31.6 billion in the month, while the gap with the EU widened more substantially to $15.2 billion, again unadjusted which makes month-to-month conclusions difficult. Gaps with Mexico and Canada both narrowed.

This report is another positive start to the quarter and will lift early third-quarter GDP estimates. But these will be cautious estimates as recent market turbulence pushes back conclusions and will make August’s trade data especially revealing.

Lower but still indicating ok expansion:
er-9-4-1

Saudi price setting adjustment:

Aramco Cuts All October Crude Pricing to U.S., Northwest Europe

By Anthony DiPaola

Sept 3 (Bloomberg) — Saudi Arabia, the world’s largest crude exporter, cut pricing for all October oil sales to the U.S. and Northwest Europe and reduced the premium on its main Light grade to Asia by 30 cents a barrel.

State-owned Saudi Arabian Oil Co. cut its official selling price for October sales to Asia of Arab Light crude to 10 cents a barrel more than the regional benchmark, the company said in an e-mailed statement. The discount for Medium grade crude for buyers in Asia widened 50 cents to $1.30 a barrel less than the benchmark.

Brent, a global oil benchmark, fell almost 50 percent last year as Saudi Arabia and other OPEC members chose to protect market share over cutting output to boost prices. Brent fell from over $100 a barrel in July 2014 to less than half that six months later. It traded at about $50 on Thursday.

The Organization of Petroleum Exporting Countries led by Saudi Arabia decided on June 5 to keep its production target unchanged to force higher-cost producers such as U.S. shale companies to cut back. The producer group has exceeded its target of 30 million barrels a day since May 2014.

Saudi Arabia reduced production in August to 10.5 million barrels a day, the first decline this year, according to data compiled by Bloomberg.

Existing home sales, Philadelphia Fed survey, Nat gas

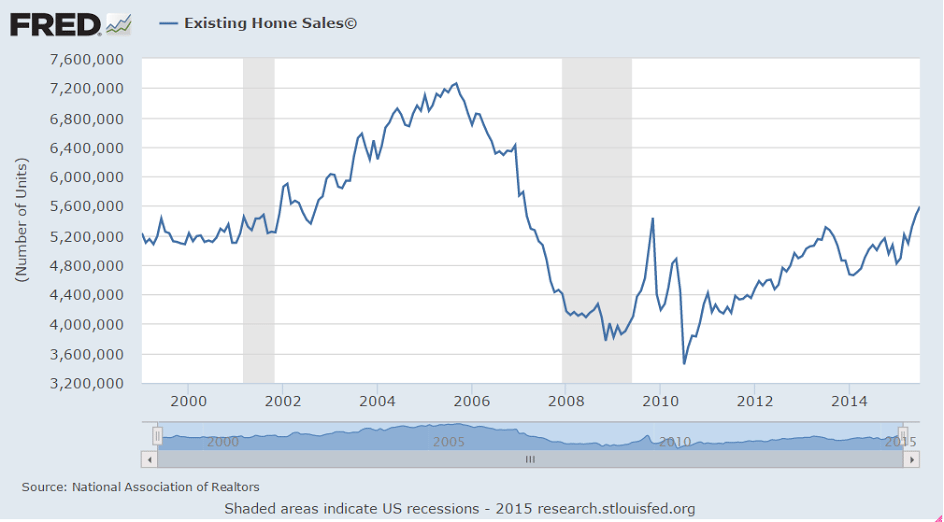
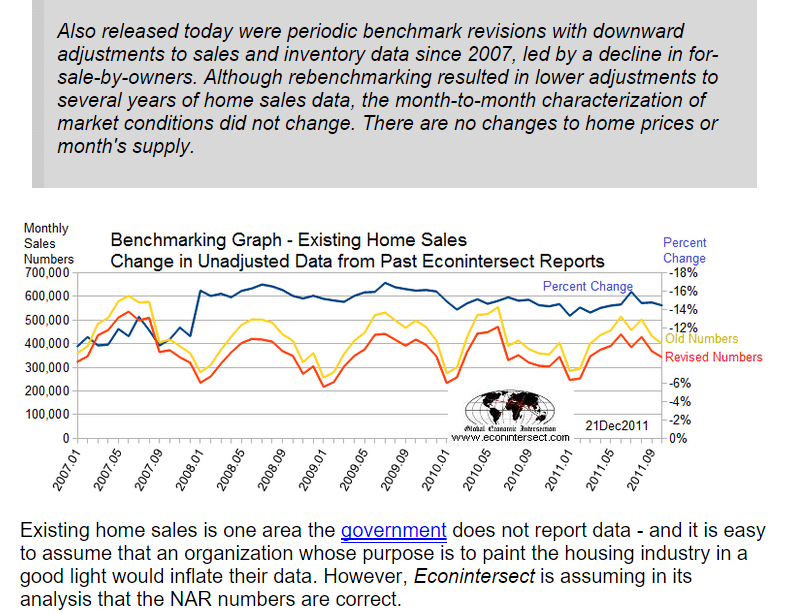
More existing home are turning over, however look at the downward revisions in the last chart. And while prices may be up, they still haven’t reached replacement value as evidenced by the lack of new construction and most recently the sharp decline in permits after the run up in front of NY’s tax break that expired June 15. It is also likely some buying has been accelerated out of fear of rates going higher:

Existing Home Sales
er-8-21-1
Highlights
There’s plenty of life in the housing sector with existing home sales up a stronger-than-expected 2.0 percent in July to a 5.59 million annual rate. And demand is well ahead of supply which is very thin, at 4.8 months at the current sales rate vs 4.9 and 5.1 in the two prior months and 5.6 months in July last year. Sales are up 10.3 percent year-on-year, well ahead of the median price which, at $234,000, is up 5.6 percent. This mismatch, especially with thin supply, hints at pricing power ahead.

Single-family homes lead the report, up 2.7 percent in the month at a 4.960 million annual rate. Condos, where demand on the new home side is soaring, actually fell 3.1 percent in the month to a 630,000 rate. Year-on-year, sales of single-family homes are up 11.0 percent with condos at plus 5.0 percent.

By region, July’s strength is centered in the South with a gain of 4.1 percent. The West follows at plus 3.2 percent with the Midwest unchanged and the Northeast down 2.8 percent. Year-on-year, sales are very evenly balanced with all right at the 10 percent mark.

The balance of this report is impressive, pointing to a rising tide of strength across housing which, given spotty performances by the factory and consumer sectors, looks to be the leading driver for the second-half economy.
er-8-21-2
er-8-21-3

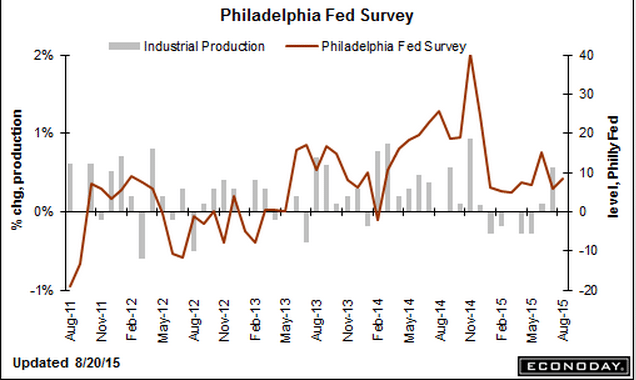
Philadelphia Fed survey remains low:

Philadelphia Fed Business Outlook Survey
er-8-21-4
Highlights
That sigh you hear is one of relief, that Monday’s historic plunge in the Empire State report is probably a fluke. The Philly Fed’s index, which is very closely watched, posted a gain for August and not a huge plunge. The general business conditions index came in at a stronger-than-expected 8.3 vs July’s 5.7. Shipments lead the report at a very strong plus 16.7. Order data show less strength, with new orders at 5.8 in August vs 7.1 in July and with unfilled orders showing a slight month-to-month decline at minus 1.0. A positive in the report is a respectable monthly gain for employment to 5.3 vs July’s contraction of minus 0.4. The 6-month outlook is also a plus, up 1.6 points to a solid 43.1. The early view on the August factory is thankfully mixed. Watch tomorrow for the manufacturing PMI flash.
er-8-21-5

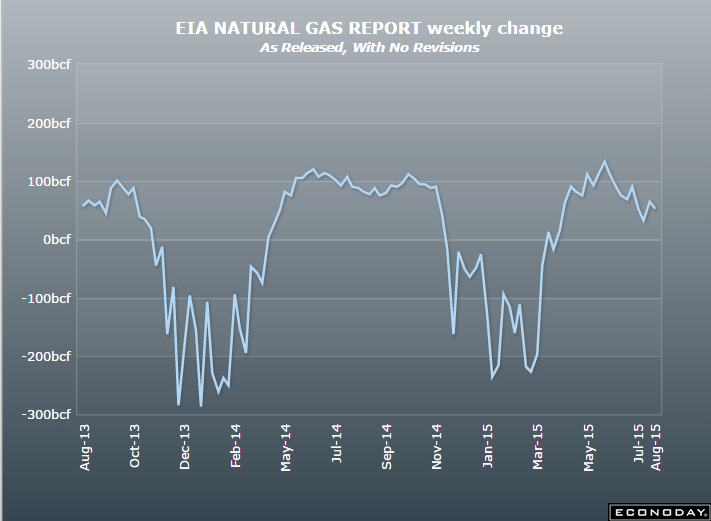
The natural gas inventory build was less than expected, perhaps indicating a fall off in production as maybe 30% of new gas production was a by product of shale oil production, which has begun to fall off after the drilling rigs in service fell off over 50% due to price declines.
er-8-21-6