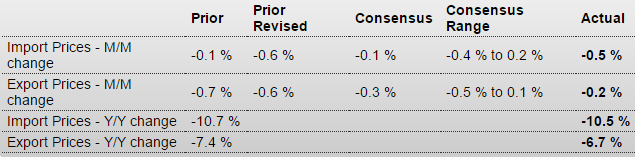
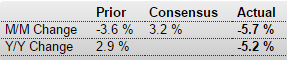
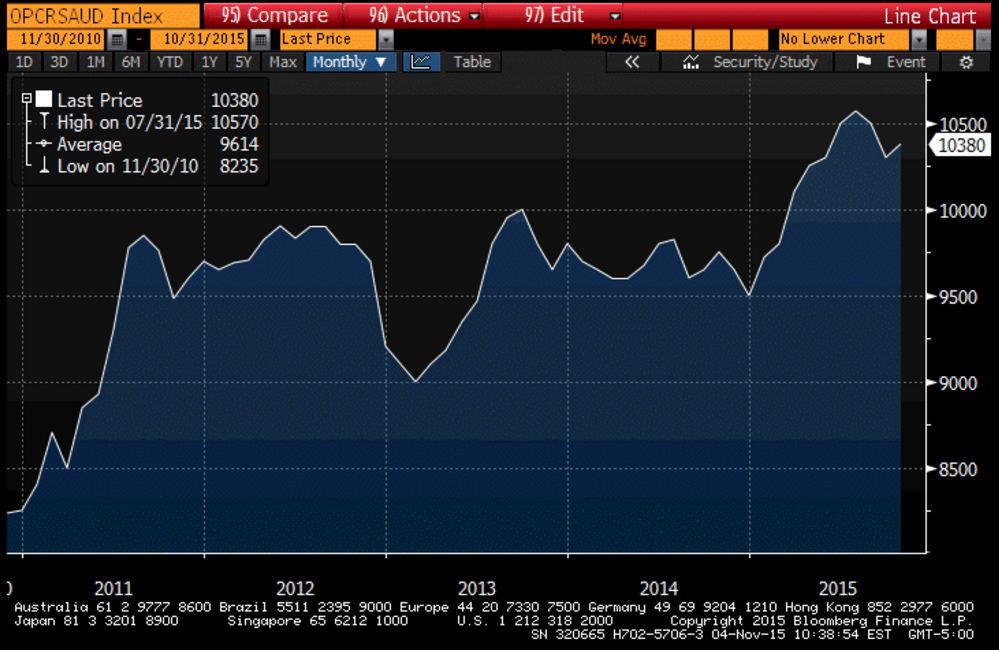
If the Saudis are looking to pump more seems they have to continue to lower prices:
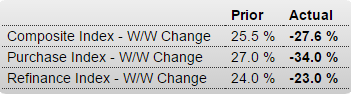
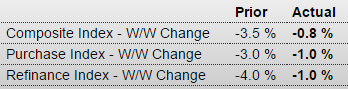
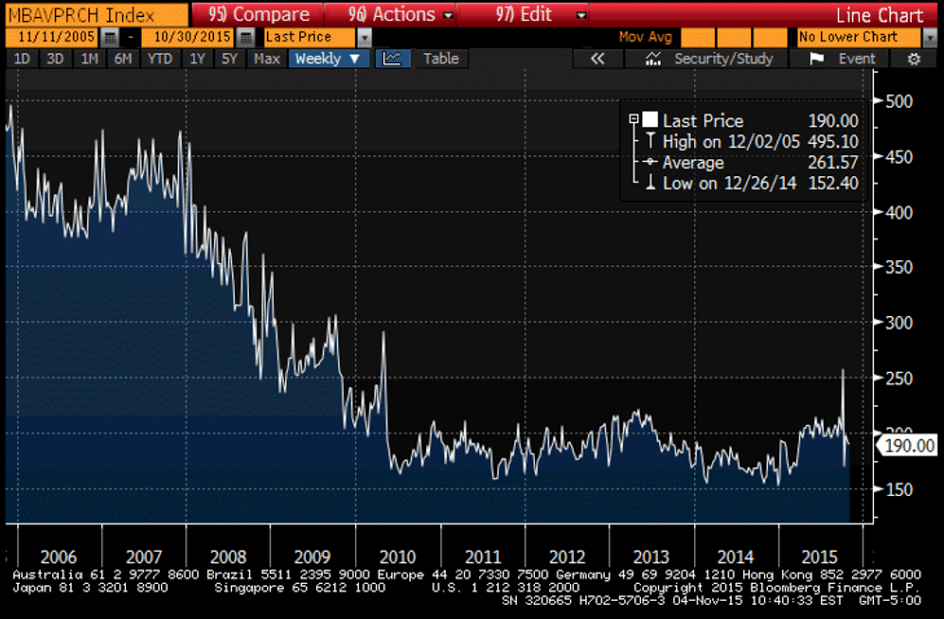
Sure looks like housing still can’t get out of its own way:
MBA Mortgage Applications
Highlights
Mortgage applications are settling down after spiking and dipping sharply in volatility tied to new disclosure rules put in place last month. Both the purchase and refinance indexes fell an incremental 1.0 percent in the October 30 week with the purchase index up a very solid 20 percent year-on-year. Rates were mixed in the week with the average 30-year fixed mortgage for conforming loans ($417,000 or lower) up 3 basis points to 4.01 percent.
NY ISM company specific business report:
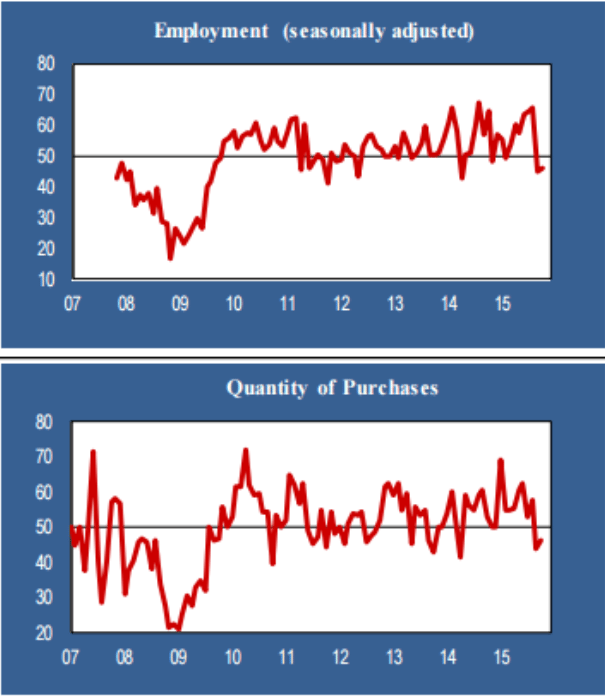
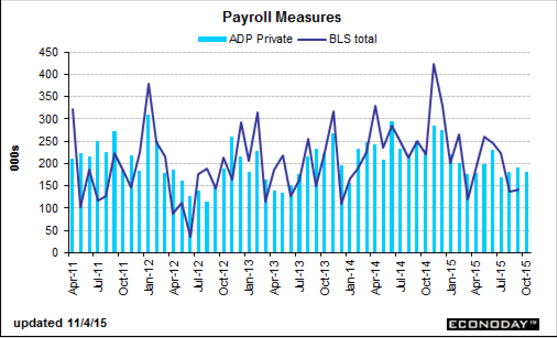
Still working it’s way lower. This is a forecast for Friday’s BLS payroll number:
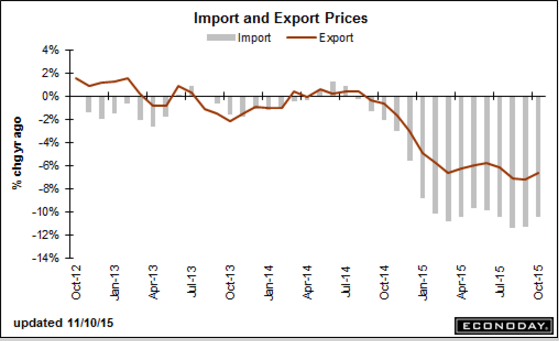
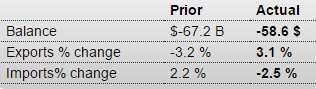
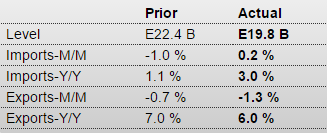
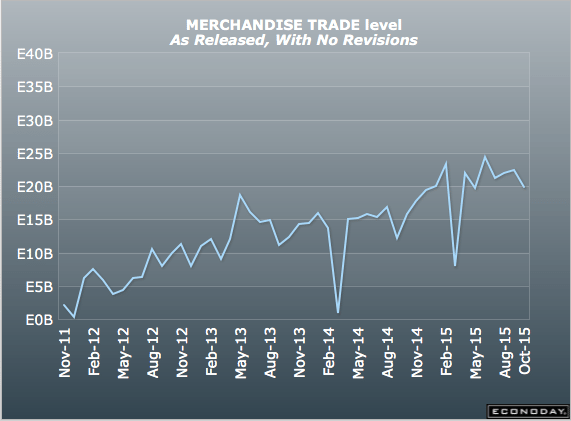
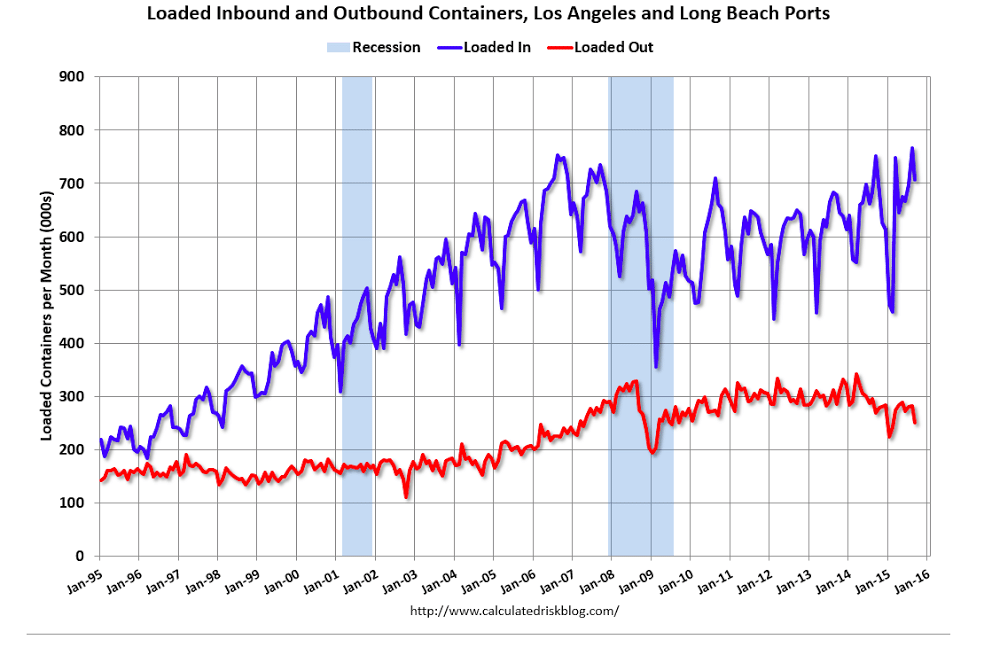
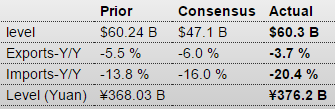
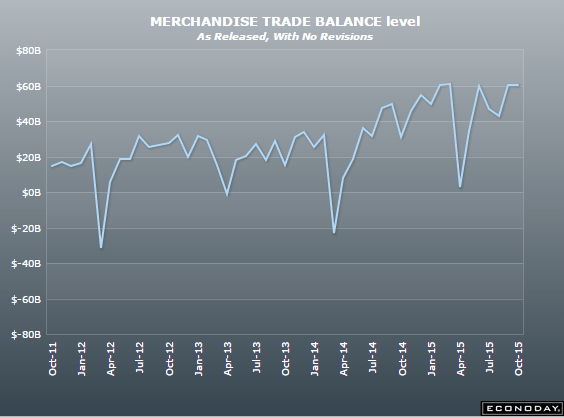
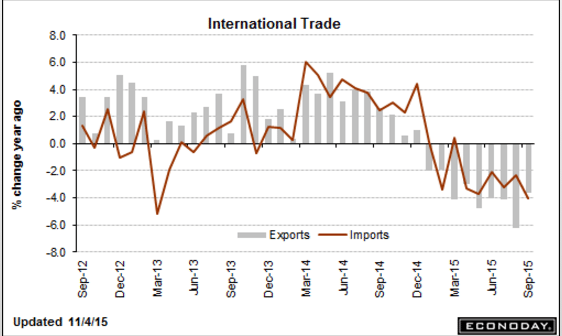
This is a September report. I expect a drop in exports for October and an increase in imports as oil imports increase in line with domestic production declines:
International Trade

Highlights
September’s trade deficit came in very near expectations, at $40.8 billion vs the Econoday estimate for $41.1 billion. August’s unusually large deficit is revised slightly lower to $48.0 billion. September’s goods gap came in at $60.3 billion vs last week’s advance estimate of $58.6 billion. This is offset in part by a $19.5 billion trade surplus in services that is slightly smaller than the August surplus.
Exports were solid in the month, up 1.6 percent and led by consumer goods that include artwork and jewelry. Exports of capital goods were also higher, all helping to offset a decline in exports of industrial supplies. Imports fell 1.8 percent with wide declines led by industrial supplies including crude oil followed by capital goods then autos.
The gain in exports is a positive of course and comes despite soft foreign demand which, for U.S. goods and services, is made softer by strength in the dollar. The dip in imports is good for the GDP calculation but isn’t a positive indication for domestic demand, especially given what is a favorable effect from the strong dollar.
PMI Services Index

Highlights
Growth in Markit’s U.S. service sector sample is slowing slightly, coming in at a final 54.8 vs the flash reading of 54.4 and vs September’s final reading of 55.1. Details are soft with growth in new business at its slowest pace since January and with backlogs down for a third straight month.
Weakness in orders in turn is pulling down 12-month expectations which are near July’s three-year low. Employment is described as modest with hiring at its slowest pace since February. Price readings are mute.
Despite the soft details, the service sector is still humming along solidly and helping to offset weakness in manufacturing.
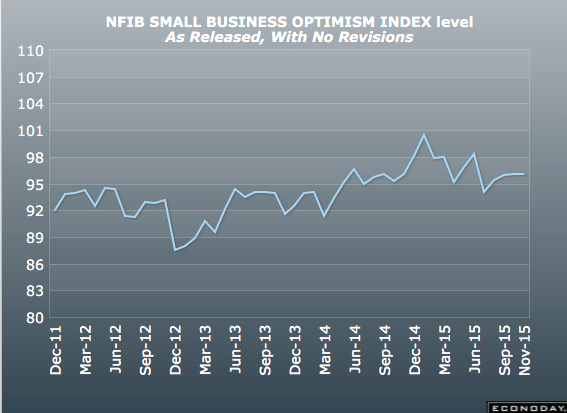
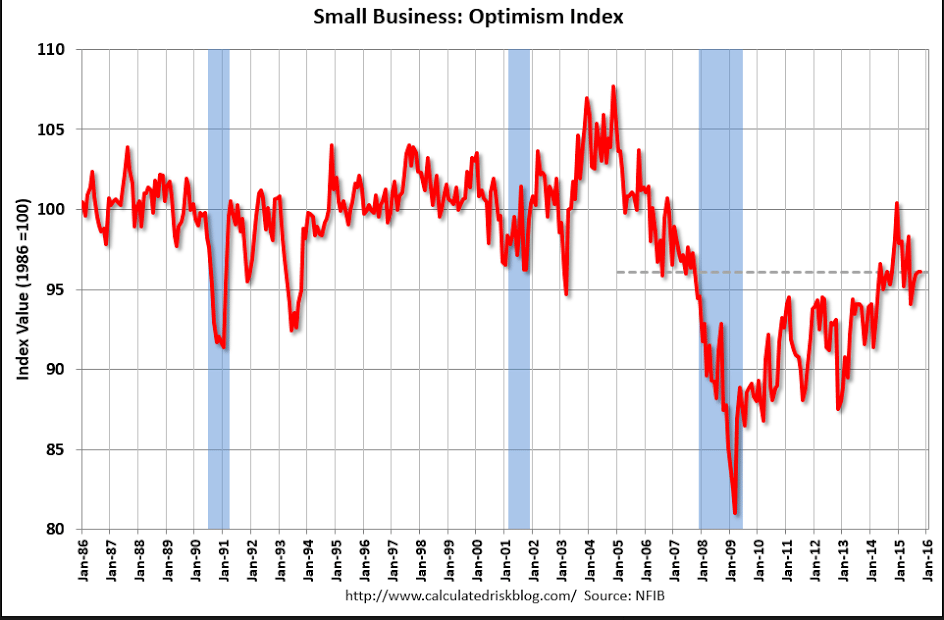
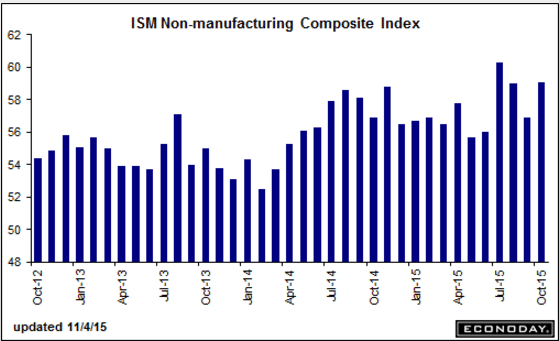
The overall weakness in the economy began with the oil price and oil capex collapse about a year ago, and while this indicator is off it’s July highs, it seems to be holding firm, at least for now:
ISM Non-Mfg Index

Highlights
ISM’s non-manufacturing index continues its searing pace, rising nearly 2-1/2 points to a much higher-than-expected 59.1 which exceeds Econoday’s high-end forecast by more than 1-1/2 points. Orders are robust with new orders up more than 5 points to 62.0 and backlogs unchanged at 54.5 which is very strong for this reading. Export orders are also strong, up 2 points to 54.5 and underscoring the strength of the nation’s services surplus as seen in this morning international trade report. But the highlight of the report, ahead of Friday’s employment data, is a nearly 1 point rise in the employment index to 59.2 which is one of the very strongest readings in the history of the report.
Strength is distributed broadly across industries led by transportation & warehousing, health care & social assistance, and professional, scientific & technical services, the latter a center of strength for foreign demand. The two non-service industries covered in this report are mixed with construction rising but mining, hit by low commodity prices, the only industry to report contraction in the month.
Many readings in this report are near records and follow similar readings in July and August which were also unusually strong. This report has been a consistent upside outlier but it undeniably hints at strength for employment and at a December FOMC rate hike.
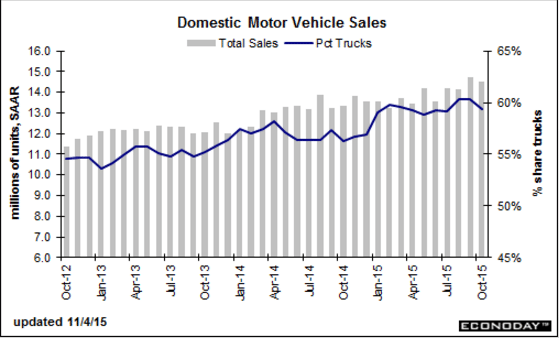
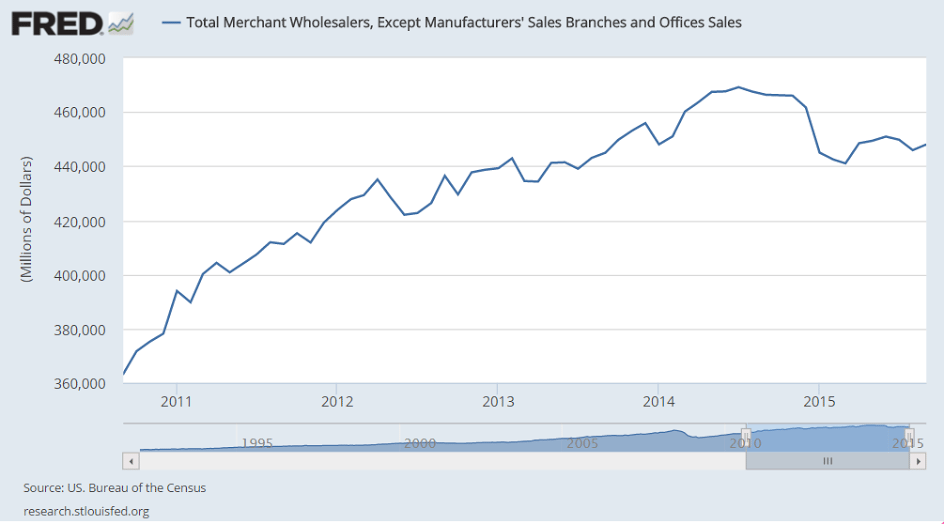
Good sales month but check out the import numbers, which don’t count for GDP:
Motor Vehicle Sales
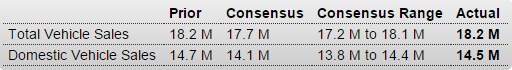
Highlights
Consumers really showed up in October, at least when it came to dealerships as vehicle sales held unchanged at an 18.2 million annual rate, a 12-year high and outside the Econoday top-end estimate. Import sales, specifically sales of imported light trucks, were the key to October, rising to a 3.7 million rate from 3.5 million and making up for a downtick in sales of North American-made vehicles which slipped to 14.5 from 14.7 million. Still, the 14.5 million rate is also outside the top-end estimate.
These data offer convincing evidence of consumer strength and pull forward, at least to a degree, the Fed’s rate liftoff. But the results, because they do no better than match September, do not quite point to a third straight gain for the motor vehicle component of the October retail sales report.
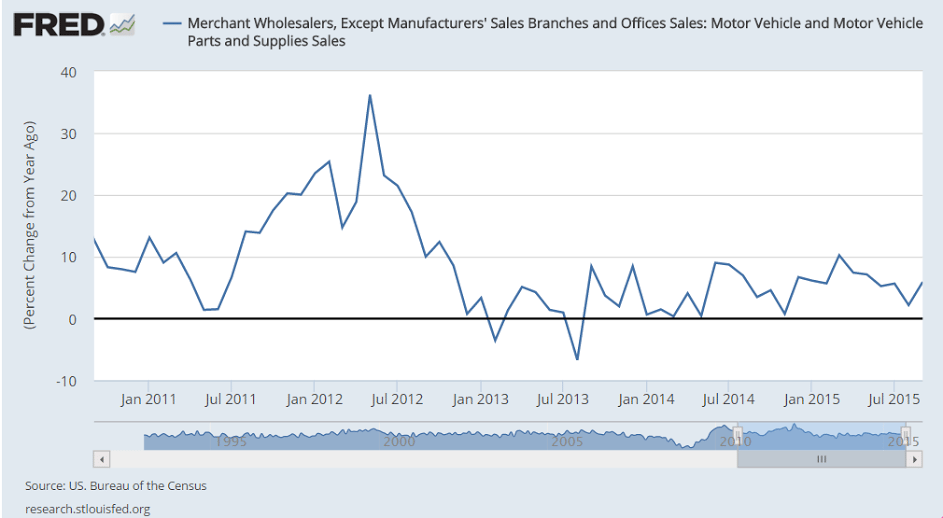
Domestic sales fell some: