euro area trade, housing comments, consumer prices

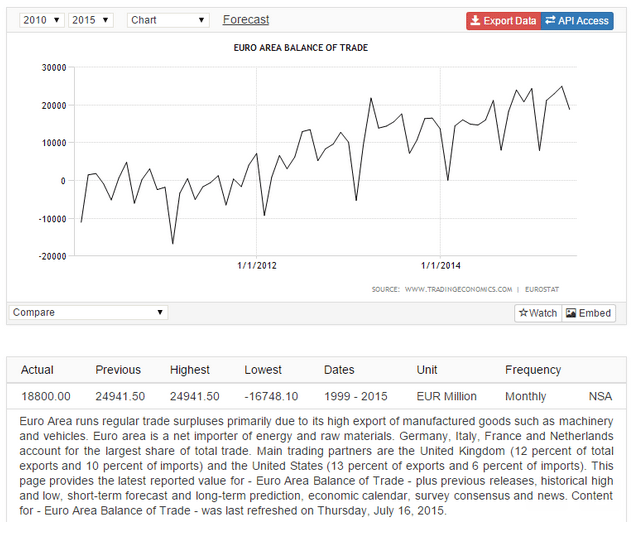
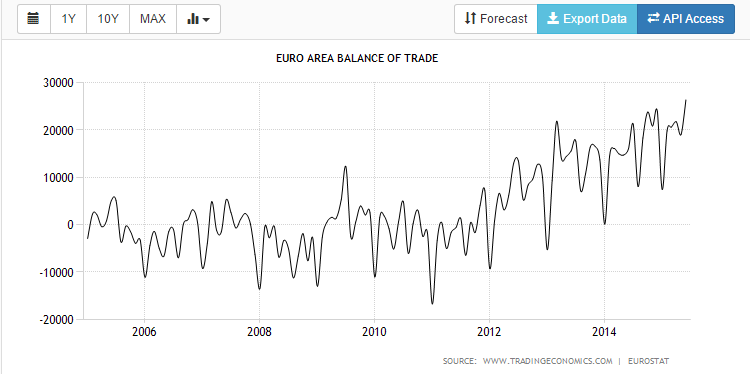
Continues very strong. This is for member using the euro:
er-8-19-6

Size of New Homes in U.S. Shrinks by One Closet

By Kris Hudson

Aug 18 (WSJ) — Of the 206,000 homes that went under construction in the second quarter, the median size was 2,479 square feet. That was 40 square feet smaller—or about the size of a walk-in closet—than the high set in the first quarter. The National Association of Home Builders estimates that first-time buyers, who tend to purchase entry-level homes, will account for 18% of new-home sales this year. That is up from 16% last year but still well short of their share of 25% to 27% from 2001 to 2005. Then, quarterly median sizes for new homes ranged from 2,051 to 2,263 square feet.

Maybe reduced value conflicts between boomers and their kids vs boomers and their parents are contributing to keeping kids at home?

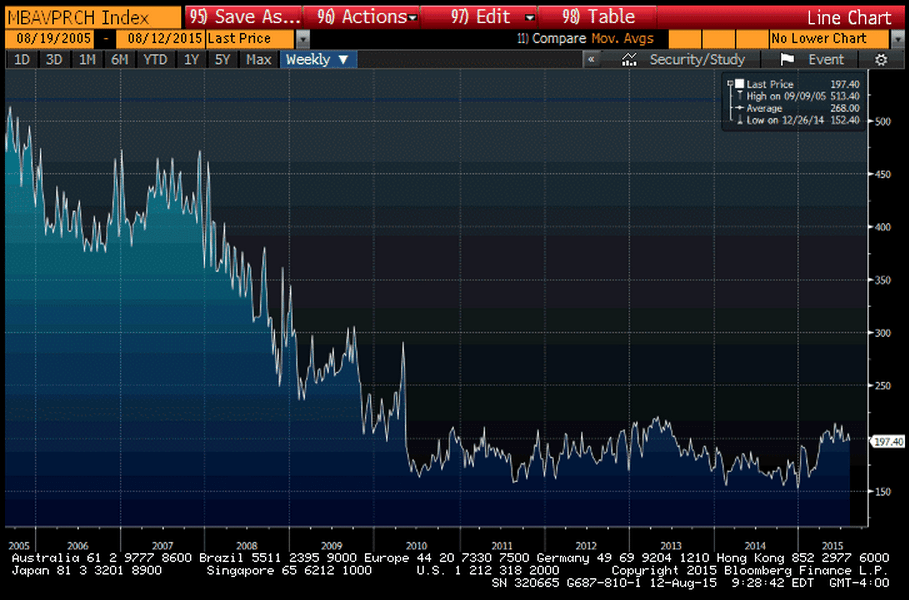
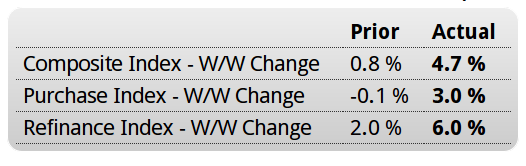
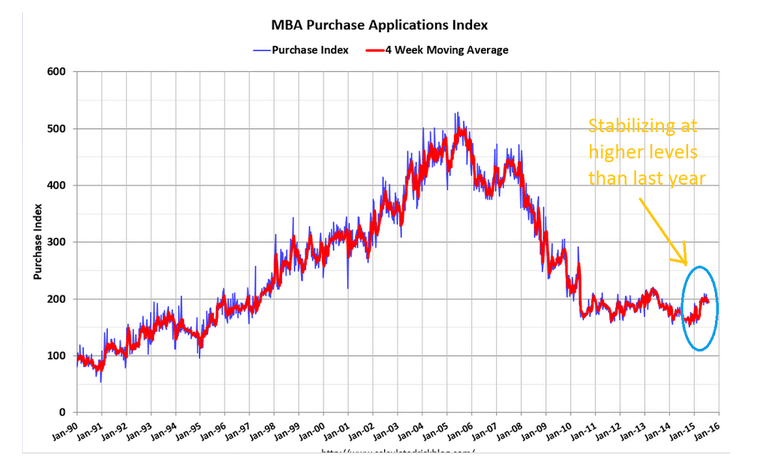
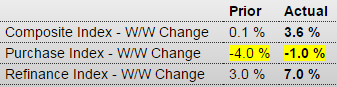
No improvement in purchase apps here. Been largely flat for the last several months now:

MBA Mortgage Applications
er-8-19-7
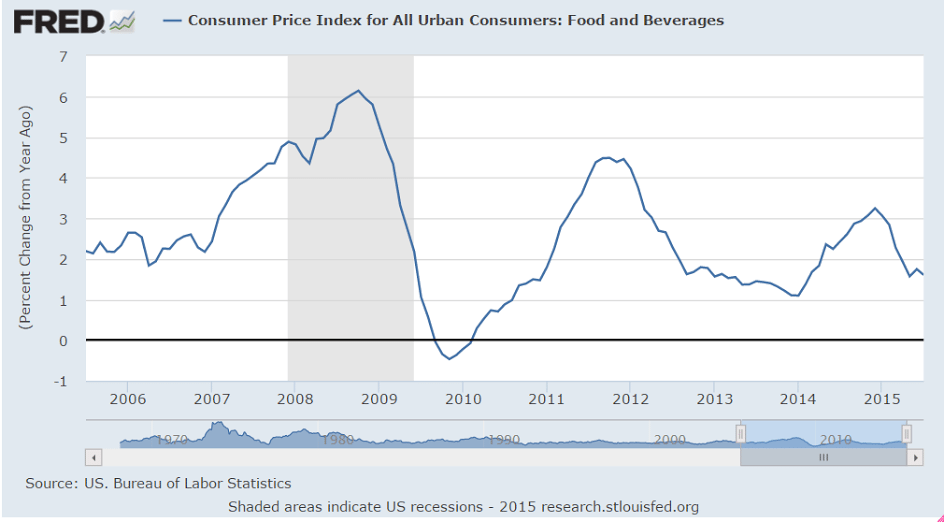
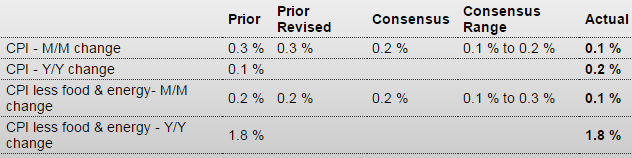
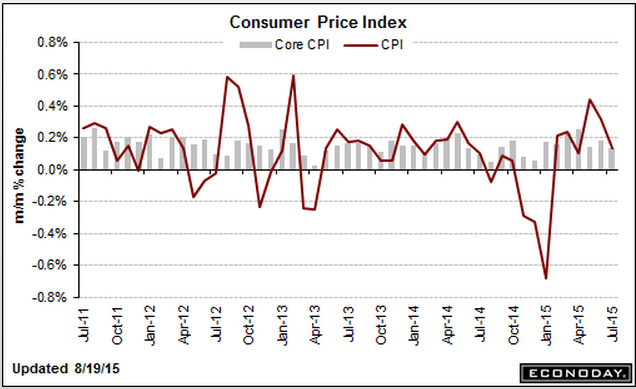
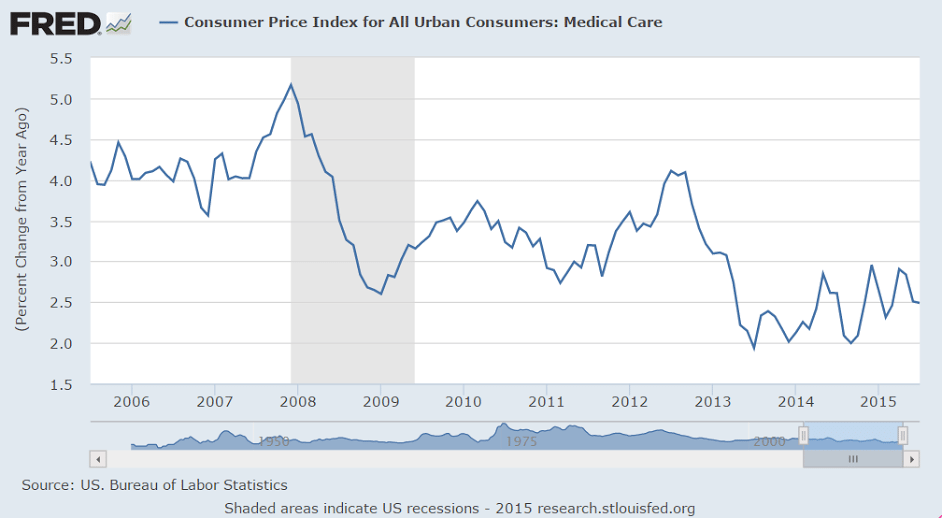
Consumer Price Index
er-8-19-8
Highlights
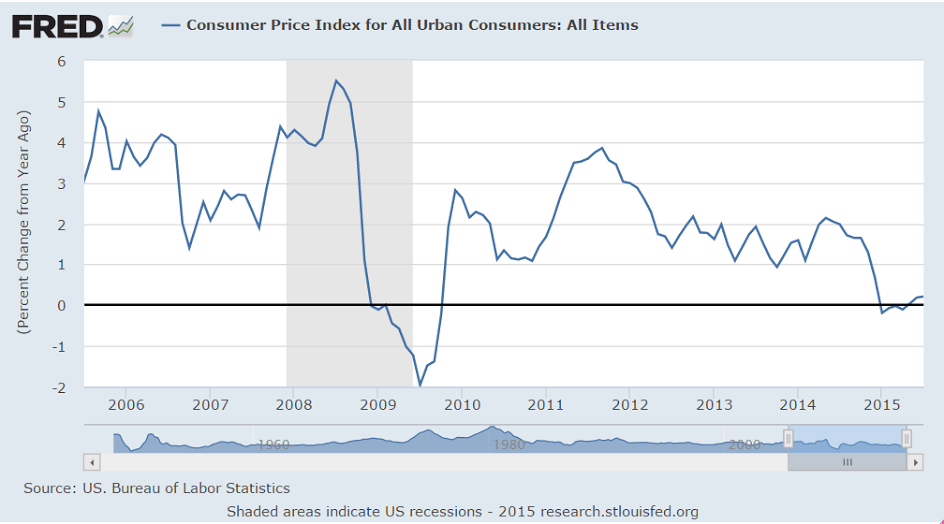
Inflation wasn’t brewing in July and with oil prices moving lower, inflation may not be showing much pressure in August either. The consumer price index rose only 0.1 percent in July as did the core, both under expectations. Year-on-year rates show slightly more pressure. Overall inflation is up 0.2 percent, which is very low but up from 0.1 percent in the prior month and the second positive reading of the year. The core is steady at plus 1.8 percent which is just under the Fed’s 2 percent target.

Gasoline moved sharply higher in July, up 0.9 percent following outsized gains of 3.4 percent and 10.4 percent in the prior two months. But with gas prices moving steadily lower this month, the upward effects of gasoline will be turning downward in August. Another major component showing upward pressure in July is apparel which rose 0.3 percent following, however, a long string of declines. Owners equivalent rent continues to show pressure, up 0.3 percent on top of June’s outsized gain of 0.4 percent.

Elsewhere, however, pressures are hard to find with electricity down 0.4 percent, used vehicles down 0.6 percent, new vehicles down 0.2 percent, and airfares down 5.6 percent. Medical, drugs, and education all rose only 0.1 percent.

There may be some upward creep in the headline year-on-year rates but, given the ongoing decline in oil, this report won’t be pushing the Fed for a September rate hike.

er-8-19-9
er-8-19-10
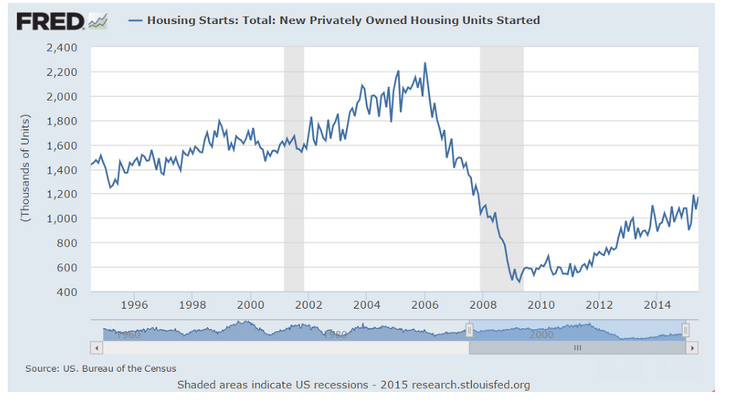
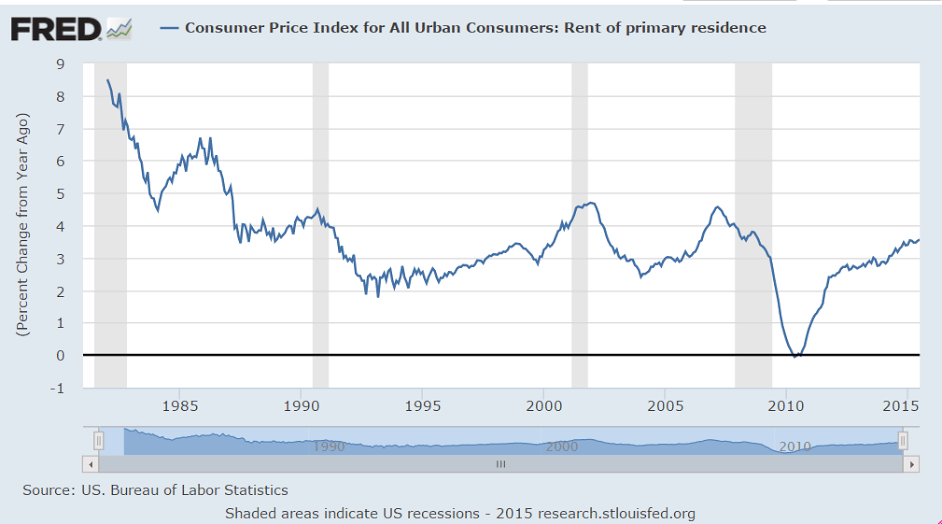
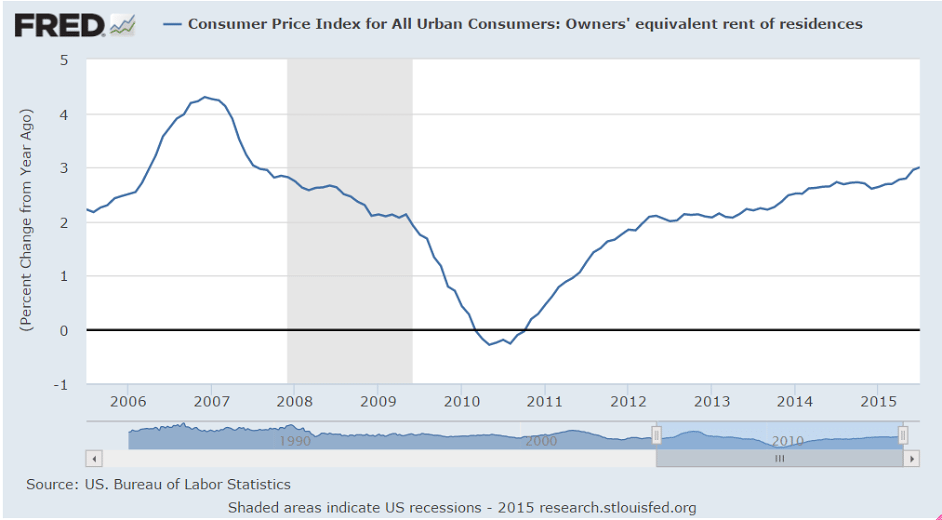
Rents have been moving up some, though still at a modest rate. Seems to me as per the depressed housing starts prices haven’t yet gotten close enough to replacement costs. Once they do get to replacement cost, market forces work to increase supply as ‘demanded’ without further ‘catch up’ price increases. At that point price increases come from increases in costs.

Also, lower utility costs for the landlord that aren’t passed through to the renter ‘count’ as higher rents, which means the drop in fuel and utility costs translate to increased rents when, for example, the actual payment remains the same:
er-8-19-11
er-8-19-12

Remember a few years back when the mainstream was sounding the alarm over this?
er-8-19-13
And this about a year ago?
er-8-19-14

Empire manufacturing, housing market index, EU merchandise trade

The lack of support from the lost oil capex continues to ripple out:

United States : Empire State Mfg Survey
er-8-17-1
Highlights
Out of the blue, the Empire State index has plunged deeply into negative column this month, to minus 14.92 in August vs plus 3.86 in July. This is by far the weakest reading of the recovery, since April 2009. New orders, which had already been weak in this report, fell from July’s minus 3.50 to minus 15.70 for the weakest reading since November 2010. Backlog orders, which had also been weak, came in at minus 4.55 from minus 7.45. Shipments, in the weakest reading since March 2009, fell to minus 13.79 from positive 7.99.

Last week’s industrial production report, boosted by the auto sector, offered hope but today’s report is a reminder that weak exports and weakness in the energy sector are stubborn negatives for the factory sector. Today’s results scramble the outlook for Thursday’s Philly Fed report which was expected to show moderate strength.
er-8-17-2
er-8-17-3

Home builders remain optimistic:

United States : Housing Market Index
er-8-17-4
Highlights
The new home sector is increasingly a central source of strength for the economy and builders are increasingly optimistic. The housing market index rose 1 point to a very strong 61 in August with the future sales component leading the way at 70. Current sales are at 66 with traffic continuing to lag but less so, at 45 for a 2 point gain in the month. By region, the South and West show the greatest composite strength at 63 each followed by the Midwest at 58 and the Northeast, which is the smallest region for new homes, still showing contraction at a sub-50 reading of 46.

Strength in the labor market is the driving force behind strength for new homes where lack of supply continues to motivate builders. Today’s report points to another strong housing starts report for tomorrow.

Never yet seen a positive trade balance and a weak currency, without an inflation problem. The euro is down only because of portfolio shifting, particularly CB’s, which may have run its course, and the general outlook remains deflationary. While this includes the (minority) non euro members, the trend is the same for just the ‘euro area’ which is also reported separately:

European Union : Merchandise Trade
er-8-17-5
Highlights
The seasonally adjusted trade balance was E21.9 billion, up from a revised E21.3 billion in May. Exports of goods to the rest of the world were €182.7 billion, an increase of 12 percent from a year ago. Imports from the rest of the world were E156.4 billion, 7 percent higher from a year ago. Intra-euro area trade rose to E151.2 billion in June 2015, up 10 percent compared with June 2014.

For the six months to June 2015, euro area exports of goods to the rest of the world rose 6 percent compared with January to June 2014), while imports were up 3 percent compared with the year earlier period.

Apart from the weakness of the oil market, the current soft level of the euro should help to ensure continued strong trade data over the rest of 2015.
er-8-17-6

MTG Purchase Apps, EU Industrial Production, China Industrial Production, JOLTS

Yes, purchase apps are up 20% vs last year, but you can see from the chart the
number of applications has leveled off and declined a bit more recently this year, and remains
at depressed levels:

er-8-12-1

The slump in industrial production is global:

European Union : Industrial Production
er-8-12-2

Highlights
Industrial production declined more than expected in June. Following a decline of 0.2 percent on the month, output excluding construction dropped 0.4 percent. Annual workday adjusted growth was 1.2 percent, down from 1.6 percent last time.

Durable consumer goods led the monthly declines, falling by2.0 percent from the previous month, followed by capital goods (down 1.8 percent) and intermediate goods (down 0.5 percent). Energy production (up 3.2 percent) was the sole sub-category to record a monthly advance.

Regionally, the biggest declines were seen in Portugal (down 2.1 percent) and Ireland (down 2.0 percent) while the Netherlands (up 3.9 percent) and Slovakia (up 1.4 percent) led to the upside. In the larger countries, Germany’s industrial output contracted 1.4 percent on the month while output in France also weakened 0.1 percent.

The disappointing figures will likely impact analysts’ expectations for Eurostat’s flash estimate of second quarter Eurozone GDP, which is scheduled for Friday.

er-8-12-3

And the latest from China was below expectations as the downtrend continues:

er-8-12-4


This turned a bit lower which ordinarily doesn’t mean much, but when the Fed is looking for ‘some’ improvement this is not that:

United States : JOLTS
er-8-12-5

Highlights
Job openings contracted in June to 5.249 million from 5.357 million in May. The decline likely reflects, at least in part, new hiring as the hiring rate rose 1 tenth to 3.7 percent. But layoffs point to weakness in labor demand with the layoff rate up 1 tenth to 1.3 percent. The quits rate was unchanged at 1.9 percent. Job growth has been no better than moderate this year and this report, which is mixed, doesn’t point to acceleration.

er-8-12-6

China, Germany, Productivity, NFIB Index, Redbook, Wholesale Trade


A few thoughts:

China’s US Tsy holding had been falling perhaps because they were selling $ to buy Yuan to keep it within in the prior band.

Pretty much all exporting nation’s currencies have already weakened vs the $, including the Yen and Euro, so this is a bit of a ‘catch up.’

In a weakening global economy from a lack of demand (sales) and ‘western educated, monetarist, export led growth’ kids now in charge globally, the path of least resistance is a global race to the bottom to be ‘competitive’. And the alternative to currency depreciation, domestic wage cuts, tends to be less politically attractive, as the EU continues to demonstrate.

The tool for currency depreciation is intervention in the FX markets, as China just did, after they tried ‘monetary easing’ which failed, of course. Japan did it via giving the nod to their pension funds and insurance companies to buy unswapped FX denominated securities, after they tried ‘monetary easing’ as well.

The Euro zone did it by frightening China and other CB’s and global and domestic portfolio managers into selling their Euro reserves, by playing on their inflationary fears of ‘monetary easing’-negative rates and QE- they learned in school.

The US used only ‘monetary easing’ and not any form of direct intervention, and so the $ remains strong vs all the rest.

I expect the Euro to now move ever higher until its trade surplus goes away, as global fears of an inflationary currency collapse are reversed and Euro buying resumes as part of global export strategies to export to the Euro zone. And, like the US, the EU won’t use direct intervention, just more ‘monetary easing’.

Ironically, ‘monetary easing’ is in fact ‘fiscal tightening’ as, with govts net payers of interest, it works to remove interest income from the global economy. So the more they do the worse it gets.

‘No matter how much I cut off it’s still too short’ said the hairdresser to the client…

The devaluations shift income from workers who see their purchasing power go down, to exporters who see their margins increase.
To the extent exporters then reduce prices and those price reductions increase their volume of exports, output increases, as does domestic employment. But if wages then go up, the ‘competitiveness’ gained by the devaluation is lost, etc., so that’s not meant to happen.

Also, the additional export volumes are likewise reductions in exports of other nations, who, having been educated at the same elite schools, respond with devaluations of their own, etc. etc. in a global ‘race to the bottom’ for real wages. Hence China letting their currency depreciate rather than spend their $ reserves supporting it.

The elite schools they all went to contrive models that show you can leave national deficit spending at 0, and use ‘monetary policy’ to drive investment and net exports that ‘offset’ domestic savings. It doesn’t work, of course, but they all believe it and keep at it even as it all falls apart around them.

But as long as the US and EU don’t have use of the tools for currency depreciation, the rest of the world can increase it’s exports to these regions via currency depreciation to lower their $ and Euro export prices, all of which is a contractionary/deflationary bias for the US and EU.

Of further irony is that the ‘right’ policy response for the US and EU would be a fiscal adjustment -tax cut or spending increase- large enough to sustain high enough levels of domestic spending for full employment. Unfortunately, that’s not what they learned in school…

The drop in expectations is ominous, particularly as the euro firms:

Germany : ZEW Survey
er-8-11-1

Highlights
ZEW’s August survey was mixed with a slightly more optimistic assessment of the current state of the economy contrasting with a fifth consecutive decline in expectations.

The current conditions gauge was up 1.8 points at 65.7, a 3-month high. However, expectations dipped a further 4.7 points to 25.0, their lowest mark since November 2014.


The drop in unit labor costs and downward revision of the prior increase gives the Fed cause to hold off on rate hike aspirations:

United States : Productivity and Costs
er-8-11-2

Highlights
A bounce back for output gave first-quarter productivity a lift, up a quarter-to-quarter 1.3 percent vs a revised decline of 1.1 percent in the first quarter. The bounce in output also held down unit labor costs which rose 0.5 percent vs 2.3 percent in the first quarter.

Output in the second quarter rose 2.8 percent vs a depressed 0.5 percent in the first quarter. Compensation rose 1.8 percent, up from 1.1 percent in the first quarter, while hours worked were little changed, up 1.5 percent vs 1.6 in the first quarter.

Looking at year-on-year rates, growth in productivity is very slight at only plus 0.3 percent while costs do show some pressure, up 2.1 percent in a reading, along with the rise in compensation, that will be welcome by Federal Reserve officials who are hoping that gains in wages will help offset weakness in commodity costs and help give inflation a needed boost.


Up a touch but the trend remains negative:

er-8-11-3


Redbook retail sales report still bumping along the bottom:

er-8-11-4


A decline in sales growth and rise in inventories is yet another negative:

United States : Wholesale Trade
er-8-11-5

Highlights
A build in auto inventories as well as for machinery drove wholesale inventories up a much higher-than-expected 0.9 percent in June. Sales at the wholesale level rose only 0.1 percent in the month, in turn driving the stock-to-sales ratio up 1 notch to a less-than-lean 1.30. This ratio was at 1.19 in June last year.

Mortgage Purchase Apps, EU Retail Sales, Payroll Tax, ADP, Trade, Equity Comment

While still historically very low, purchase apps are now way up over last year’s particularly depressed levels. Some are replacing all cash buyers, but the increase is also in line with increased existing home sales.

While new home sales were soft, turnover of existing homes has been increasing, and while not directly increasing GDP, existing home sales are generally associated with purchases of furniture, appliances, and other home improvements, and of course real estate commissions.

MBA Mortgage Applications
er-8-5-1

Highlights
A drop in rates helped boost mortgage activity in the July 31 week both for home purchases, up 3.0 percent in the week, and for refinancing which rose 6.0 percent. The strength in purchase applications, which are up 23 percent vs this time last year, is a positive indication for home sales. The average 30-year fixed mortgage for conforming loans ($417,000 or less) fell 4 basis points in the week to 4.13 percent.

er-8-5-2

EU retail sales

European Union : Retail Sales
er-8-5-3

Highlights
Retail sales were surprisingly weak in June. A 0.6 percent monthly fall was the first decline since March and followed a slightly smaller revised 0.1 percent rise in May. Annual workday adjusted growth of purchases was 1.2 percent, down from 2.6 percent in both mid-quarter and April.

June’s setback was primarily attributable to a 0.8 percent monthly drop in sales of food, drink and tobacco. Non-food products, excluding auto fuel, were off only 0.2 percent, although even this was enough to wipe out May’s entire rise. Fuel purchases were flat on the month after a 0.2 percent dip last time.

Regionally, headline weakness was dominated by a 2.3 percent monthly slump in Germany although Spain (minus 0.4 percent) also struggled. More promisingly, France (0.1 percent) saw sales increase for a third consecutive period and there were decent gains in Austria (1.3 percent), Belgium, Latvia and Lithuania (all 0.8 percent) and Estonia (0.7 percent).

The June data make for a second quarter increase in Eurozone retail sales of only 0.3 percent, less than a third of the rate achieved in the previous period and just half of the fourth quarter pace. This does not bode well for real GDP growth. Moreover, the EU Commission’s economic sentiment survey found consumer sentiment falling in July so it may be that the third quarter got off to a less than robust start too. That said, Greek developments are clearly having some impact and a more concrete resolution of the crisis there might be enough to get households happy to spend again.

Big drop in Federal withholding:

er-8-5-4

Lower than expected, and June revised down a bit as well, all in line with many recent surveys:

ADP Employment Report
er-8-5-5

Mark Zandi, chief economist of Moody’s Analytics, said, “Job growth is strong, but it has moderated since the beginning of the year. Layoffs in the energy industry and weaker job gains in manufacturing are behind the slowdown. Nonetheless, even at this slower pace of growth, the labor market is fast approaching full employment.”
Read more at Calculated Risk Blog

About as expected with last month’s revision:

United States : International Trade
er-8-5-6

Seems the drop in oil prices has been offset by non oil imports, as the trade deficit is looking somewhat wider:

er-8-5-7

Both exports and imports are down which indicates a weakening global economy:

er-8-5-8

The chart shows the trend of the non petroleum deficit has resumed it’s increase:

The blue line is the total deficit, and the black line is the petroleum deficit, and the red line is the trade deficit ex-petroleum products (wild swings earlier this year were due to West Coast port slowdown).
Read more at Calculated Risk Blog
er-8-5-9


Didn’t know we exported any consumer goods!
;)

Exports (Exhibits 3, 6, and 7) Exports of goods decreased $0.2 billion to $127.6 billion in June. Exports of goods on a Census basis decreased $0.5 billion. • Capital goods decreased $0.8 billion. o Telecommunications equipment decreased $0.3 billion. • Industrial supplies and materials decreased $0.6 billion. o Finished metal shapes decreased $0.3 billion. Consumer goods increased $0.8 billion.

Stocks up because jobs were weak and a fed spokesman thought the economy was too weak for a rate hike. ;)

Futures jump on ADP miss, Powell comments

By Jenny Cosgrave

August 5 (CNBC)

er-8-5-10

LA Port Traffic, Greek Banks, Recession Without Financial Crisis

Another weak export report. No mention of the drop in oil prices reduced foreign incomes.

LA area Port Traffic: Weakness in June

by Bill McBride on 7/20/2015 09:57:00 AM

Note: There were some large swings in LA area port traffic earlier this year due to labor issues that were settled on February 21st. Port traffic surged in March as the waiting ships were unloaded (the trade deficit increased in March too), and port traffic declined in April. Perhaps traffic in June is closer to normal.

Container traffic gives us an idea about the volume of goods being exported and imported – and usually some hints about the trade report since LA area ports handle about 40% of the nation’s container port traffic.

The following graphs are for inbound and outbound traffic at the ports of Los Angeles and Long Beach in TEUs (TEUs: 20-foot equivalent units or 20-foot-long cargo container).

To remove the strong seasonal component for inbound traffic, the first graph shows the rolling 12 month average.

er 7-20-1

On a rolling 12 month basis, inbound traffic was down 0.4% compared to the rolling 12 months ending in May. Outbound traffic was down 0.9% compared to 12 months ending in May.

The recent downturn in exports might be due to the strong dollar and weakness in China.

Read more at Calculated Risk Blog

Reads like they still don’t have a clue about how banking works:

The Greek government ordered banks to open on Monday, three weeks after they were shut down to prevent the system collapsing under a flood of withdrawals,

That doesn’t cause collapse. Depositors might have to wait for their Euro. That’s all. No reason for the govt. to close the banks. Reads to me like the govt. thinks that Euro needed to run the economy, pay taxes, etc. would leave the country, or something like that. Makes no sense.

As Prime Minister Alexis Tsipras looked to the start of new bailout talks next week.

The first action of the new cabinet was to sign off on a decree to reopen banks on Monday with slightly more flexible withdrawal limits that allow a maximum of 420 euros a week in place of the strict limit of 60 euros a day currently in place.

But restrictions on transfers abroad and other capital controls remain in place.

It’s up to the banks to set their limits based on how much liquidity they have available.

Also:

Three week shutdown of Greece banks cost the economy an estimated €3B, not counting lost tourism revenue – press – Athens Chamber of Commerce and Industry (EBEA) says some 4,500 containers with raw materials and finished products are blocked at customs.

Additionally, €6B in business transactions were frozen by the bank shutdown.- Retailers lost about €600M in business, with apparel taking the main blow. Exporters lost €240M.

Source: TradeTheNews.com

Yes, negative growth and recession sometimes happens without a domestic financial
crisis, and without any financial crisis globally as well.

Lots of things can cause deficit spending- both non government (private sector) and government together- from being insufficient to offset agents desiring to spend less than their incomes.

Sometimes it’s a sudden obstruction to lending and sometimes it’s not.

Sometimes the agents spending more than their incomes just fade away. For a government allowing the deficit to get too small is a political choice, sometimes well informed but most often misguided.

For the private sector it could be insufficient income, or any reason it simply doesn’t want to borrow to spend or spend from savings.

And the private sector tends to be pro cyclical. That is, should GDP growth decline, private sector borrowing to spend tends to taper as well, as credit worthiness deteriorates, causing the slowdown to get worse. This downward process continues until some agent starts spending more than its income, which historically is government, as tax revenues fall and transfer payments increase with rising unemployment from the downward spiral.

So looks to me like it was the oil capex that was keeping up with the demand leakages, and when that collapsed as prices fell the demand leakages got the upper hand. And so far no sign of anything else stepping up its spending enough to move the GDP needle.

Atlanta Fed, 2004 vs 2015 US data, EU trade

The Atlanta Fed forecast as of July 14 is was +2.3% annualized for Q2, which is far below initial estimates of most professional forecasters, and below their current forecasts as well, and likely to be lowered further due to recent data.

The first government estimate for Q2 GDP will be released on July 30th. June trade numbers will not be released until August, and it looks to me like May was a zig that could zag in June and could cause a downward revision to Q2 GDP.

Inventories also look high to me which means a correction would further reduce Q2 GDP, and the low productivity numbers and decelerating employment reports tell me business is overstaffed for the current pace of sales and likely to adjust accordingly as well.


er 7-16-7

The economy before the 2004 rate hikes vs now:


er 7-16-8

Another strong surplus:


er 7-16-9

Highlights

The seasonally adjusted trade balance returned another healthy surplus in May. At E21.2 billion the black ink was short of April’s slightly downwardly revised E23.9 billion but still above the E20 billion mark for the fourth time so far this year.

The deterioration in the headline reflected a 1.5 percent monthly fall in exports, their first drop since January. Imports were flat. Annual growth of the former was 3.0 percent and of the latter 0.0 percent.

At E2.6 billion the average surplus in April/May was 6.4 percent above its first quarter mean which points to a probable small positive contribution from total net exports to second quarter real GDP growth. Quite apart from the weakness of the oil market, the current soft level of the euro should help to ensure continued strong trade data over the rest of 2015.

er 7-16-10

This is just the euro area, also in surplus:


er 7-16-11

Italy in surplus as well:


er 7-16-12

Highlights

The seasonally adjusted trade balance was in a E4.3 billion surplus in May following a marginally larger revised E3.6 billion excess in April.

The headline gain was mainly attributable to stronger exports which rose 1.5 percent from April, their third increase in the last four months. Much of this came courtesy of a 28.4 percent jump in the energy sector excluding which exports were up only 0.6 percent. Consumer goods (2.2 percent) had a good period but intermediates were only flat and capital goods were weak (minus 0.3 percent). Compared with May 2015 exports were 2.0 percent stronger.

Imports fell a monthly 0.3 percent, largely due to a 5.3 percent slump in energy although capital goods also struggled (minus 0.9 percent). Annual import growth was 0.5 percent.