School and Unemployment, Spain Conference Link

How Have Prime-Age Workers in School Affected the Labor Market?

Just one of several possible factors keeping the participation rate down and the reported unemployment rate lower than otherwise, which in my narrative are the consequences of low aggregate demand/the federal deficit is too small, etc.

From the St. Louis Fed:

In the first scenario, we kept the increase in schooling of the population 16-21 that has occurred over the past 10 years. But we kept the share of the population 22 and older that attends school in 2015 at its 2005 levels. In this scenario, the May unemployment rate would have been 6.6 percent instead of the 5.5 percent observed that month.

And this:

How Long Until “Slack” Is Out of the Labor Market?

male-emp-pop-ratio

Presentation in Vila-real:

Los 7 fraudes inocentes capitales de la política económica

JOLTS, Redbook retail sales, Mexican inflation

More openings, same quits, fewer hires.
Whatever all that means…

United States : JOLTS
er-9-9-2-1
Highlights
Job openings were up sharply in July, to 5.753 million from an upwardly revised 5.323 million in June. The job openings rate rose to 3.9 percent in July following three prior months at 3.6 percent. Professional & business services, which is considered to be a leading component for total employment, led the gains with a 122,000 increase followed by accommodation & food services at 82,000 and retail at 77,000. Despite the rise in openings, the number of hires edged lower to 4.983 million from June’s 5.182 million. The quits rate, which is watched as an indication of worker confidence, was unchanged for a fourth month at 1.9 percent. The rise in openings could definitely be cited by the hawks at next week’s FOMC as a further indication of tightness in the labor market.
er-9-9-2-2

So maybe it wasn’t the central bank that created all that inflation way back when?
;)
er-9-9-2-3

Fed comments and charts, Employment from outside the labor force, Public sector employment, Small Business Index, Labor market conditions index

The reason the Fed is talking hike is because they believe the continued modest growth is reducing the excess capacity in the economy, and they are concerned about hitting the wall of full employment with their 0 rate policy and multi $ trillion portfolio, both of which they believe to be highly accommodative.

That is, they believe the car is creeping along in the fog towards what they believe is a wall with their foot on what they believe is the accelerator, and they want to lighten the pressure on the presumed accelerator before they hit the presumed wall.

However, they also know the growth in employment is only very slightly staying ahead of population growth, and, likewise, most all of the drop in the rate of unemployment is due a drop in the labor force participation rate, and not to employment growth. And they also know most of the newly employed were not considered in the labor force when they were hired, raising questions about what the labor force participation rate is actually measuring. And further evidence of a continued high level of slack are the continuing low levels of wage increases, as well as low reported inflation readings in general, which remain well below Fed targets 6 years into their 0 rate and QE initiatives.

And then there is the counterfactual, with their models telling them the economy would have been a whole lot worse without their accommodative policies. Believing that suggests that any backing off from current policy risks a substantial setback.

My conclusion- no telling what they might do. These are human beings navigating in a fog with an inapplicable map, and they think the brake pedal (lowering rates) is the gas pedal.

San Francisco Fed’s Williams Sees Rate Increase ‘This Year,’ If Risks Dissipate

By Jon Hilsenrath and Michael S. Derby

July 1 (WSJ) — “All of the data that we have had up until now has been, I think, encouraging. It …has been about as good, or better, than I was expecting, in terms of the U.S. economy,” San Fran Fed president John Williams said. “But there are some pretty significant—and I would say have now grown larger—headwinds that have developed.” The change in financial conditions since the July Fed meeting, in the form of falling stock prices and a rising dollar, “have been pretty big,” he said. “It’s not the case that nothing has changed since our last [policy] meeting.”

Sure looks to me like most everything peaked when oil prices collapsed:
er-9-8-1
er-9-8-2
So, interesting how the jobs are coming from ‘outside the labor force’ when it’s been the presumed and unique ‘shrinking labor force’ that’s resulted in most of the decline in the unemployment rates:
er-9-8-3
Employment growth has been nearly matched by population growth, so, again, it’s only via the ‘shrinking labor force’ argument that there’s been ‘improvement’:
er-9-8-4
President Obama remains the all time Tea Party hero when it comes to reducing the size of govt:
er-9-8-5

From RHB- you can see which one leads:
er-9-8-12

NFIB Small Business Optimism Index
er-9-8-7
Highlights
A solid gain in job openings and a solid bounce back for earnings trends helped lift the small business optimism 4 tenths to 95.9 vs Econoday expectations for 96.0. The index shows no immediate effect from troubles in China and global volatility. Hiring, capital spending and inventory investment plans firmed slightly, collectively adding 2 points. But the two outlook components collectively declined 4 points in readings that do not point to a big second-half finish for the economy.
er-9-8-8
er-9-8-9
Labor Market Conditions Index
er-9-8-10
Highlights
The August employment report proved mixed but not the labor market conditions index which rose 3 tenths to 2.1. This is a soft level compared to the mid-single digit trend of 2013 and 2014 but is still the highest reading of the year, since December. Adding to the strength is a 7-tenths upward revision to July. Payroll growth in August was weak but not the unemployment rate which fell 2 tenths to a recovery best of 5.1 percent. This index is based on a broad set of 19 components and could be cited by the hawks as evidence of labor market improvement at next week’s FOMC.

This hasn’t updated yet but you can see today’s print of 2.1 doesn’t impress:
er-9-8-11

payrolls

First, note that the year over year growth rate has been decelerating since the oil price collapse:
er-9-5-1
And that for all practical purposes the decline in the unemployment rate is due to the decline in the labor force participation rate, which is unique to this cycle and to me entirely due to a lack of aggregate demand (sales):
er-9-5-2
No demographics here, just plain weakness:
er-9-5-3
This remains depressed, and is not adjusted for inflation, also indicating the same lack of aggregate demand:
er-9-5-4
Again, note the reference to weak exports, which leads me to expect either prior export reports to be revised lower or new releases to gap down.

And the decline of the growth of private payrolls since the oil price collapse speaks to the underlying economic strength as well:

Employment Situation
er-9-5-5
Highlights
The headline may not look it but there’s plenty of strength in the August employment report. Nonfarm payrolls rose only 173,000 which is at the low-end estimate, but the two prior months are now revised up a total of 44,000. The unemployment rate fell 2 tenths to 5.1 percent which is below the low end estimate and the lowest of the recovery, since April 2008. And wages are strong, with average hourly earnings up 0.3 percent for a 2.2 percent year-on-year rate that’s 1 tenth higher than July. Debate will definitely be lively at the September 17 FOMC!

Private payroll growth proved very weak, at only 140,000. Government added 33,000 jobs vs July’s 21,000. Manufacturing, held back by weak exports and trouble in energy equipment, shed a steep 17,000 jobs followed by a 9,000 loss for mining which is getting hit by low commodity prices. A plus is a 33,000 rise in professional & business services and a respectable 11,000 rise in the temporary help subcomponent. This subcomponent is considered a leading indicator for long-term labor demand. Retail rose 11,000 with vehicle dealers, who have been very busy, adding 2,000 jobs following July’s gain of 11,000.

The participation rate remains low, unchanged at 62.6 percent. Other details include a 1 tenth downtick in the broadly defined U-6 unemployment rate to 10.3 percent. The workweek rose to 34.6 from 34.5 hours.

Seasonality, especially the timing of the beginning of the school year, always plays an outsized role in August employment data which are often revised higher. Policy makers are certain to take this into consideration at this month’s FOMC. There’s something for everybody in this report which won’t likely settle expectations whether the Fed lifts off or not this month.
er-9-5-6

So is this the ‘some improvement’ the Fed is looking for before hiking? ;)

Nor is there any (floating exchange rate) theory or evidence that any of this is a function of rates the way the Fed acts as if it is. But that’s another story…

Mtg Purchase Applications, ADP, Productivity and Unit Labor Costs, Factory Orders

Nice jump in front of what is perceived as a near certain rate hike. However pending home sales didn’t show much of a jump in sales:

States : MBA Mortgage Applications
er-9-3-1
Highlights
A sharp drop in Treasury rates early in the August 28 week, tied to the global stock market rout, triggered a surge of mortgage applications. The refinance index jumped 17 percent in the week while the purchase index rose 4.0 percent. The latter is up 25 percent year-on-year. Rates backed up later in the week to end unchanged for the 10-year yield at 4.08 percent. The gain in the purchase index is another strong positive for housing strength going into year end.

You can see it’s up a large % from some very low prints last year this time, but more recently the 4 week moving average seems to have peaked and in general remains at historically very low levels:
er-9-3-2
er-9-3-3

This is from last week:

From the NAR: Pending Home Sales Inch Forward in July

The Pending Home Sales Index, a forward-looking indicator based on contract signings, marginally increased 0.5 percent to 110.9 in July from an upwardly revised 110.4 in June and is now 7.4 percent above July 2014 (103.3). The index has increased year-over-year for 11 consecutive months and is the third highest reading of 2015, behind April (111.6) and May (112.3).

This was below expectations of a 1.0% increase.

Note: Contract signings usually lead sales by about 45 to 60 days, so this would usually be for closed sales in August and September.

Lower than expected and last month’s lower than expected print revised down some:

August 2015 ADP Job Growth at 190,000 – Below Consensus Expectations

By Steven Hansen

ADP reported non-farm private jobs growth at 190,000. The rolling averages of year-over-year jobs growth rate remains strong but the rate of growth continues in a downtrend.

States : ADP Employment Report
er-9-3-4
Highlights
ADP, like it did for the July employment report, is calling for a sub-200,000 flop on Friday. ADP sees private payrolls rising 190,000 which is a sizable 20,000 below the Econoday consensus and right at the low estimate. ADP is revising down its July call even further lower and farther away from the government’s initial reading, to 177,000 vs ADP’s initial call for 185,000. The government’s private payroll reading was 210,000 in July and is expected to come in at 211,000 in August. However spotty ADP’s record is, today’s result is very likely to raise talk of a lower-than-expected report on Friday and a December, not a September, FOMC rate hike.

This chart looks to me like it peaked back in November, about when oil prices collapsed, and has been continuously working it’s way lower subsequently:
er-9-3-5
The low productivity and somewhat elevated unit labor costs tell me business has ‘over hired’ in relation to sales, which is in sync with the declining growth in employment, as well as with the higher reported inventories and declining industrial production and weak regional Fed surveys previously reported.
er-9-3-6
United States : Factory Orders
er-9-3-7
Highlights
A lower-than-expected headline gain of 0.4 percent in July reflects price-related weakness in energy products and masks significant underlying strength in factory orders. Pulled down by petroleum and coal products, orders for non-durables fell a sharp 1.3 percent, offsetting a very strong and upward revised jump of 2.2 percent in durable goods orders (initially plus 2.0 percent as posted in last week’s advance durable goods report). The gain in durable goods was driven by gains in motor vehicles and includes strong gains for capital goods which indicate, at least it did as of July, rising business investment and rising confidence in the overall outlook.

Orders for vehicle bodies, parts & trailers jumped 4.0 percent in July after rising 1.2 percent in June. Orders for ships & boats have been on a special tear, up 19.5 percent following gains of 28.0 and 11.0 percent in the two prior reports. And the July report would have been even stronger if not for a 6.1 percent downswing in commercial aircraft orders that followed June’s 70 percent surge. Excluding transportation equipment, factory orders actually fell in July, down 0.6 percent following a 0.6 percent rise in June.

Turning to details on capital goods, core orders, that is nondefense goods excluding aircraft, jumped 2.1 percent on top of June’s 1.5 percent gain. Shipments for this reading, which are part of nonresidential fixed investment in the GDP report, rose 0.6 percent in July and 1.0 percent in June. Note that the 0.6 percent gain in July is unrevised which should not affect ongoing third-quarter GDP estimates.

Total shipments, again reflecting weakness in non-durables, slipped 0.2 percent in July. Unfilled orders rose 0.2 percent with inventories slipping 0.1 percent. The slip in inventories did not change the inventory-to-shipments ratio which is stable at 1.35.

Global volatility is a negative that hit in August and that may or may not weigh on the nation’s factory sector which, in the strength of the auto sector, enjoyed strong domestic-based demand in June and July. And given the strength of yesterday’s motor vehicle sales, the factory sector looks to get a continuing boost from the auto sector.

er-9-3-8
er-9-3-9
er-9-3-10

er-9-3-11
er-9-3-12
er-9-3-13
er-9-3-14

From yesterday’s release:
er-9-3-15
er-9-3-16
er-9-3-17
er-9-3-18

Retail Sales, Jobless Claims, Import Export Prices, Business Inventories, Japan Machine Orders, Freight Transportation, Gas Prices


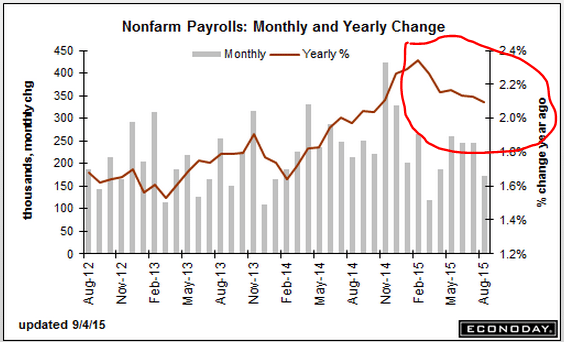
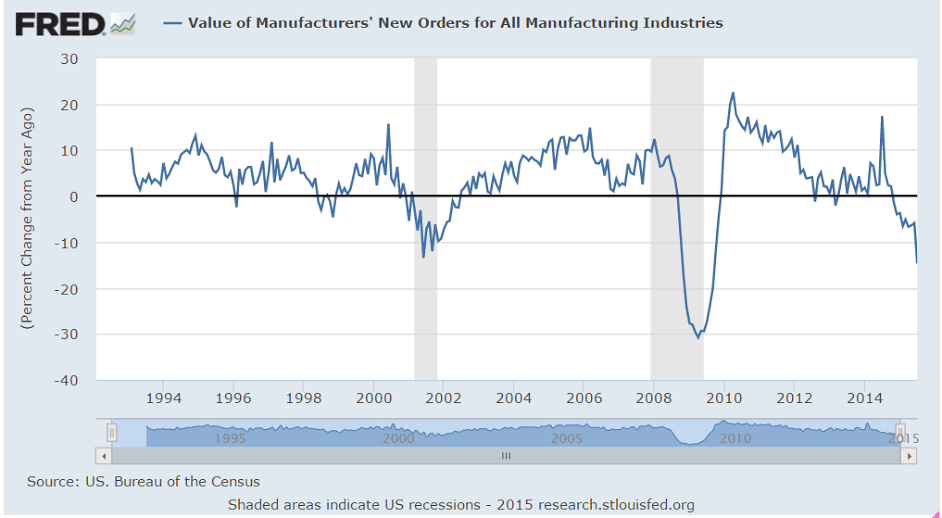
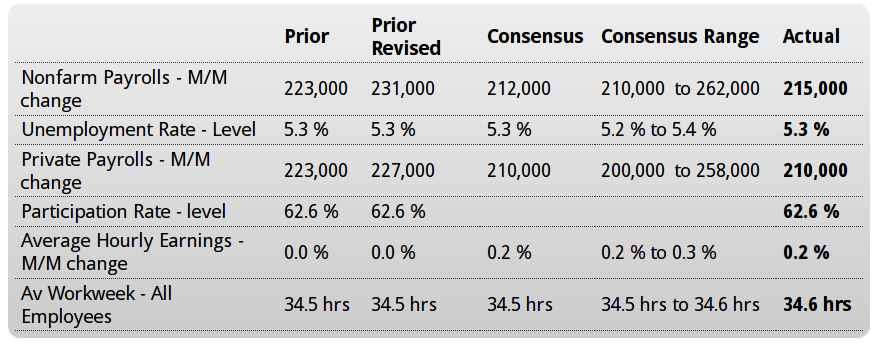
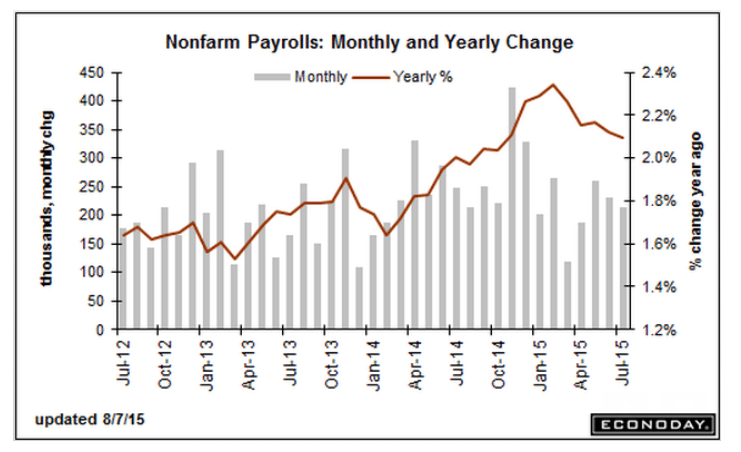
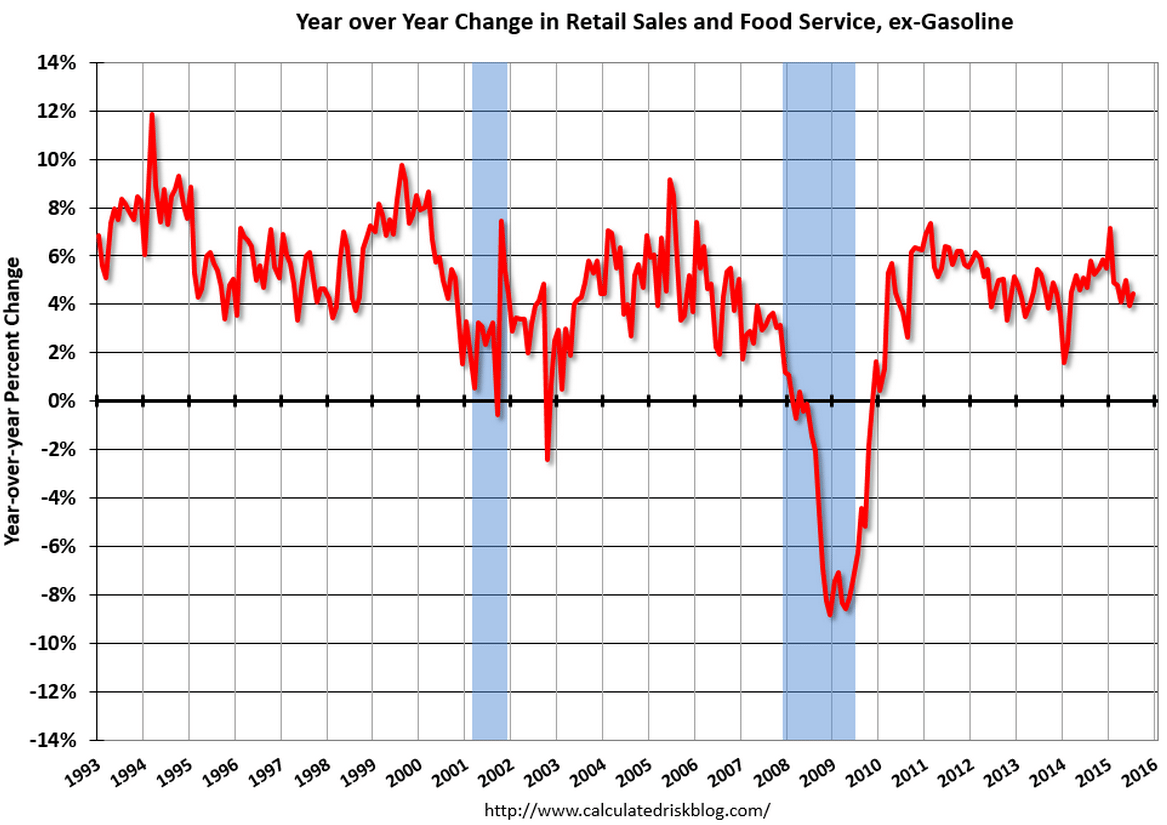
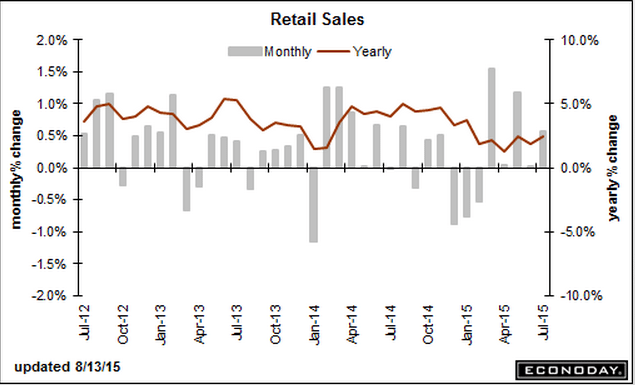
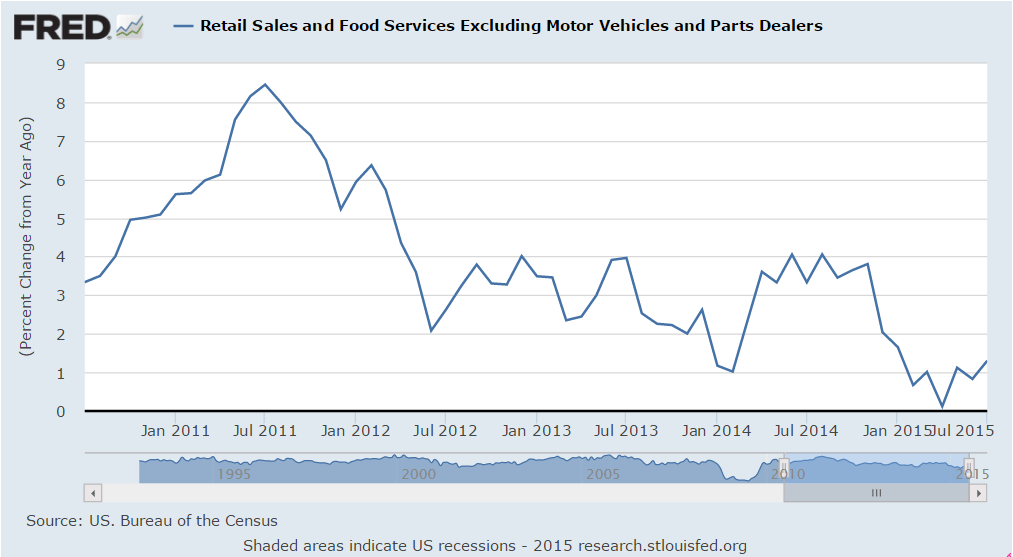
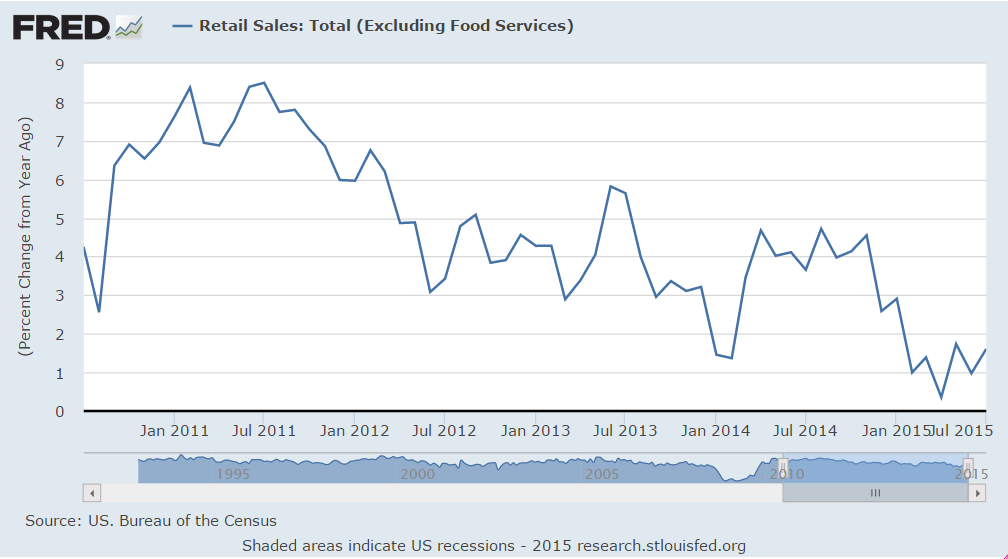
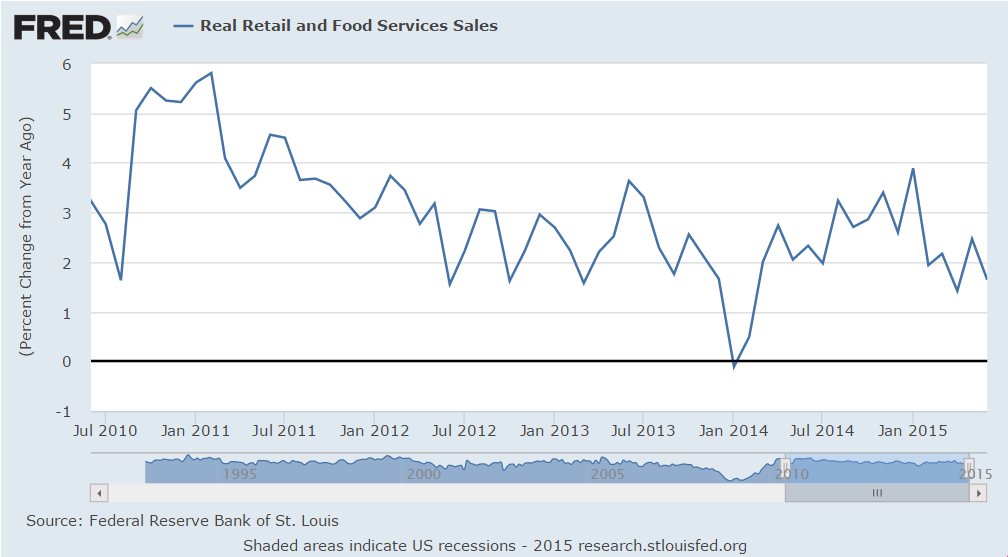
This is being touted as a strong report, but, again, looks to me like it’s dropped since year end and at best is moving sideways from there, and not to forget that a large share of auto sales are imports.

But I do agree the Fed is heck bent on raising rates in Sept, even without ‘some’ improvement, and will do so unless there’s a stock market decline severe enough to hold them back. So far that’s not happening.

Retail Sales
er-8-13-1

Highlights
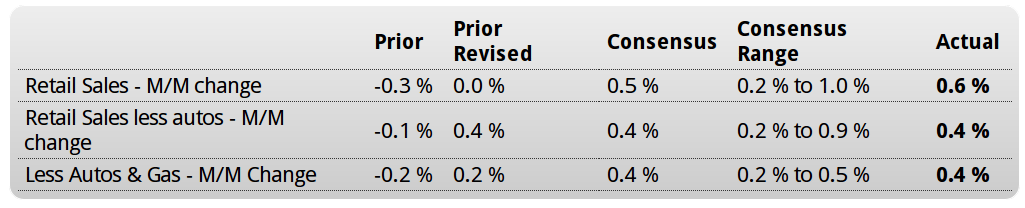
Big upward revisions underscore a very solid and very important retail sales report. Retail sales rose 0.6 percent in July with June revised to unchanged from an initial reading of minus 0.3 percent and with May revised to a jump of 1.2 percent from 1.0 percent. The revisions to June and May point to an upward revision for second-quarter GDP.

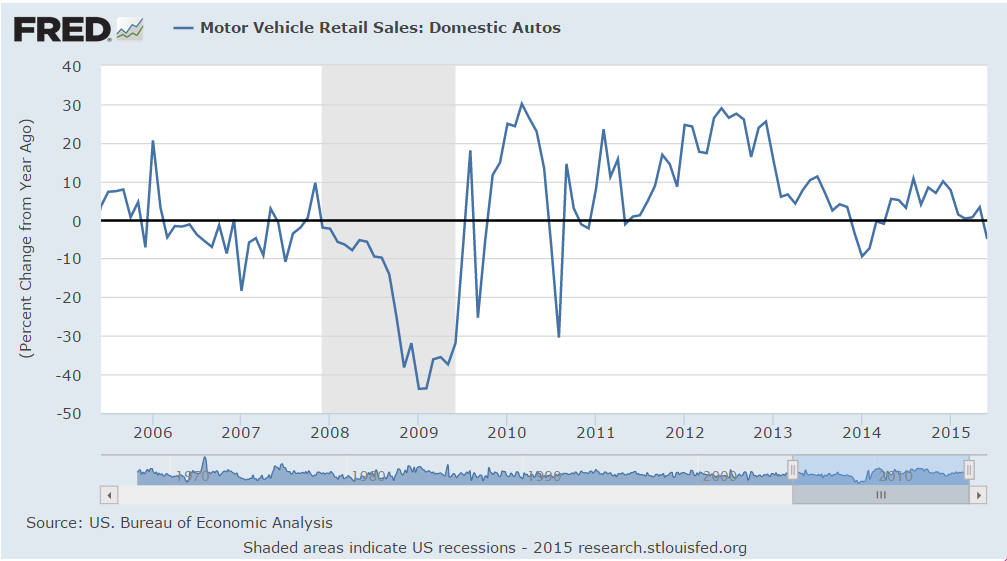
Vehicle sales, as expected, were the standout in July, jumping 1.4 percent to nearly reverse June’s 1.5 percent slide and nearly matching May’s historic 1.9 percent surge. But even outside vehicles, retail sales were strong with the ex-auto reading rising a solid 0.4 percent. Restaurants, in another strong signal of consumer strength, rose an outsized 0.7 percent following June’s 0.5 percent gain. These are very strong gains for this component. Excluding both vehicles and gasoline, retail sales rose 0.4 percent, again another solid reading.

Strength in both vehicles and restaurants point to the health of the US consumer and will likely give the hawks the courage, despite all the troubles in China, to push for a rate increase at the September FOMC.

er-8-13-4

er-8-13-5

er-8-13-6

er-8-13-7

er-8-13-8

er-8-13-9

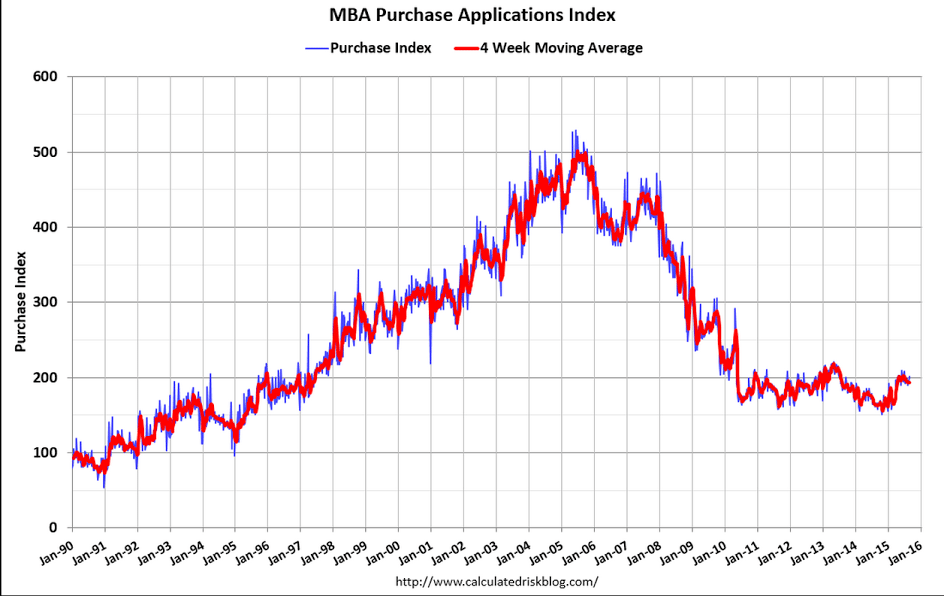
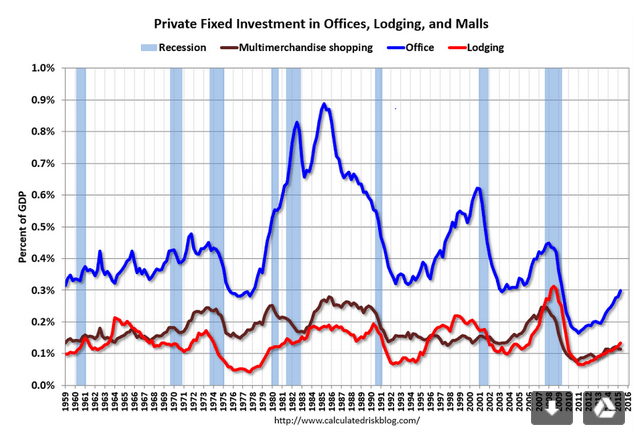
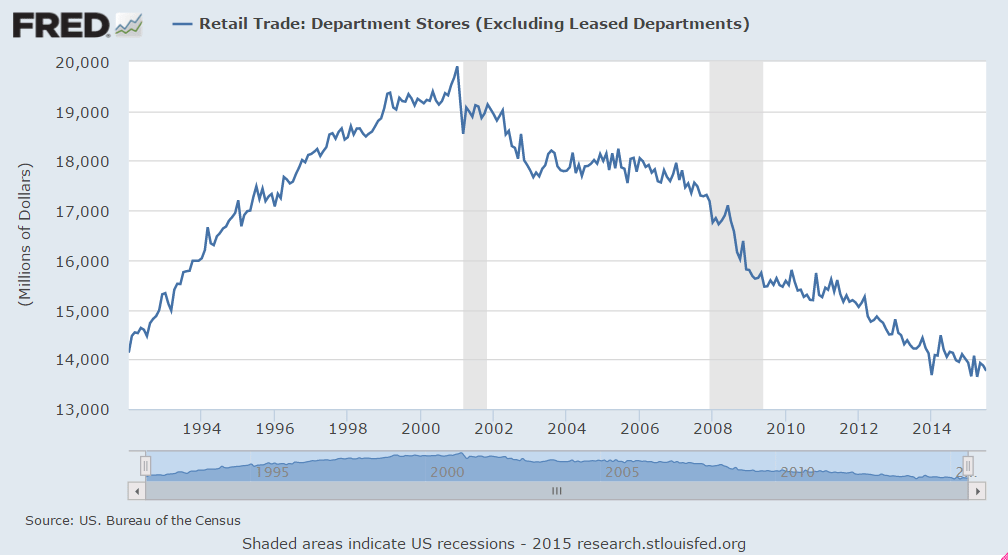
Tough times for department store sales continue, which explains some of the weakness in construction:

er-8-13-10

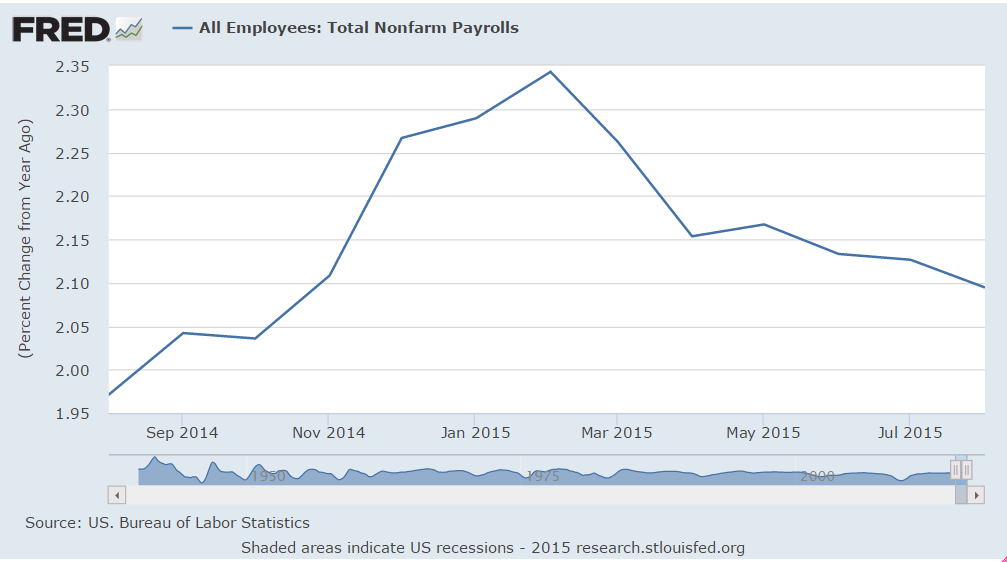
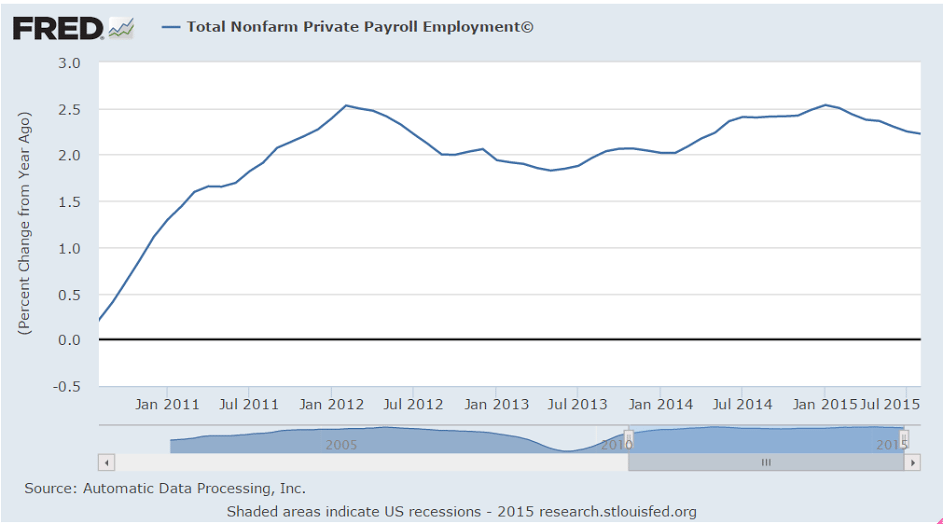
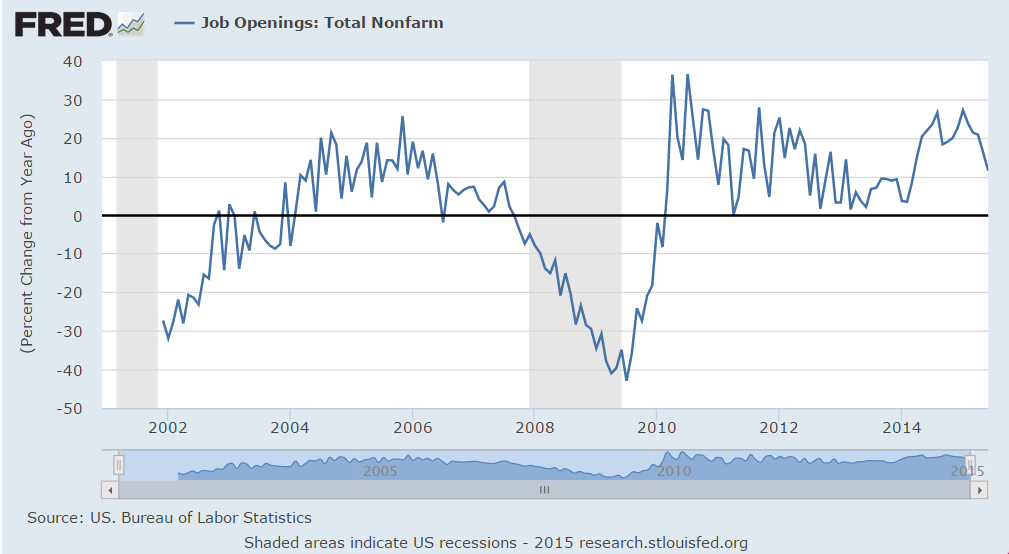
‘Some’ deterioration:

Jobless Claims
er-8-13-11

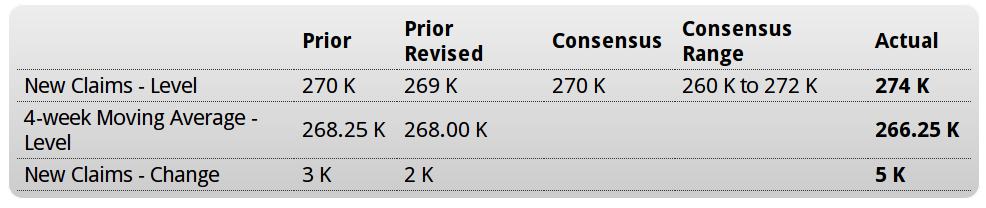
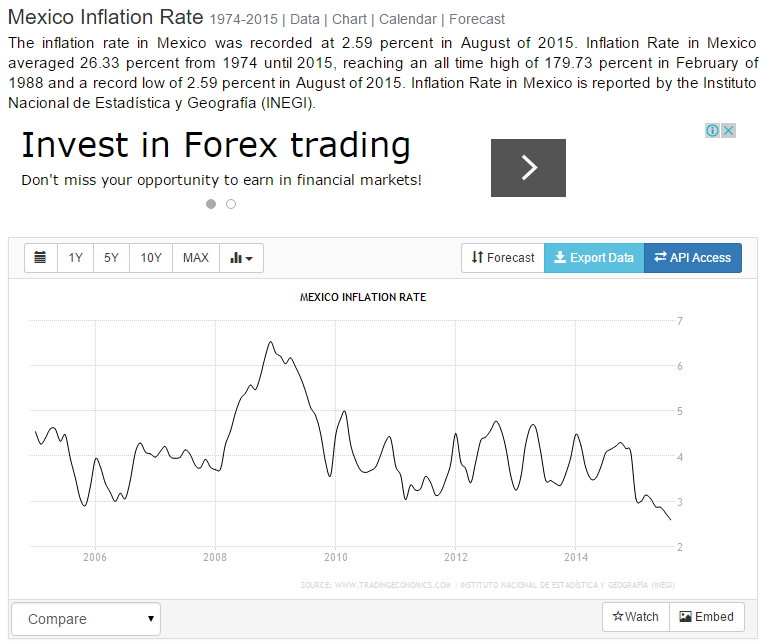
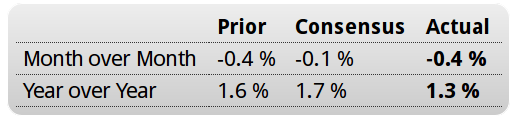
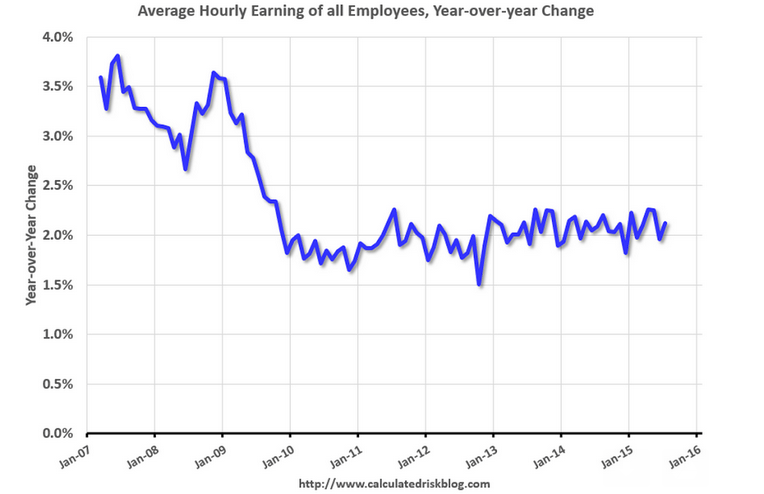
‘Some’ deterioration for Fed hopes of higher inflation. It’s been failing to hit its target for longer than I can remember…

er-8-13-12


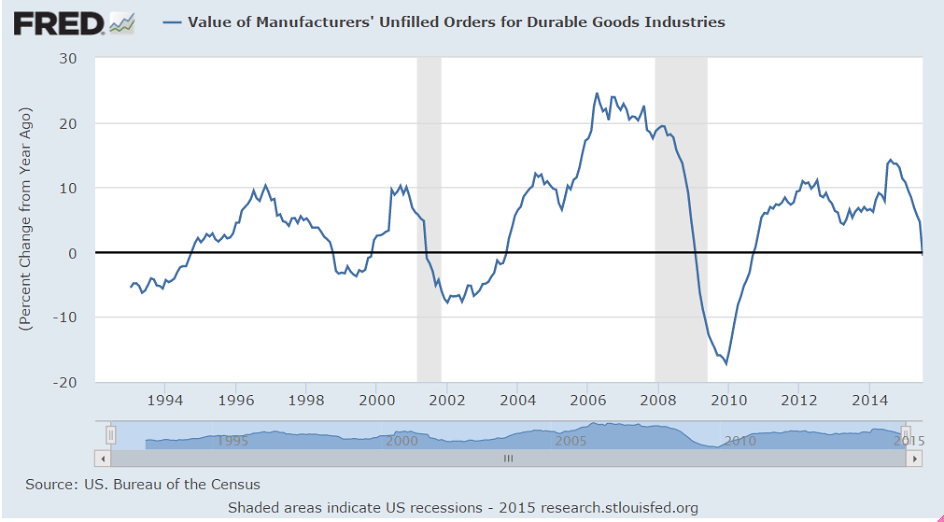
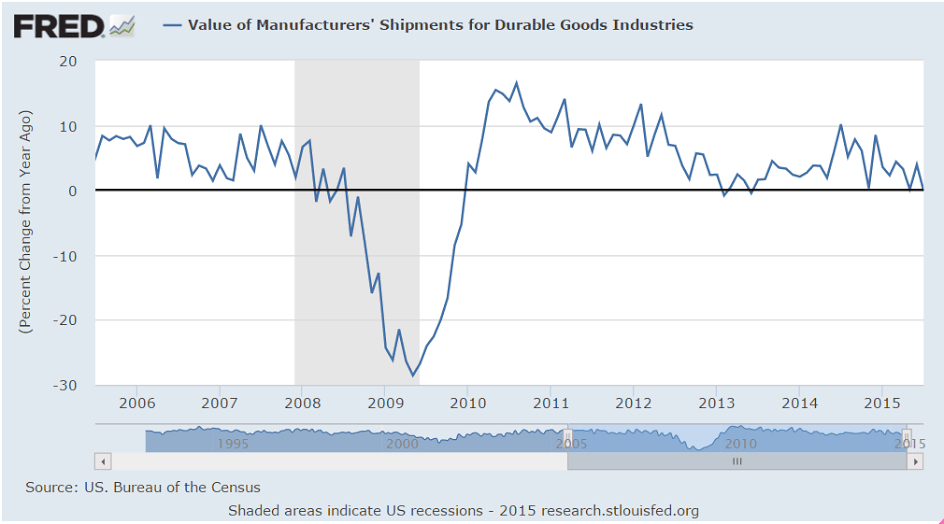
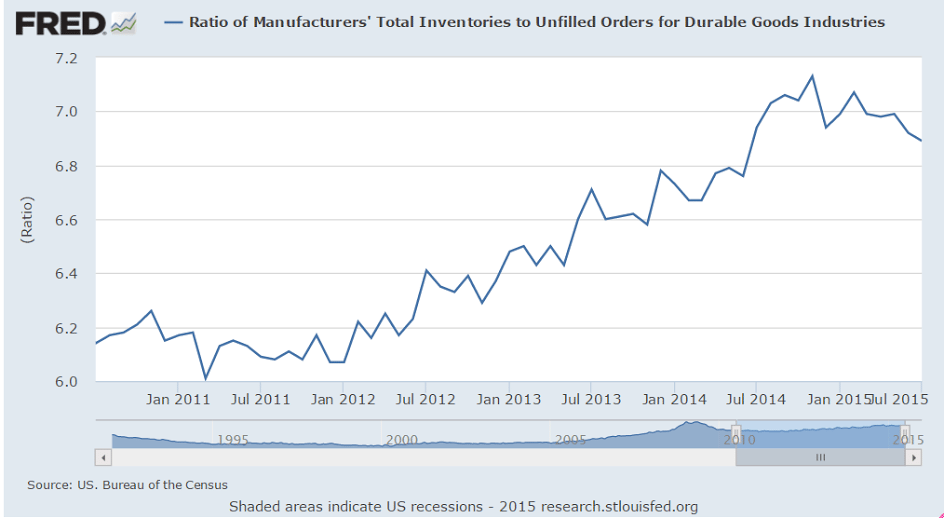
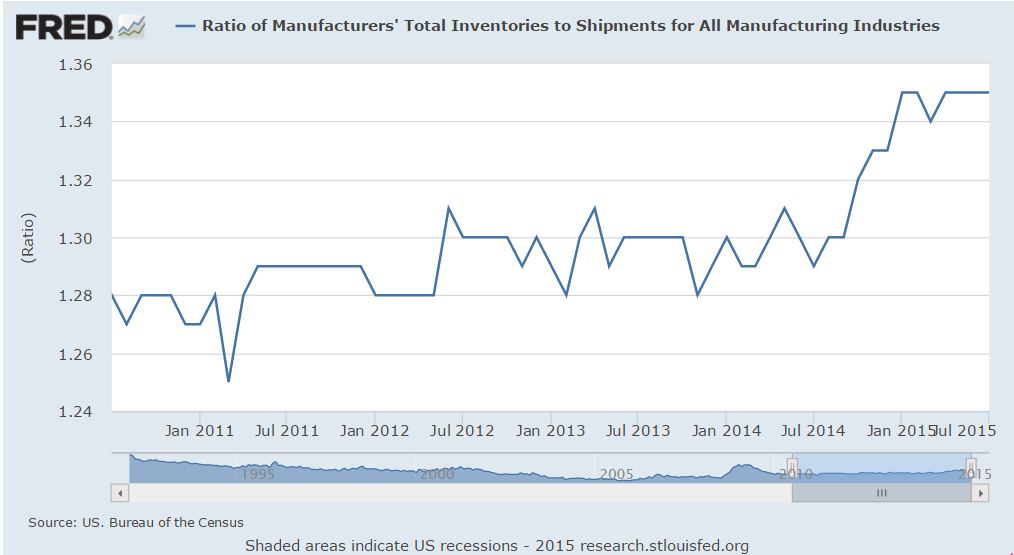
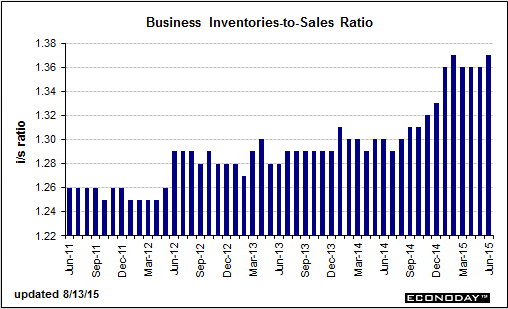
Excess inventory building in June helps Q2 GDP but the likely subsequent production cuts will hurt Q3. The now persistently too high inventory to sales ratio is overdue for a correction:

United States : Business Inventories
er-8-13-13

Highlights
Inventories rose relative to sales in June but the news isn’t that bad given that the build was centered in autos. Business inventories rose 0.8 percent in June which was well ahead of a 0.2 percent rise in sales. The mismatch lifts the inventory-to-sales ratio to 1.37 from 1.36.

But retail inventories at auto dealers were to blame, up 1.4 percent in June and contributing to a 0.7 percent rise for the retail component. Inventories at manufacturers and wholesalers, the two other components of the business inventory report, also rose, up 0.6 and 0.9 percent respectively.

Inventories are on the heavy side but the concentration in autos is welcome given how strong sales are, evidenced by the 1.4 percent surge for the motor vehicle component of the July retail sales report released earlier this morning. Note that this report, along with the retail sales report, are likely to lift revision estimates for second-quarter GDP.

er-8-13-14

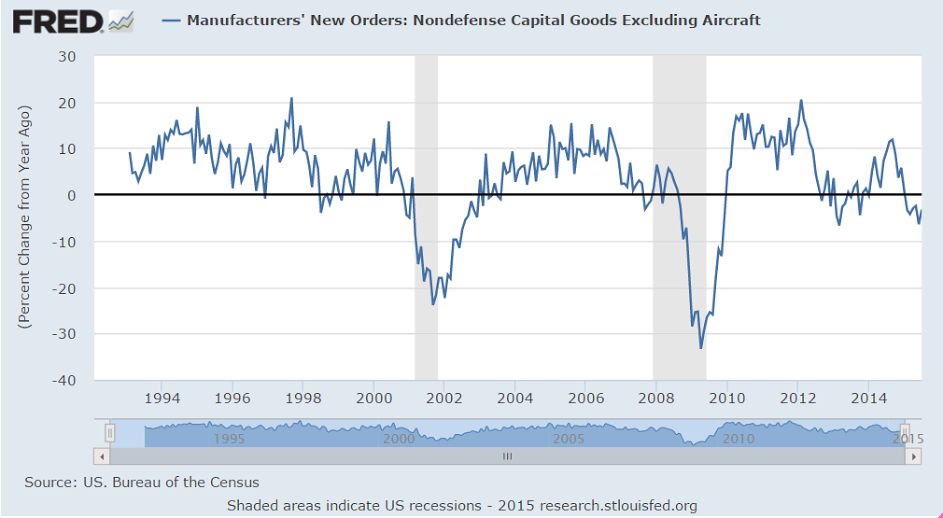
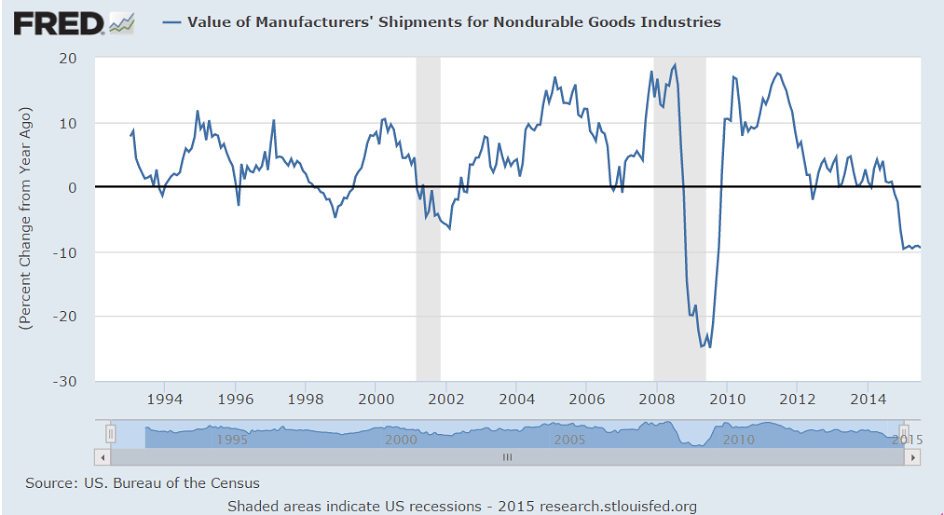
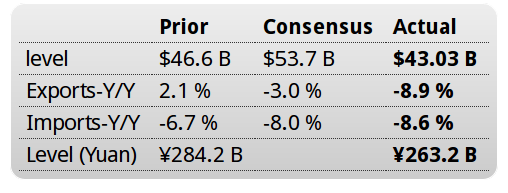
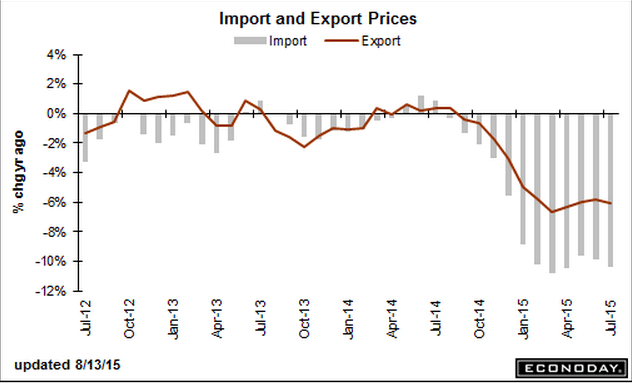
Global weakness continues:

Japan : Machine Orders
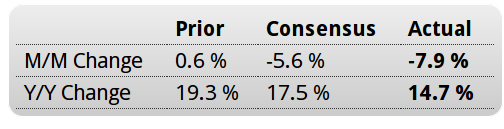
er-8-13-15

Highlights
June seasonally adjusted machine orders (excluding volatile items) declined for the first time since February. They dropped a larger than anticipated 7.9 percent on the month and were up 14.7 percent on the year. Core orders were up 16.6 percent based on the original series. This was in contrast to expectations of a 17.5 percent increase.

Core machine orders are considered a proxy for private capital expenditures. The downward move followed a 0.6 percent gain a month before. The government repeated its assessment that machine orders would advance in the third quarter.

Nonmanufacturing orders excluding volatile items were up 5.0 percent while manufacturing orders dropped 14.0 percent. All orders including volatile items dropped 6.2 percent on the month. Manufacturing orders likely softened on continued weaker export demand while the sluggish domestic economy weighs on nonmanufacturers.”

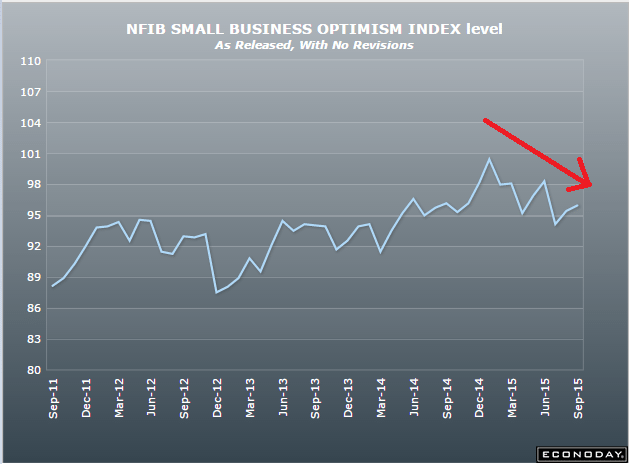
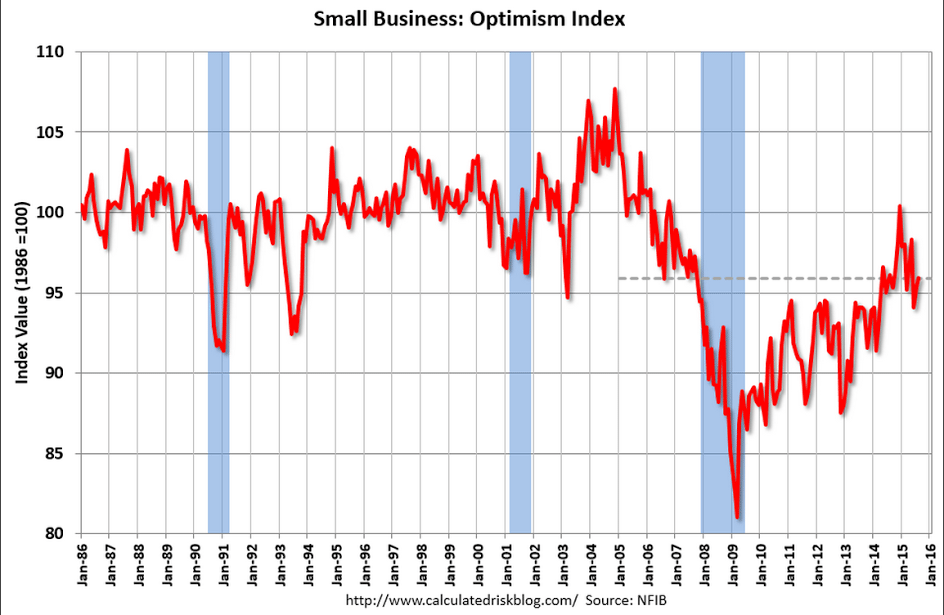
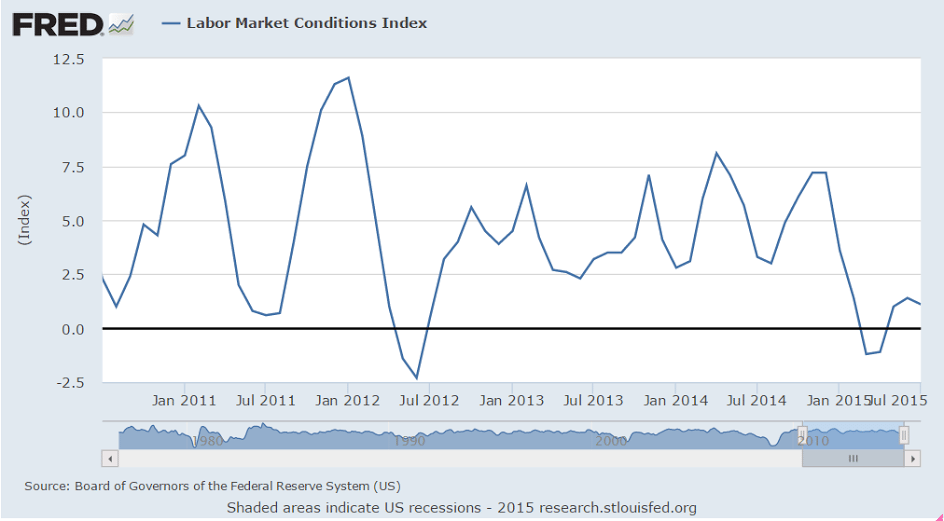
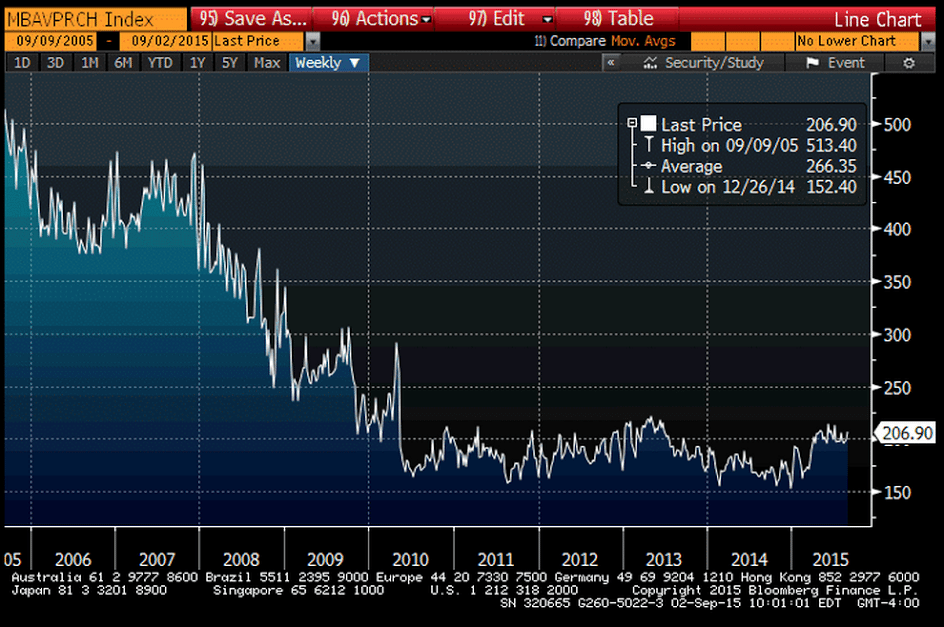
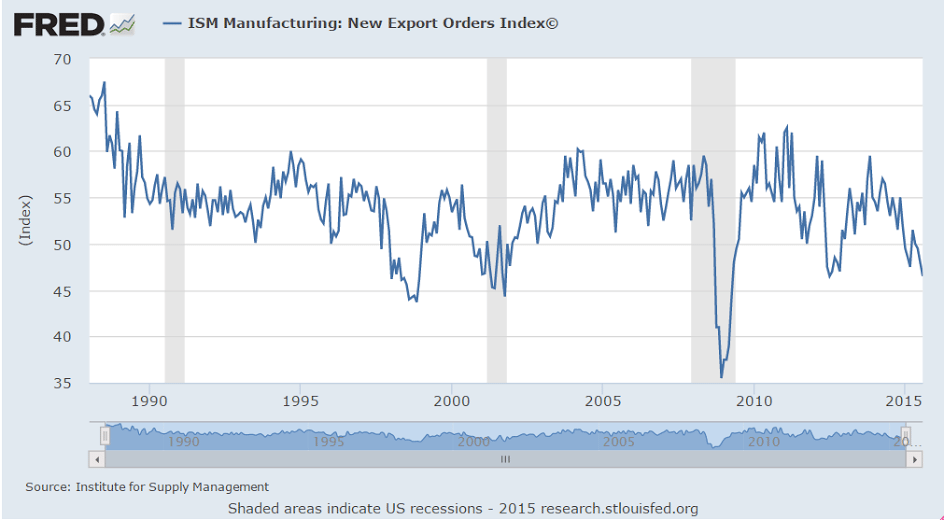
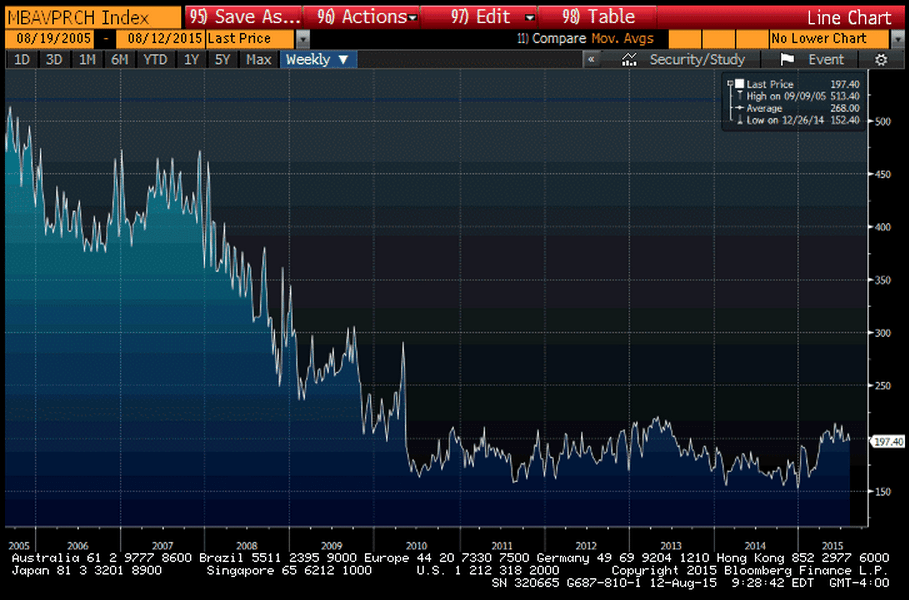
Another weak looking index:

er-8-13-16


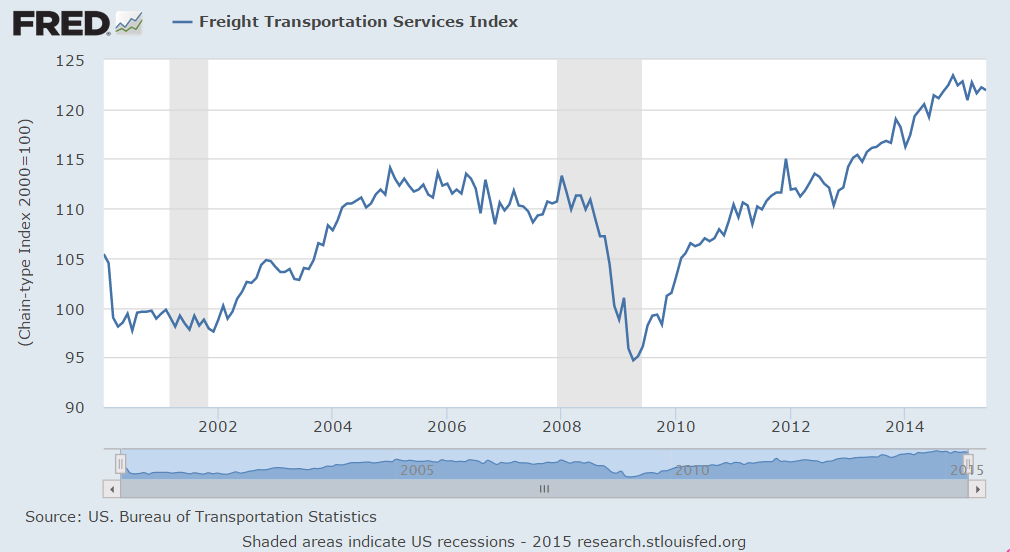
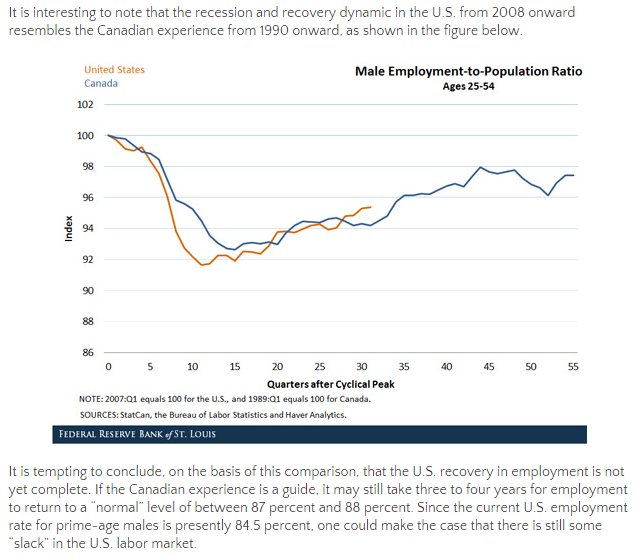
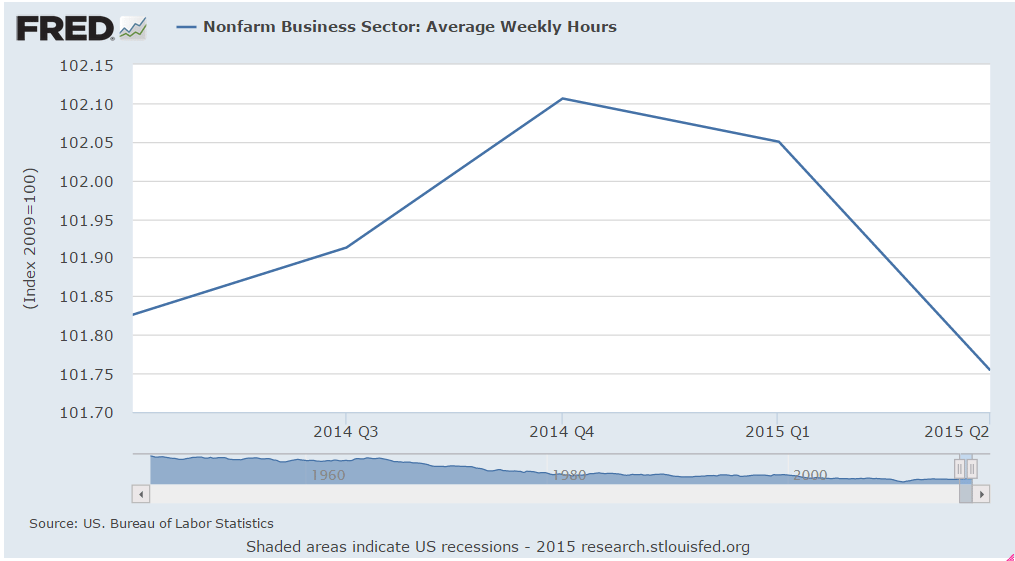
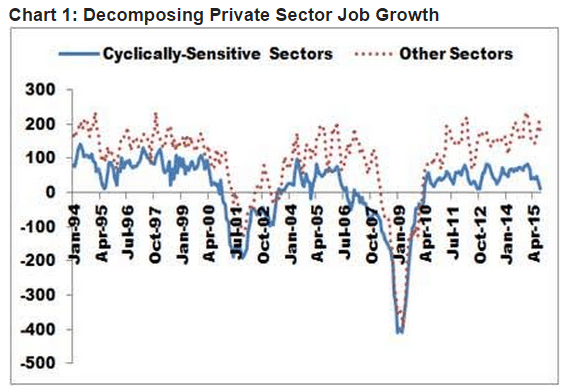
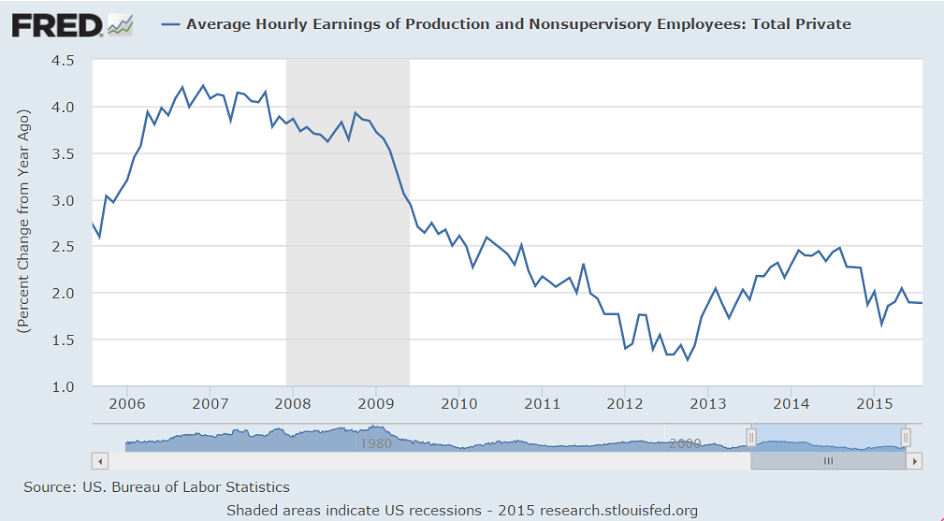
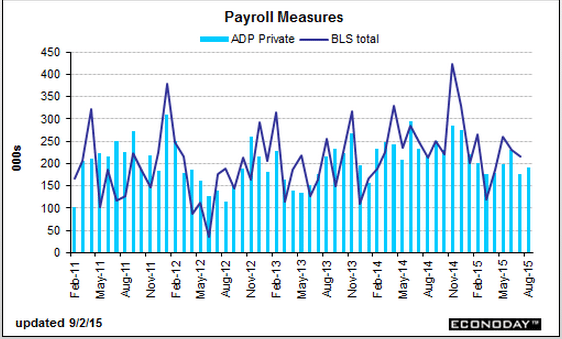
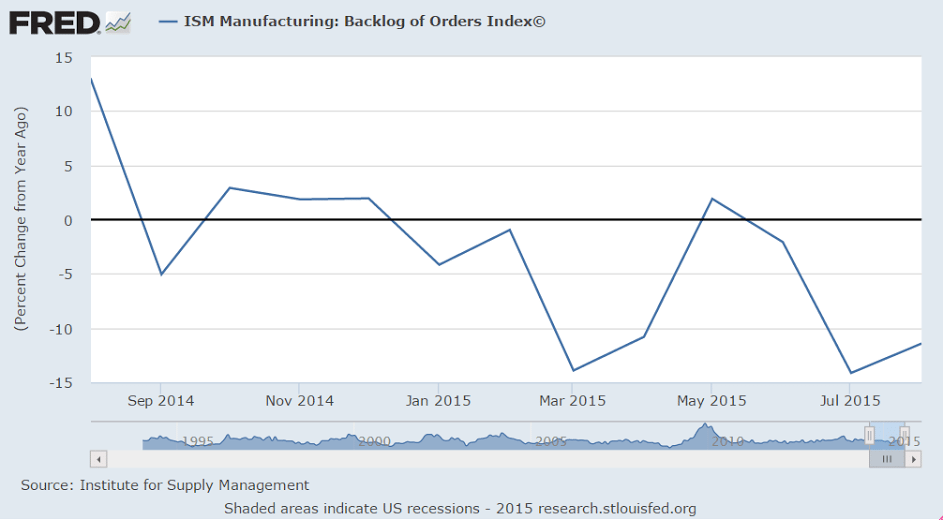
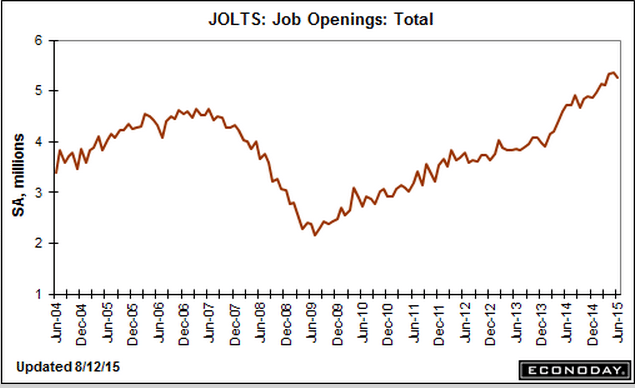
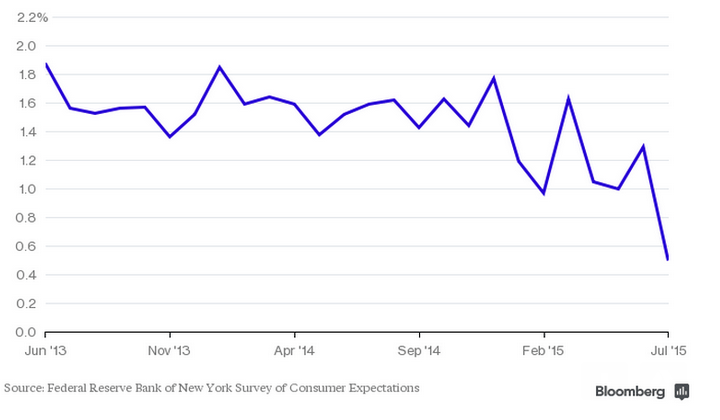
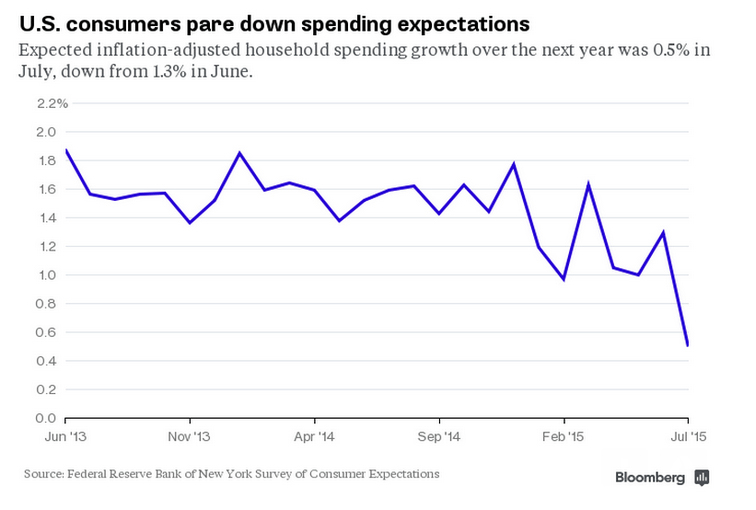
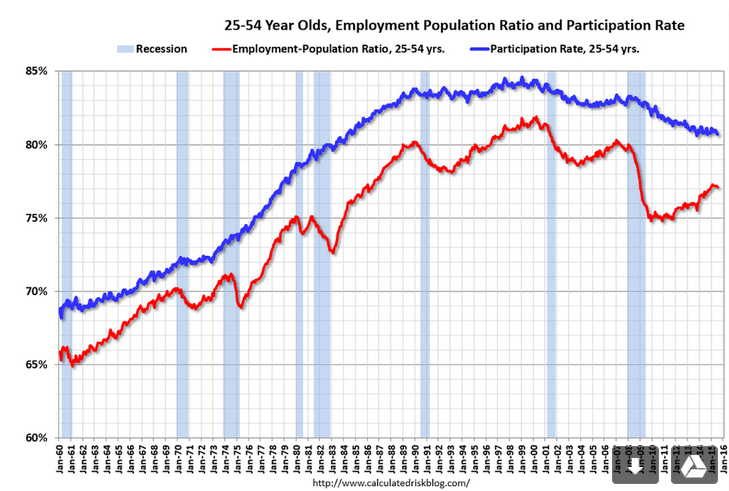
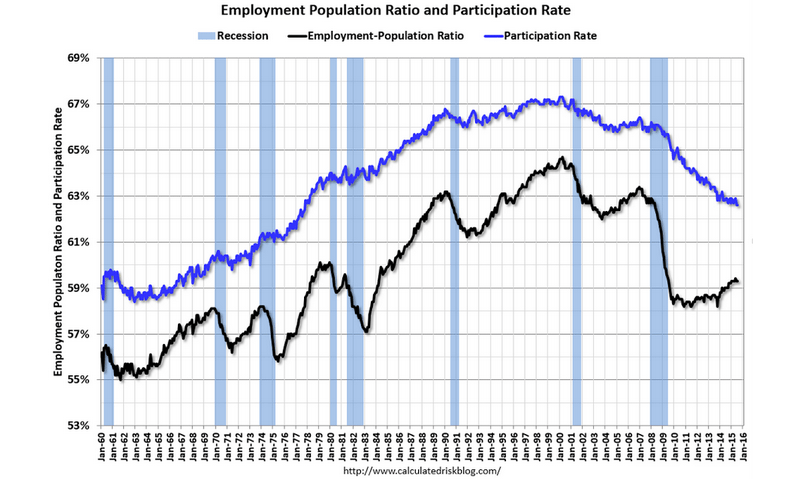
And I’d call this ‘some’ deterioration in the ‘labor market’. Looks like it was weakening before the 2014 oil capex boom supported it, and then has fallen off since the oil price collapse:

er-8-13-17


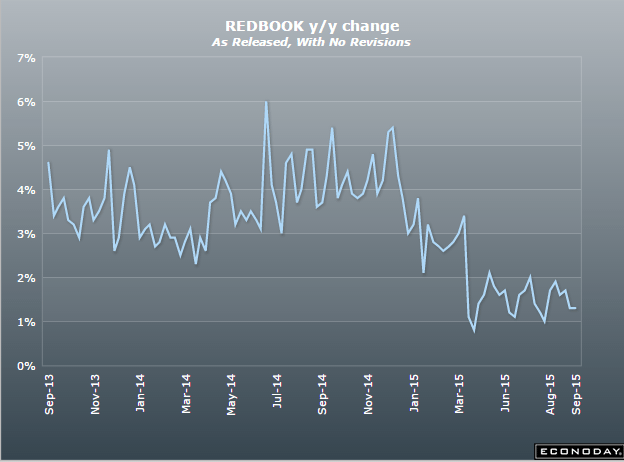
This is to the point I’ve been making that surveys are one man one vote, not one dollar one vote, so optimism remained high even as retail sales, for example, were fading. Yes, a lot more people saved $10 per week on gas but an equal amount of income was reduced for sellers of oil, including those earning royalties and holding leases, and investors of all sorts, and seems the spending cuts on domestic product by that group outweighed the additional spending from pump savings.

Fueled by low pump prices, U.S. motorists to drive more in August – survey

By Jarrett Renshaw

August 11 (Reuters)

U.S. motorists are paying an average of $2.58 per gallon, nearly a dollar less than a year ago, according to AAA, the nation’s largest motorist advocacy group. And a quarter of respondents expected prices to continue to decline, up from 10 percent a month ago.

The survey found that nearly 80 percent of people say gas prices influence how they feel about the economy. And with gas prices down nearly $1 from a year ago, U.S. motorists are feeling positive about the direction of the economy, the survey found.

“There is good news for retailers as consumer optimism picks up during peak vacation season,” said NACS Vice President of Strategic Industry Initiatives Jeff Lenard.

MTG Purchase Apps, EU Industrial Production, China Industrial Production, JOLTS

Yes, purchase apps are up 20% vs last year, but you can see from the chart the
number of applications has leveled off and declined a bit more recently this year, and remains
at depressed levels:

er-8-12-1

The slump in industrial production is global:

European Union : Industrial Production
er-8-12-2

Highlights
Industrial production declined more than expected in June. Following a decline of 0.2 percent on the month, output excluding construction dropped 0.4 percent. Annual workday adjusted growth was 1.2 percent, down from 1.6 percent last time.

Durable consumer goods led the monthly declines, falling by2.0 percent from the previous month, followed by capital goods (down 1.8 percent) and intermediate goods (down 0.5 percent). Energy production (up 3.2 percent) was the sole sub-category to record a monthly advance.

Regionally, the biggest declines were seen in Portugal (down 2.1 percent) and Ireland (down 2.0 percent) while the Netherlands (up 3.9 percent) and Slovakia (up 1.4 percent) led to the upside. In the larger countries, Germany’s industrial output contracted 1.4 percent on the month while output in France also weakened 0.1 percent.

The disappointing figures will likely impact analysts’ expectations for Eurostat’s flash estimate of second quarter Eurozone GDP, which is scheduled for Friday.

er-8-12-3

And the latest from China was below expectations as the downtrend continues:

er-8-12-4


This turned a bit lower which ordinarily doesn’t mean much, but when the Fed is looking for ‘some’ improvement this is not that:

United States : JOLTS
er-8-12-5

Highlights
Job openings contracted in June to 5.249 million from 5.357 million in May. The decline likely reflects, at least in part, new hiring as the hiring rate rose 1 tenth to 3.7 percent. But layoffs point to weakness in labor demand with the layoff rate up 1 tenth to 1.3 percent. The quits rate was unchanged at 1.9 percent. Job growth has been no better than moderate this year and this report, which is mixed, doesn’t point to acceleration.

er-8-12-6

Fed Labor Indicator, NY Fed Consumer Expectations, Lumber Prices, China Trade

This Fed indicator, whatever it means, just went down some:

Labor Market Conditions Index
er-8-10-2

Highlights
If the Fed relied exclusively on its labor market conditions index, no one would be in much hurry for the rate hike. The index for July came in slightly below expectations at 1.1 vs a revised 1.4 in June. The index, based on a broad set of 19 components, has been hovering near zero all year, well off its 5.4 average of last year. Unemployment may be down but hiring has been soft and the 2015 trend for this index is the weakest of the recovery.

er-8-10-1

Remember when this was taken as an indication of falling demand for housing?

er-8-10-6

Another indication of a weaker global economy, and a good reason for China to allocate more reserves to Euro:

China : Merchandise Trade Balance
er-8-10-5

Highlights
China’s trade figures shocked analysts. July’s unadjusted merchandise trade surplus was $43.0 billion, down from $45.7 billion in June. Exports plunged 8.3 percent against expectations of a 3.0 percent drop. Imports sank 8.1 percent against expectations of a 8 percent drop. The year to date trade balance was $305.2 billion compared with $212.9 billion in the same period a year ago. For the seven months through July, exports were down 0.8 percent on the year while imports dropped 14.6 percent. On a seasonally adjusted basis, exports slid 3.4 percent on the month after increasing 1.5 percent in June while imports declined 3.8 percent after jumping 6.9 percent in June. On the year, seasonally adjusted exports dropped 7.9 percent while imports were 8.4 percent lower.

China’s top government body, the State Council, said last month that it would give high priority to the nation’s trade sector, providing tax breaks and cutting red tape while reducing import duties. The government has also accelerated a range of infrastructure projects to boost demand at home. Meanwhile, the central bank has cut interest rates four times since November in an effort to help struggling domestic companies.

Adding to the problems for exporters is the relatively strong Chinese currency, which has held steady against a buoyant dollar. That has carried the yuan more than 10% higher against the Euro, providing a drag on exports to some key European markets.

Jobs, Atlanta Fed, Rail Traffic

The Fed is looking for ‘some improvement’ in the jobs market. But looks like deterioration to me? The number of jobs fell for the second straight month, the year over year growth rate continued to fall, the unemployment rate and the participation rate were unchanged, earnings growth remains very low. All that went up was hours worked, by less than a tenth.

Employment Situation
er-8-8-1

Highlights
The numbers aren’t spectacular but they’re solid enough to keep a September rate hike in play. Non-farm payrolls rose just about as expected, up 215,000 in July with upward revisions adding 14,000 to the prior two months. The unemployment rate is unchanged at 5.3 percent. Wages show some traction, up 0.2 percent in the month with the year-on-year rate over 2 percent at 2.1 percent. The average workweek is up, rising to 34.6 hours from a long run at 34.5. The labor force participation rate, which dropped sharply in June, held at 62.6 percent.

Other details look surprisingly solid with payrolls rising 60,000 in trade & transportation, for a third straight strong gain, and professional & business services rising 40,000 to extend their long healthy run. Retailers continue to add jobs, up 36,000 for their third straight strong gain with the motor vehicle subset up 13,000 and reflecting the strength of car sales. Manufacturing, which is usually weak, rose a notable 15,000 in the month with construction, where lack of skilled labor is being reported, showing a modest gain of 6,000.

Another plus in the report is a decline in Janet Yellen’s favorite reading, the broadly defined U-6 unemployment rate which is down a notch to 10.4 percent. If the August employment report a month from now looks this good, a rate hike at the September FOMC will be a lock.

Improvement? Looks more like deterioration?

er-8-8-2

er-8-8-3

er-8-8-4

er-8-8-5

Slow start to Q3 here:

Latest forecast

August 6 (GDPNow)

The first GDPNow model forecast for real GDP growth (seasonally adjusted annual rate) in the third quarter of 2015 was 1.0 percent on August 6. The model projects that lower inventory investment will subtract 1.7 percentage points from third quarter real GDP growth. Real GDP grew 2.3 percent in the second quarter according to the advance estimate from the U.S. Bureau of Economic Analysis.
er-8-8-6

Rail Week Ending 01 August 2015: Traffic Down 1.8% in July

By Steven Hansen

August 7 (Econointersect)

Econintersect: Week 30 of 2015 shows same week total rail traffic (from same week one year ago) contracted according to the Association of American Railroads (AAR) traffic data. Intermodal traffic contracted year-over-year, which accounts for approximately half of movements. and weekly railcar counts continued in contraction.

Challenger Layoffs, Claims, Trade Comments, Saudi Price Setting, Construction Detail

Not to worry, just the army announcing layoffs:

Challenger Job-Cut Report
er-8-6-1

Highlights
A major Army cutback made for an outsized 105,696 layoff count in July. The Army said it is cutting 57,000 jobs over the next two years (note that Challenger counts layoffs at the time of announcement, not when layoffs actually occur). Heavy layoffs, at 18,891, were also announced in computer & electronics.

These remain at historically low levels:

US weekly jobless claims total 270,000 vs 273,000 estimate

By Robert Galbraith

August 6 (Reuters)

U.S. Trade Gap Expands 7% in June

By Josh Mitchell

July 1 (Wall Street Journal)

The U.S. trade gap with other countries grew 7% in June to $43.8 billion, as imports climbed steadily while exports continued to slip. The U.S. trade gap with the European Union reached an all-time high in June as imports from Europe rose. The trade gap with Mexico also set a record. The U.S. trade deficit with China grew 9.8% in the first six months of 2015 compared with the same period last year,Wednesday’s report showed. The deficit with Japan grew 4.1%. The rise in U.S. imports was due to higher demand for consumer goods, particularly pharmaceutical items, and industrial supplies, including crude oil. Auto imports were the highest on record.

This is how the Saudis set price via altering their posted spreads to various benchmarks:

er-8-6-2


Historically low levels and still growing at lower rates than prior cycles, so adding a lot less to GDP.
My narrative is that it’s all about a lack of income from a shortfall of private and/or public deficit spending:

er-8-6-3

er-8-6-4