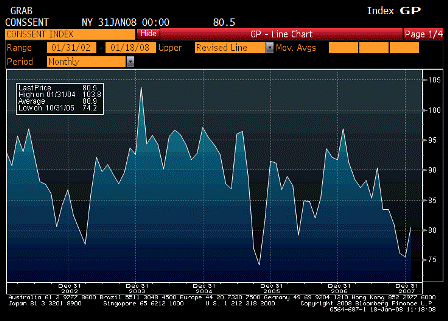
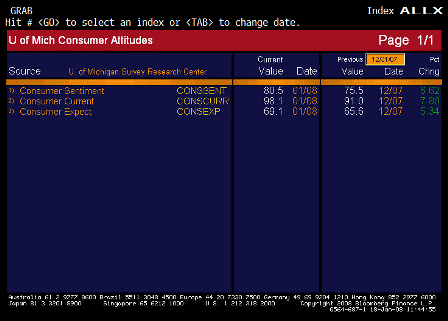
2008-04-11 US Economic Releases

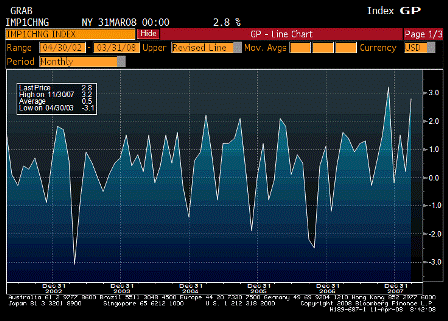
2008-04-11 Import Price Index MoM

Import Price Index MoM (Mar)

Survey 2.0%
Actual 2.8%
Prior 0.2%
Revised n/a

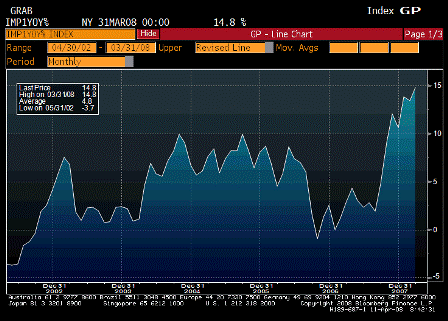
2008-04-11 Import Price Index YoY

Import Price Index YoY (Mar)

Survey 13.7%
Actual 14.8%
Prior 13.6%
Revised 13.4%

This is a very strong inflation channel.


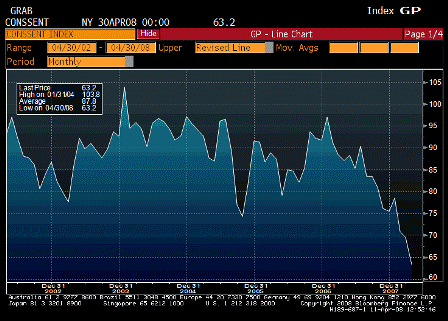
2008-04-11 U. of Michigan Survey

U. of Michigan Confidence (Apr P)

Survey 69.0
Actual 63.2
Prior 69.5
Revised n/a

From Karim:

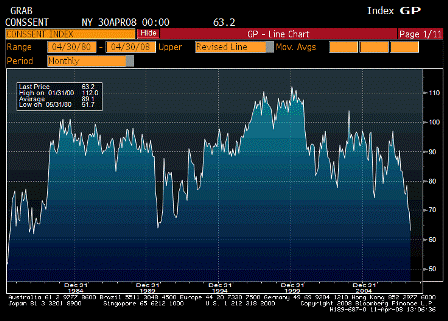
  • Michigan survey takes out low from 1990-91 recession; prior lowest point was March 1982. Decline was from 69.5 to 63.2

2008-04-11 U. of Michigan Survey since 1980

U. of Michigan Survey since 1980

Interesting how low ‘confidence’ is in light of how much better GDP and employment is doing now vs then.

Part of it is the rising influence of the media, and part are the factors behind the export boom that are causing us to consume less and instead export more of our own output.

The channel this time around is rising costs for food and energy take away the purchasing power power needed to buy the rest of our output, and foreigners get to consume it instead via US exports.

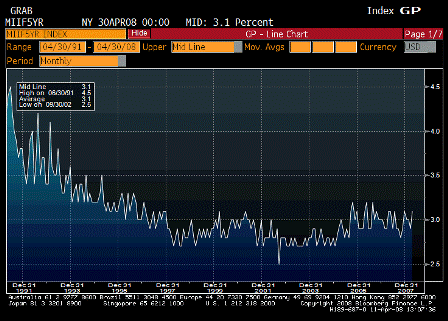
  • 5-10yr inflation expectations move to higher end of recent range

2008-04-11 U. of Michigan 5yr Ahead Inflation Expectations

5yr Ahead Inflation Expectations

Yes, it’s part of the equation, as above, and the FOMC ‘knows’ it can’t allow inflation expectations to elevate.

While the Fed gives the 5 year more weight, it also watches the one year, particularly when it spikes.
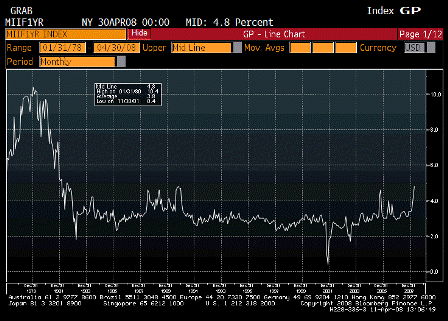
2008-04-11 1yr Inflation Expectations

1 yr Inflation Expectations

In today’s report the one year survey hit 4.8%, they highest since one 4.8% reading in 1990. The only time it’s been higher was during the ‘great inflation’ of the 70’s- early 80’s.

  • Worsening confidence also visible in job leavers component of employment report-% of workers who voluntarily leave their jobs (chart 3). Tends to rise when times are good and vice-versa. When declining, tends to be associated with lower wage growth and core CPI (an important piece of the output gap argument).

Other comments from Michigan survey make from grim reading:

  • There have only been a dozen other surveys that have recorded a lower level of consumer sentiment in the more than fifty-year history of the survey.

  • Consumers expected gains in their nominal incomes of just 1.0% in April, the smallest gain expected in three decades.

  • Three-in-four consumers expected bad times financially in the overall economy during the year ahead, the largest proportion recorded since 1980, and the fourth highest proportion in more than fifty years.

  • A record 41% of all home owners reported that their home had lost value during the past year
  • Just 5% of all consumers expected the unemployment rate to decrease in the year ahead, the smallest proportion ever recorded.

  • Uncertainty about future income and job prospects has had a devastating impact on buying plans, with consumers citing these uncertainties three times as frequently as they did a year ago. Purchase plans for furniture, appliances, home electronics, and similar goods fell to their lowest level since the 1990 recession, with one-third of all consumers specifically mentioning their uncertainty about jobs and incomes as their primary reason. Vehicle buying plans also fell to their lowest level since the 1990 recession, with one-third of all consumers citing uncertainty about jobs and incomes as well as the future price of gasoline.

That’s the Bernanke vision as per his latest congressional testimony- less consumption and more exports and investment. Looks good, feels bad.

2008-03-28 US Economic Releases

2008-03-28 Personal Income

Personal Income (Feb)

Survey 0.3%
Actual 0.5%
Prior 0.3%
Revised n/a

This is what supports the economy longer term and cushions downturns.


2008-03-28 Personal Spending

Personal Spending (Feb)

Survey 0.1%
Actual 0.1%
Prior 0.4%
Revised n/a

Down some, but with personal income remaining firm spending is sustained over the medium term.


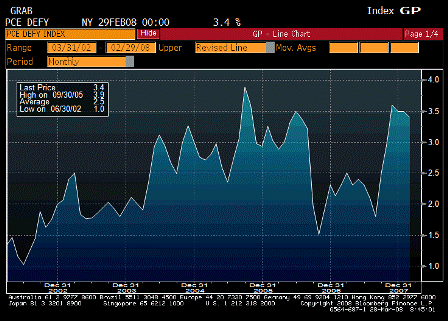
2008-03-28 PCE Deflator YoY

PCE Deflator YoY (Feb)

Survey 3.5%
Actual 3.4%
Prior 3.7%
Revised 3.5%

Not good, and more price increases are in the pipeline.


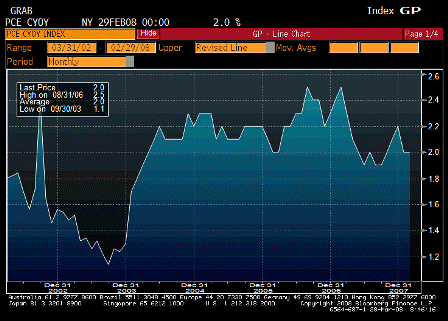
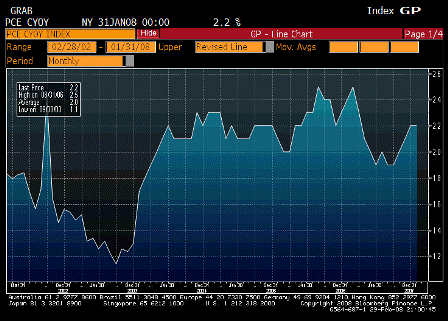
2008-03-28 PCE Core YoY

PCE Core YoY (Feb)

Survey 2.1%
Actual 2.0%
Prior 2.2%
Revised 2.0%

Back to the high end of the Fed’s comfort zone, but with higher prices in the pipeline, it’s looking to move higher.


2008-03-28 U. of Michigan Confidence

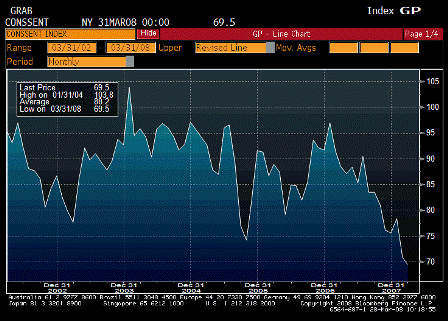
U. of Michigan Confidence (Mar F)

Survey 70.0
Actual 69.5
Prior 70.5
Revised n/a

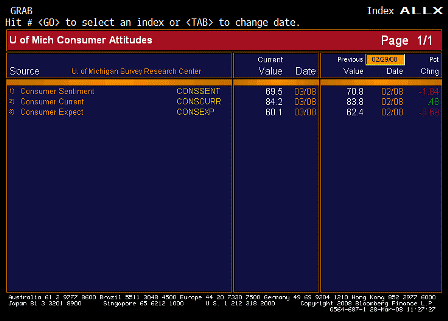
2008-03-28 U. of Michigan Confidence TABLE

U. of Michigan Confidence TABLE

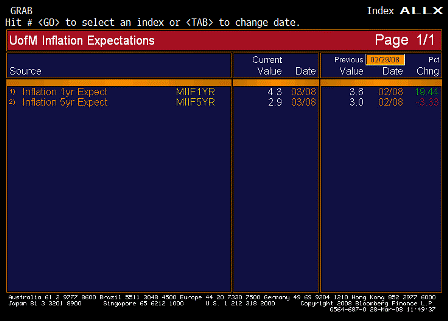
2008-03-28 Inflation Expectations

Inflation Expectations

Current conditions up, expectations down. Sound familiar?

2008-03-14 US Economic Releases

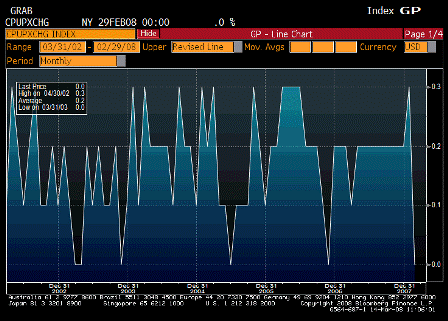
2008-03-14 Consumer Price Index MoM

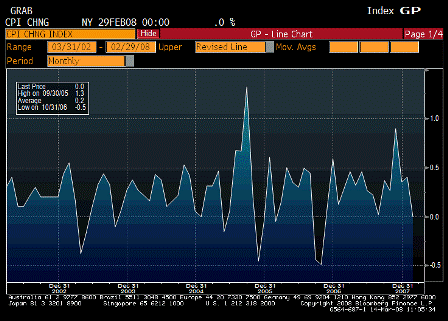
Consumer Price Index MoM (Feb)

Survey 0.3%
Actual 0.0%
Prior 0.4%
Revised n/a

2008-03-14 CPI Ex Food & Energy MoM

CPI Ex Food & Energy MoM (Feb)

Survey 0.2%
Actual 0.0%
Prior 0.3%
Revised n/a

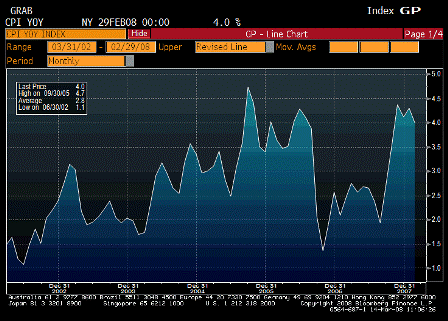
2008-03-14 Consumer Price Index YoY

Consumer Price Index YoY (Feb)

Survey 4.3%
Actual 4.0%
Prior 4.3%
Revised n/a

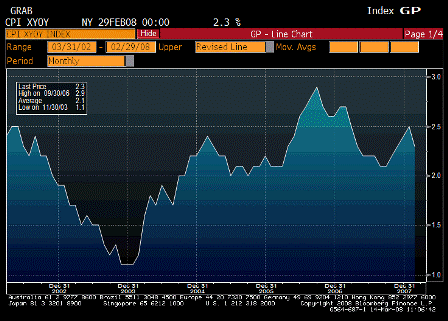
2008-03-14 CPI Ex Food & Energy YoY

CPI Ex Food & Energy YoY (Feb)

Survey 2.4%
Actual 2.3%
Prior 2.5%
Revised n/a

The calm during the storm.  March numbers are already being forecast at up 0.7% for headline CPI.

The individual components have been volatile.

Also, gasoline prices fell 2%.  Retail sales of gasoline was reported down 1% earlier this week.  Together this implies physical demand (gallons sold) went up.


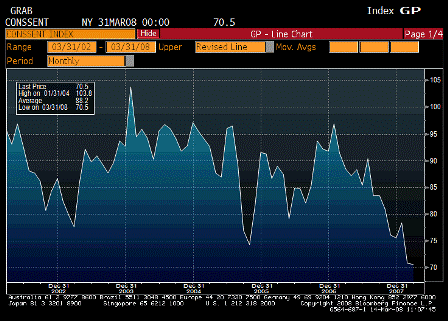
2008-03-14 U. of Michigan Confidence

U. of Michigan Confidence (Mar P)

Survey 69.5
Actual 70.5
Prior 70.8
Revised n/a

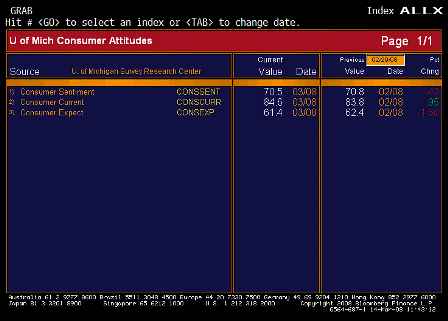
2008-03-14 U. of Michigan TABLE

Current conditions improved, expectations fell.

Inflation expectations one year forward rose from 3.6% to 4.5% which complicates the Fed’s decision on Tuesday.  The 5 year number fell from 3.0% to 2.9% which is somewhat of an offset.

2008-02-29 US Economic Releases

2008-02-29 Personal Income YoY

Personal Income YoY (Jan)

Survey n/a
Actual 4.9
Prior 5.6
Revised n/a

Falling off some. Interest rates are partially responsible, as last I checked households are still net savers and have net interest income.

This is one reason I lean towards the view that lower interest rates tend to slow nominal growth, while higher interest rates support nominal growth.


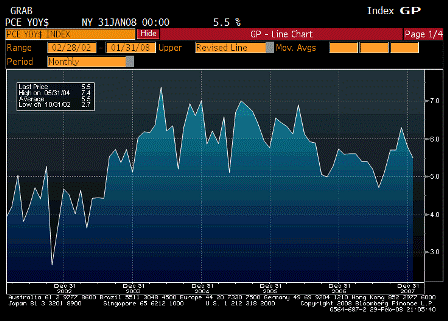
2008-02-29 Personal Consumption Expense Nom$ YoY

Personal Expenditures Nominal$ YoY (Jan)

Survey n/a
Actual 5.5%
Prior 5.8%
Revised n/a

Nominal spending holding up. With our ‘new’ export economy, real spending gives way to exports, and GDP muddles through.


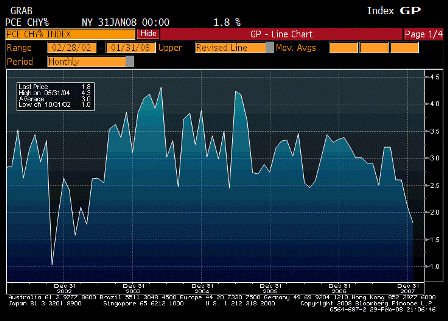
2008-02-29 Personal Consumption Expenditures Chain YoY

Personal Expenditures Chain YoY (Jan)

Survey n/a
Actual 1.8%
Prior 2.1%
Revised n/a

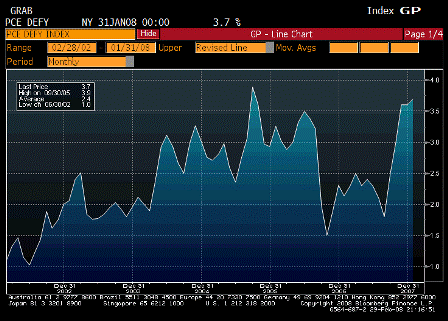
2008-02-29 Personal Consumption Expenditures Price YoY

Personal Expenditure Price YoY (Jan)

Survey n/a
Actual 3.7%
Prior 3.6%
Revised n/a

This is problematic for the Fed.


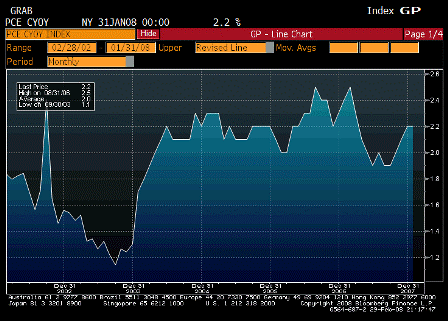
2008-02-29 Personal Consumption Expenditures Core YoY

Personal Expenditure Core YoY (Jan)

Survey n/a
Actual 2.2%
Prior 2.2%
Revised n/a

This is not easy for the Fed to watch, as they worked long and hard to bring it below 2% and back to their comfort zone of 1-2%. Now the concern is how hard it will be to bring down from even higher expected levels if they keep cutting rates.


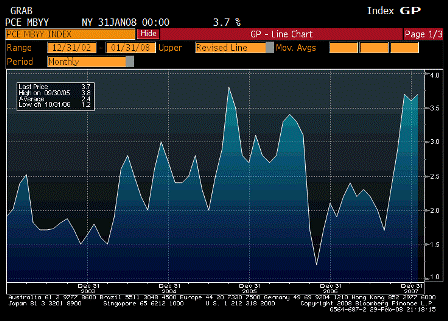
2008-02-29 Personal Consumption Market Based YoY

Personal Consumption Market Based YoY (Jan)

Survey n/a
Actual 3.7%
Prior 3.6%
Revised n/a

As above, this is way too high for comfort.


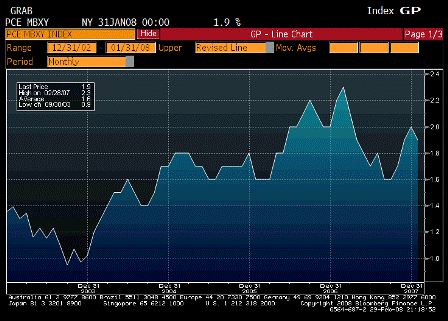
2008-02-29 Personal Consumption Expendatures Market Based Core YoY

Personal Consumption Market Based Core YoY (Jan)

Survey n/a
Actual 1.9%
Prior 2.0%
Revised n/a

Also as above. Ok, but threatening to move higher and be very costly to bring back down.


2008-02-29 PCE Core YoY

PCE Core YoY (Jan)

Survey 2.2%
Actual 2.2%
Prior 2.2%
Revised n/a

As above.


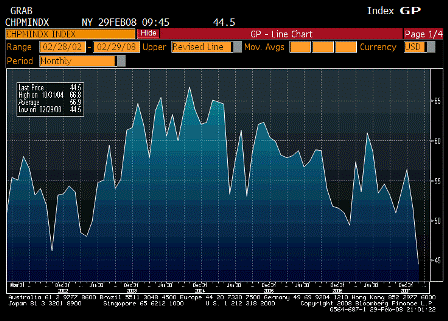
2008-02-29 Chicago Purchasing Manager

Chicago Purchasing Manager (Feb)

Survey 49.5
Actual 44.5
Prior 51.5
Revised n/a

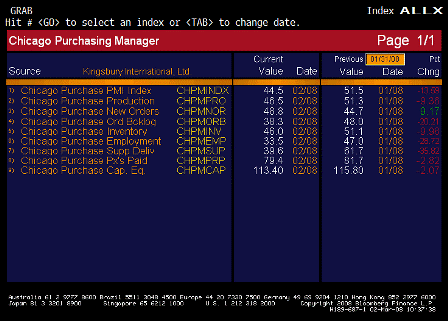
2008-02-29 Chicago Purchasing Manager TABLE

Chicago Purchasing Manager TABLE

Definitely not good, but like ISM, a survey that gets subjective responses, and price components remain high.

New orders up as well.


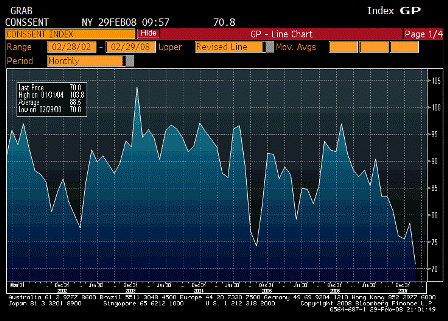
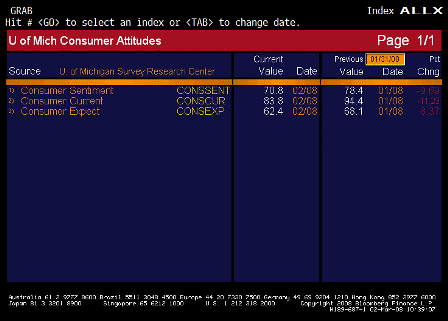
2008-02-29 U. of Michigan Confidence

U. of Michigan Confidence (Feb F)

Survey 70.0
Actual 70.8
Prior 69.6
Revised n/a

2008-02-29 U of Michigan Confidence TABLE

U. of Michigan Confidence TABLE

While better than expected, does not look good.

And one year inflation expectations are up to 3.6%.


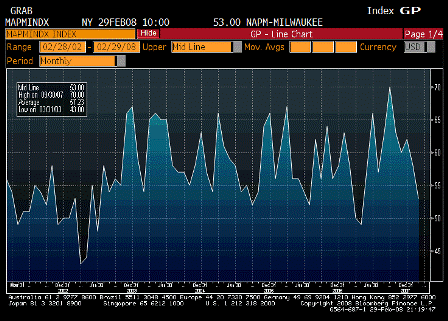
2008-02-29 NAPM Milwaukee

NAPM-Milwaukee (Feb)

Survey n/a
Actual 53.0
Prior 58.0
Revised n/a

Below expectations, but positive. Probably won’t get reported anywhere else..

2008-02-15 US Economic Releases

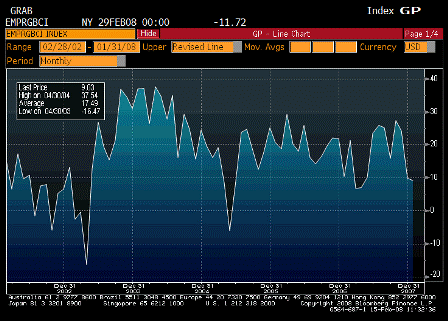
2008-02-15 Empire Manufacturing

Empire Manufacturing (Feb)

Survey 6.5
Actual -11.7
Prior 9.0
Revised n/a

Down, but it has been lower, not yet to previous recession levels.


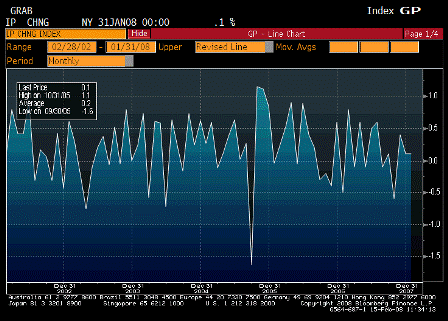
2008-02-15 Industrial Production

Industrial Production (Jan)

Survey 0.1%
Actual 0.1%
Prior 0.0%
Revised 0.1%

Modestly positive, and not at recession levels.


2008-02-15 Capacity Utilization

Capacity Utilization (Jan)

Survey 81.3%
Actual 81.5%
Prior 81.4%
Revised 81.5%

Holding up reasonably well.


2008-02-15 U. of Michigan Confidence

U. of Michigan Confidence (Feb P)

Survey 76.0
Actual 69.6
Prior 78.4
Revised n/a

The CNBC effect keeping expectations down.

One year inflation expectations jumped to 3.7% putting the Fed on high alert.


♥

2008-02-01 US Economic Releases

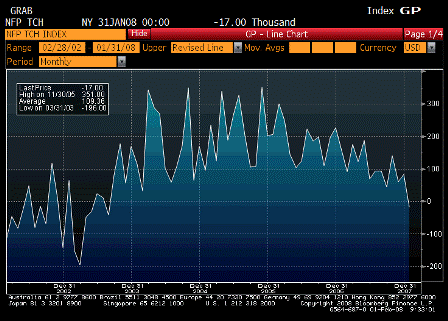
2007-02-01 Change in Nonfarm Payrolls

Change in Nonfarm Payrolls (Jan)

Survey 70K
Actual -17K
Prior 18K
Revised 82K

Last negative number was August – got revised up.

Apart from the unrevised January number, the revised previous numbers don’t look too bad.
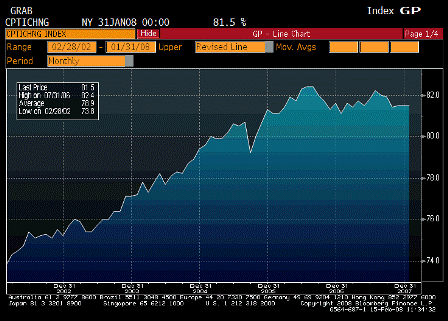
(See following report.)


2008-02-01 Unemployment Rate

Unemployment Rate

Survey 5.0%
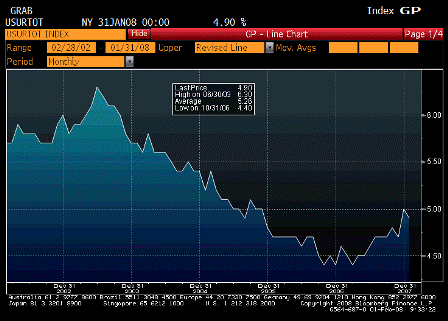
Actual 4.9%
Prior 5.0%
Revised n/a

Slight downtic.

The Fed calls 4.75% full employment.

So, this is close enough.


2008-02-01 Change in Manufacturing Payrolls

Change in Manufacturing Payrolls (Jan)

Survey -20K
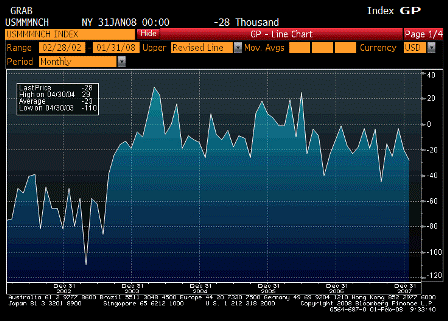
Actual -28K
Prior -31K
Revised -20K

Suspiciously low as a per December durable goods and export numbers.


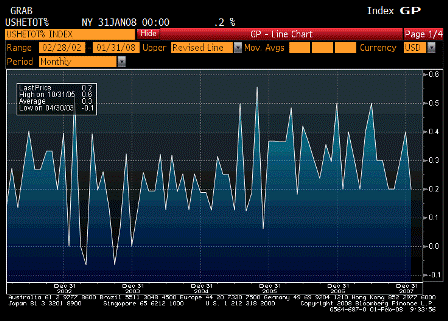
2008-02-01 Average Hourly Earnings MoM

Average Hourly Earnings MoM (Jan)

Survey 0.3%
Actual 0.2%
Prior 0.4%
Revised n/a

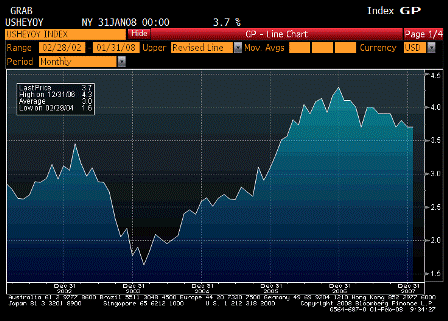
2008-02-01 Average Hourly Earnings YoY

Average Hourly Earnings YoY (Jan)

Survey 3.9%
Actual 3.7%
Prior 3.7%
Revised n/a

Seems to be under control though a weak productivity number could raise unit labor costs.


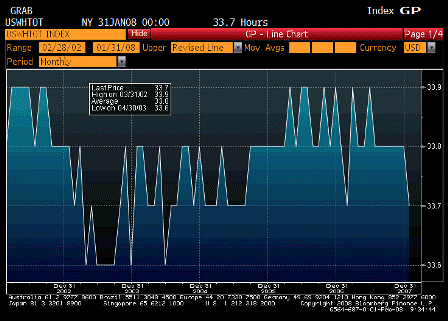
2008-02-01 Average Weekly Hours

Average Weekly Hours

Survey 33.8
Actual 33.7
Prior 33.8
Revised n/a

Down a bit. Fairly steady.


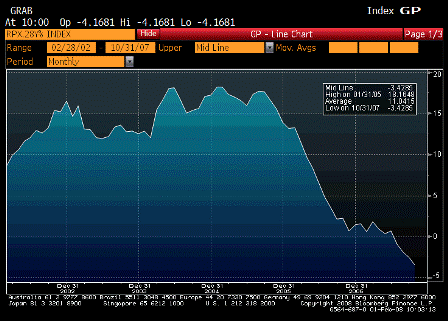
2008-02-01 RPX Composite 28dy YoY

RPX Composite 28dy YoY (Nov)

Survey n/a
Actual -4.1681
Prior -3.4285
Revised n/a

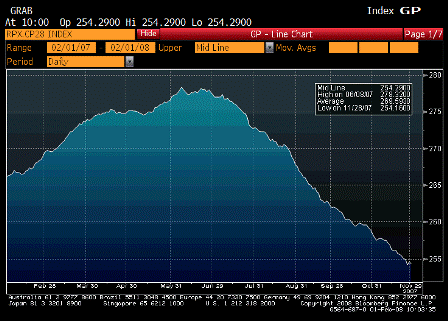
small-2008-02-01-rpx-composite-28dy-index.gif

RPX Composite 28dy Index (Nov)

Survey n/a
Actual 254.3
Prior 255.5
Revised 258.9

November housing was weak.


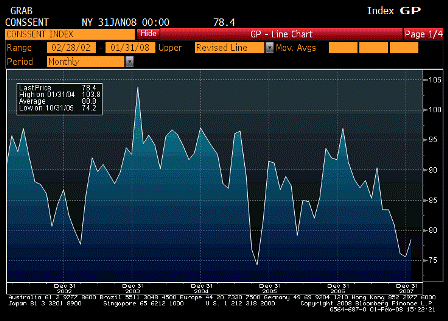
2008-02-01 U. of Michigan Confidence

U. of Michigan Confidence (Jan F)

Survey 79.0
Actual 78.4
Prior 80.5
Revised n/a

Not bad.
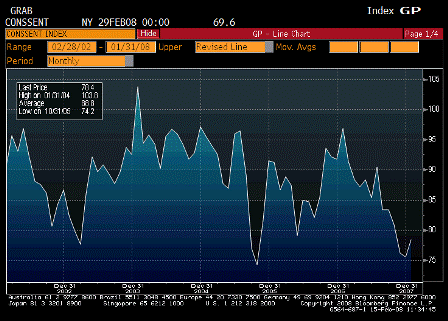
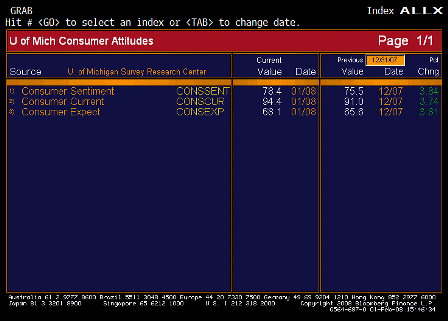
2008-02-01 U. of Michigan TABLE

Both current and expected improved.
U. of Michigan TABLE

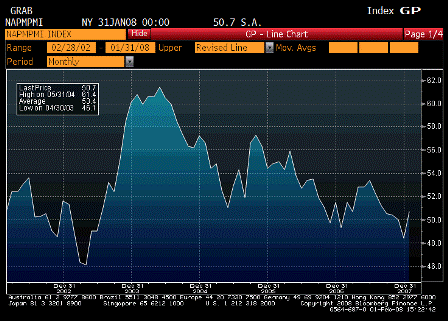
2008-02-01 ISM Manufacturing

ISM Manufacturing (Jan)

Survey 47.3
Actual 50.7
Prior 47.7
Revised 48.4

Back to growth mode.


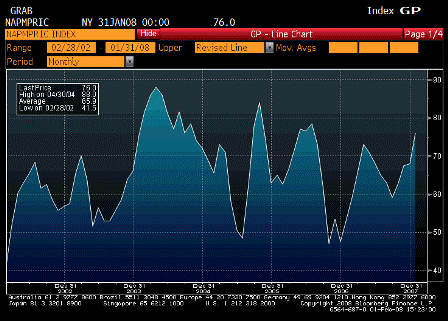
2008-02-01 ISM Prices Paid

ISM Prices Paid (Jan)

Survey 68.0
Actual 76.0
Prior 68.0
Revised n/a

Inflation ripping here.


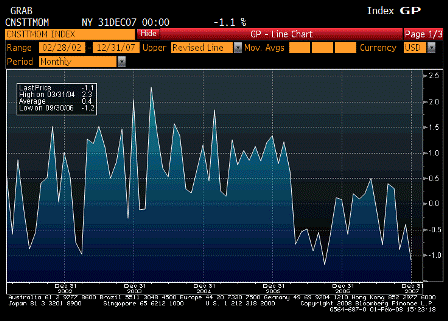
2008-02-01 Construction Spending

Construction Spending MoM (Dec)

Survey -0.5%
Actual -1.1%
Prior 0.1%
Revised -0.4%

Still bumping along the bottom.

2008-01-18 US Economic Releases

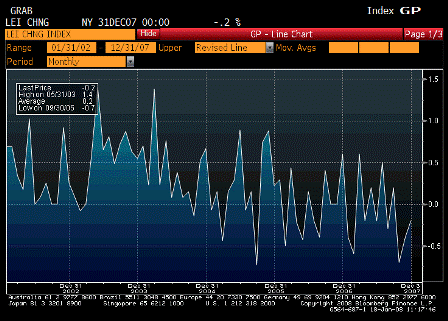
2008-01-18 Leading Indicators

Leading Indicators (Dec)

Survey -0.1%
Actual -0.2%
Prior -0.4%
Revised n/a

Down some, but not terrible.


2008-01-18 U. of Michigan Confidence

U. of Michigan Confidence (Jan P)

Survey 74.5
Actual 80.5
Prior 75.5
Revised n/a

Up, but not great – not yet the stuff of recession.


2008-01-18 U. of Michigan Confidence TABLE

U. of Michigan Confidence TABLE

Note how high the current levels are – no recession there.

It’s expectations that are weak – the CNBC effect.

And inflation expectations remain higher than the fed’s comfort level.


♥

2007-12-21 US Economic Releases

2007-12-21 Personal Income

Personal Income (Nov)

Survey 0.5%
Actual 0.4%
Prior 0.2%
Revised n/a

OK number.


2007-12-21 Personal Spending

Personal Spending (Nov)

Survey 0.7%
Actual 1.1%
Prior 0.2%
Revised 0.4%

Nice bounce back from a low number also revised up. Makes the two month average about 0.75%. This will cause further upward revisions of Q4 GDP.


2007-12-21 PCE Deflator YoY

PCE Deflator YoY (Nov)

Survey 3.4%
Actual 3.6%
Prior 2.9%
Revised 3.0%

Back to my favorite quote from September, ‘If the fed doesn’t care about inflation, why should I?’

Wonder what it takes for the fed to care?


2007-12-21 PCE Core MoM

PCE Core MoM (Nov)

Survey 0.2%
Actual 0.2%
Prior 0.2%
Revised n/a

2007-12-21 PCE Core YoY

PCE Core YoY (Nov)

Survey 2.0%
Actual 2.2%
Prior 1.9%
Revised 2.0%

Core at or though fed’s upper bound.


2007-12-21-u-of-michigan-confidence.gif

U. of Michigan Confidence (Dec F)

Survey 74.5
Actual 75.5
Prior 74.5
Revised 2.0%

People still watching CNBC.


2007-12-21 Inflation Expecations - 1 Year Ahead

Inflation Expectations – 1 Year Ahead

Survey n/a
Actual 3.4%
Prior 3.2%
Revised n/a

One of the fed’s indicators – don’t like this action as they think once it elevates it’s too late.


2007-12-21 Inflation Expecations - 5 Years Ahead

Inflation Expectations – 5 Years Ahead

Survey n/a
Actual 3.1%
Prior 2.8%
Revised n/a

As above – once it elevates it’s too late.


♥