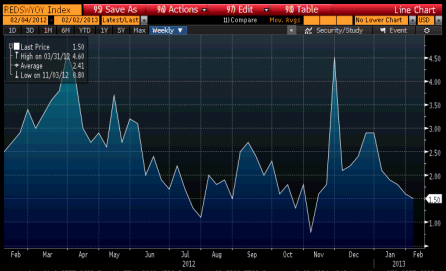
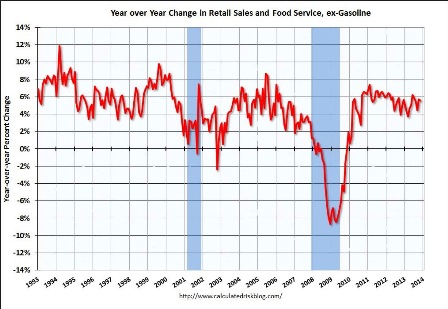
Looks like the general drift to lower growth rates may still be in progress.
Headline retail sales year-over-year with 3 mo moving average:
Full size image
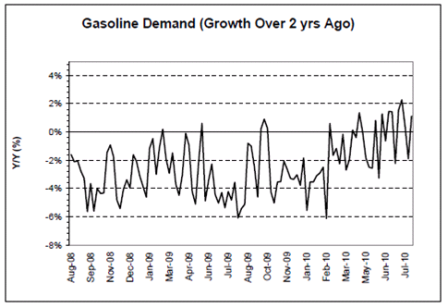
Longer term chart:
Full size image
And auto sales chart shows how they sagged during the October govt. shutdown with lost sales subsequently recovered, but on balance relatively flat for 2013:
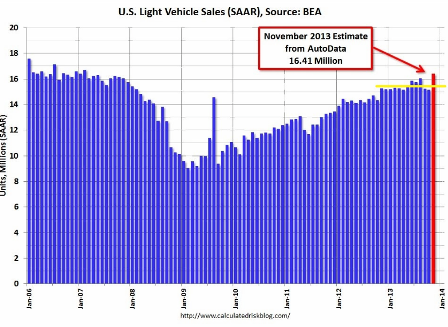
Full size image
Lots of noise in claims data this time of year, but, again, claims are about separations, not new hires, though correlation has been pretty good:
Full size image