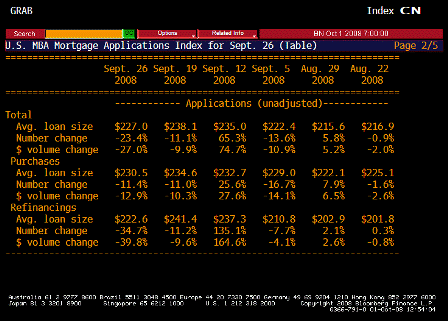
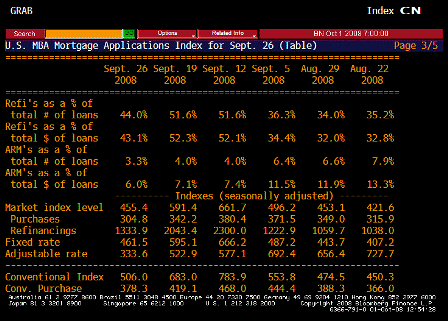
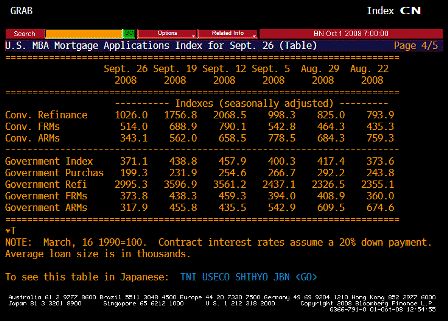
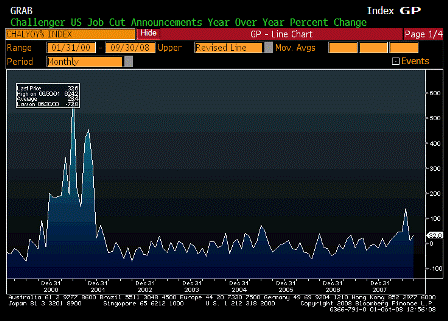
- MBA Mortgage Applications (Released 7:00 EST)
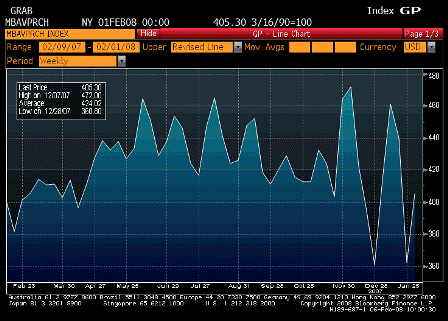
- MBA Purchasing Applications (Released 7:00 EST)
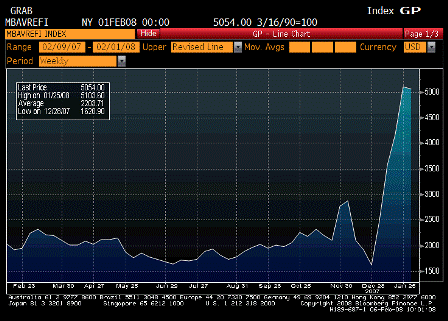
- MBA Refinancing Applications (Released 7:00 EST)
- MBA TABLE 1 (Released 7:00 EST)
- MBA TABLE 2 (Released 7:00 EST)
- MBA TABLE 3 (Released 7:00 EST)
- MBA TABLE 4 (Released 7:00 EST)
- Empire State Manufacturing Survey (Released 8:30 EST)
- Empire State Manufacturing Survey ALLX 1 (Released 8:30 EST)
- Empire State Manufacturing Survey ALLX 2 (Released 8:30 EST)
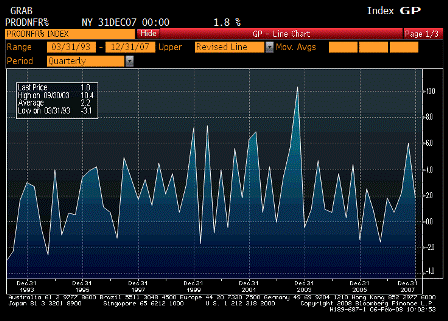
- Producer Price Index MoM (Released 8:30 EST)
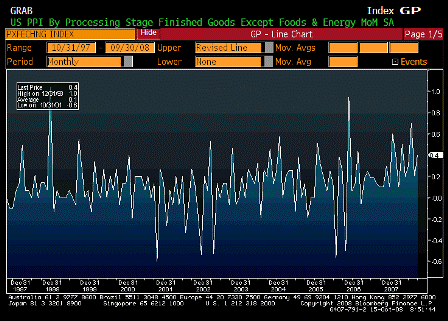
- PPI Ex Food and Energy MoM (Released 8:30 EST)
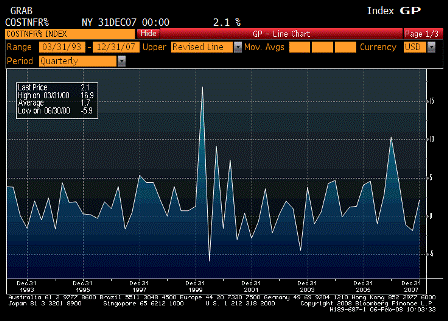
- Producer Price Index YoY (Released 8:30 EST)
- PPI Ex Food and Energy YoY (Released 8:30 EST)
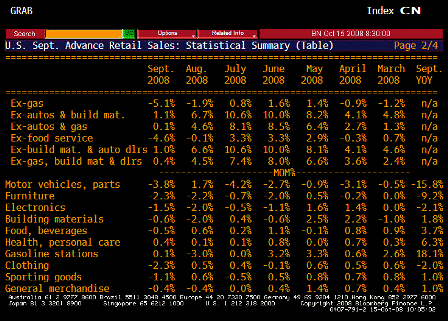
- Advance Retail Sales MoM (Released 8:30 EST)
- Advance Retail Sales YoY (Released 8:30 EST)
- Retail Sales Less Autos MoM (Released 8:30 EST)
- Advance Retail Sales TABLE 1 (Released 8:30 EST)
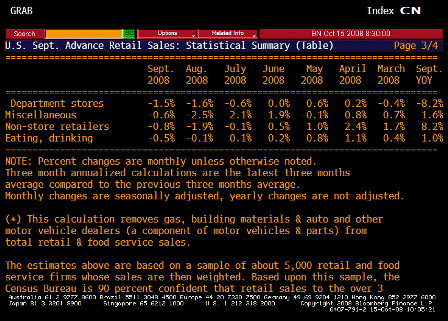
- Advance Retail Sales TABLE 2 (Released 8:30 EST)
- Advance Retail Sales TABLE 3 (Released 8:30 EST)
- Business Inventories MoM (Released 10:00 EST)
- Business Inventories YoY (Released 10:00 EST)
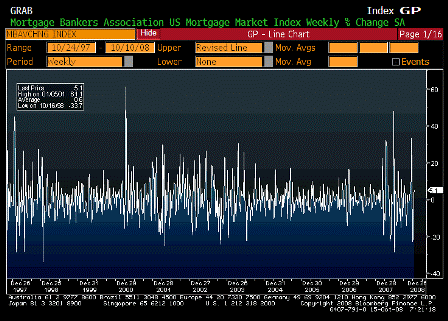
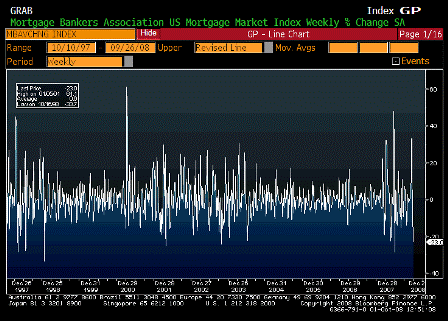
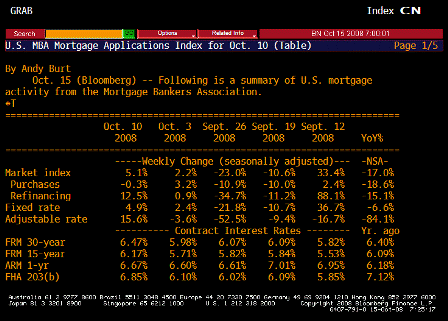
MBA Mortgage Applications (Oct 10)
| Survey | n/a |
| Actual | 5.1% |
| Prior | 2.2% |
| Revised | n/a |
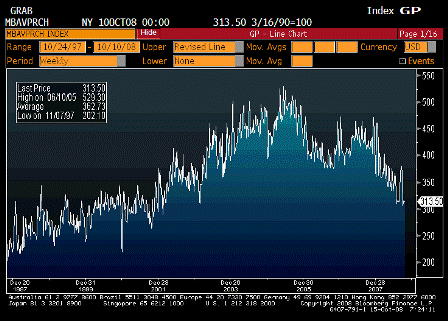
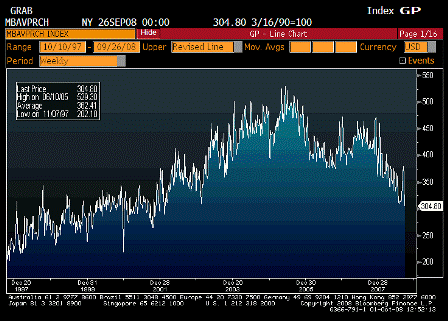
MBA Purchasing Applications (Oct 10)
| Survey | n/a |
| Actual | 313.50 |
| Prior | 314.50 |
| Revised | n/a |
Down a tad, but the lower band of the range holding.
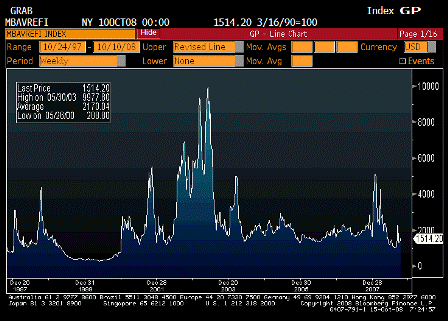
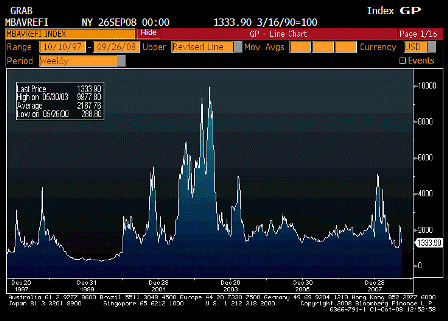
MBA Refinancing Applications (Oct 10)
| Survey | n/a |
| Actual | 1514.20 |
| Prior | 1345.80 |
| Revised | n/a |
Refi machine seems to be functioning.
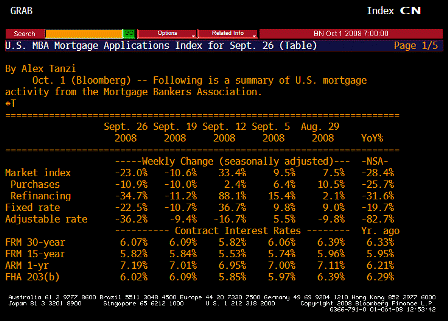
MBA TABLE 1 (Oct 10)
MBA TABLE 2 (Oct 10)
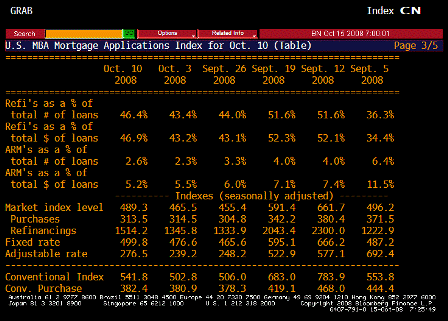
MBA TABLE 3 (Oct 10)
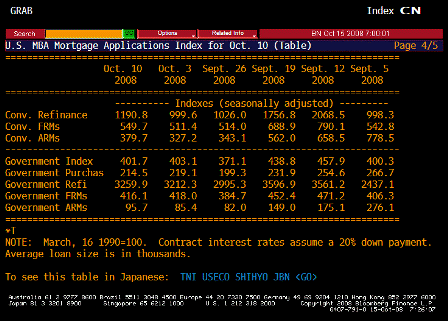
MBA TABLE 4 (Oct 10)
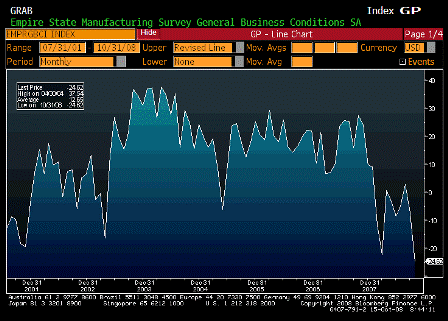
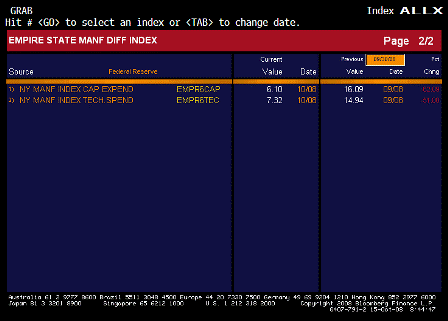
Empire State Manufacturing Survey (Oct)
| Survey | -10.0 |
| Actual | -24.6 |
| Prior | -7.4 |
| Revised | n/a |
Much lower than expected as the world economy slows.
Karim says:
- Drops from -7.4 to record low of -24.6.
- Orders drop 25 points, shipments drop 9 points, workweek drops 4 points.
- Employment modest improvement from -4.6 to -3.7
- Bulk of labor force adjustment seems to be in hours.
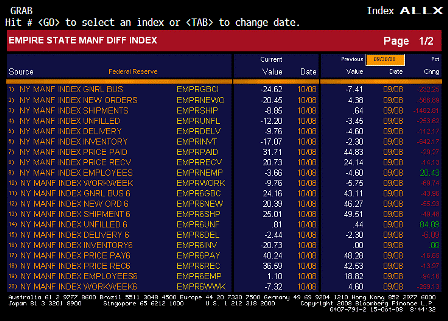
Empire State Manufacturing Survey ALLX 1 (Oct)
Empire State Manufacturing Survey ALLX 2 (Oct)

Producer Price Index MoM (Sep)
| Survey | -0.4% |
| Actual | -0.4% |
| Prior | -0.9% |
| Revised | n/a |
As expected.
Karim says:
- Headline -0.4% and core +0.4%
- Intermediate stage -1.2% and core -0.3%
- Crude stage -7.9% and core -9.4%
PPI Ex Food and Energy MoM (Sep)
| Survey | 0.2% |
| Actual | 0.4% |
| Prior | 0.2% |
| Revised | n/a |
Higher than expected.
Producer Price Index YoY (Sep)
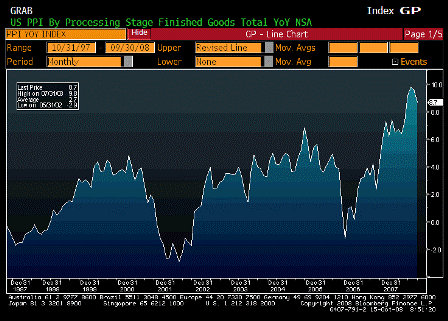
| Survey | 8.6% |
| Actual | 8.7% |
| Prior | 9.6% |
| Revised | n/a |
Still up big year over year.
PPI Ex Food and Energy YoY (Sep)
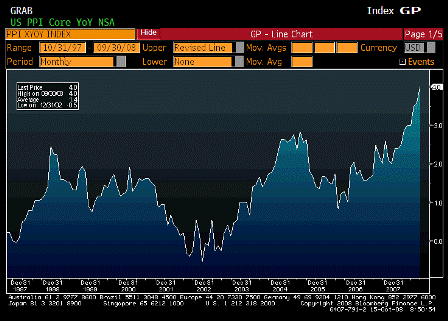
| Survey | 3.8% |
| Actual | 4.0% |
| Prior | 3.6% |
| Revised | n/a |
This is breaking out as well.
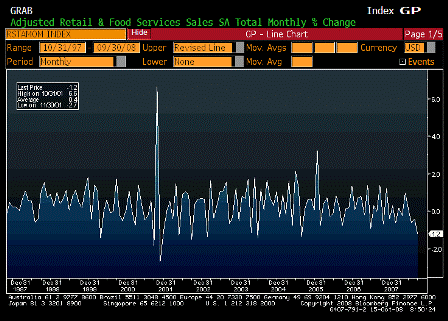
Advance Retail Sales MoM (Sep)
| Survey | -0.7% |
| Actual | -1.2% |
| Prior | -0.3% |
| Revised | -0.4% |
Lowe than expected partly due to lower gasoline prices.
Karim says:
- -1.2% m/m and -0.6% m/m ex-autos; modest downward revisions to back months.
- -1.3% ex-gas.
- All you need to know is only 2 components to rise m/m were health care and gasoline!
- Furniture and clothing were each down 2.3%; the drop in furniture the most since Feb 2003.
- And this before the 15% month to date decline in equities in October.
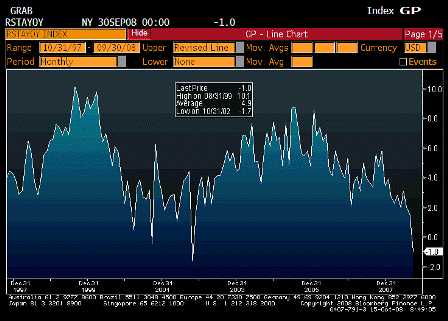
Advance Retail Sales YoY (Sep)
| Survey | n/a |
| Actual | -1.0% |
| Prior | 1.5% |
| Revised | n/a |
Looking like recession levels.
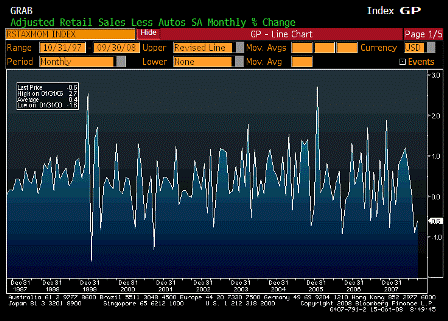
Retail Sales Less Autos MoM (Sep)
| Survey | -0.2% |
| Actual | -0.6% |
| Prior | -0.7% |
| Revised | -0.9% |
Also, lower than expected.
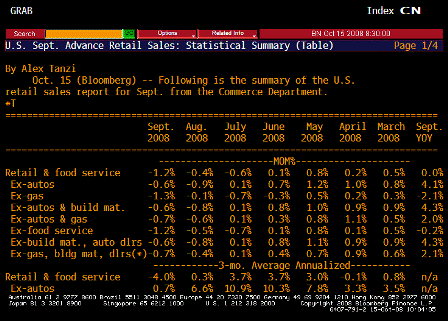
Advance Retail Sales TABLE 1 (Sep)
Advance Retail Sales TABLE 2 (Sep)
Advance Retail Sales TABLE 3 (Sep)
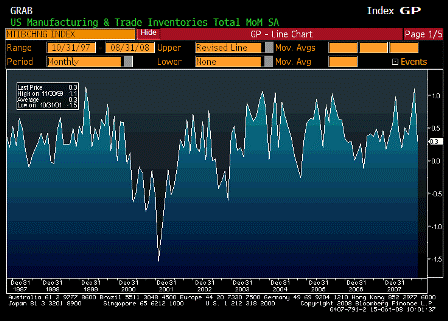
Business Inventories MoM (Aug)
| Survey | 0.5% |
| Actual | 0.3% |
| Prior | 1.1% |
| Revised | n/a |
A little lower than expected.
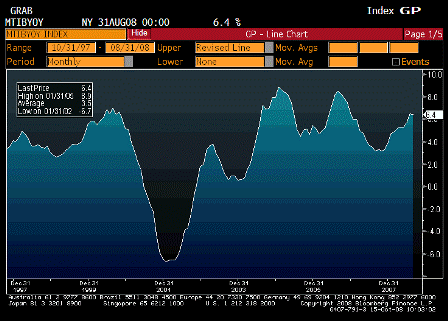
Business Inventories YoY (Aug)
| Survey | n/a |
| Actual | 6.4% |
| Prior | 6.5% |
| Revised | n/a |
Working their way higher but not out of control.
[top]


