Deficit up = Savings up


[Skip to the end]

Shoppers’ New Frugality Hurts Business

by Kelly Evans

Mar 3 (WSJ) — U.S. consumers increased their spending in January, while the savings rate reached its highest level in nearly 14 years amid a deepening recession.

Does that ring a bell?

The last time savings was this high was in 1995 when the deficit was also about 5% of GDP.

And the lows in savings that caused the subsequent collapse were in the late 1990’s when the government was in surplus.

The national income accounting way to say it is:

Government deficit= non government savings of financial assets.

Personal consumption rose 0.6% compared to the month before, the Commerce Department said Monday. In December, spending fell by an unrevised 1.0%, while November spending fell 0.8%.

Personal income increased at a seasonally adjusted rate of 0.4% in January, with December income falling by an unrevised 0.2%.

Incomes were supported by government increases due to CPI adjustments and the like. This is an underlying force that continuously supports nominal incomes at ever higher levels over time.

When savings rates reach desired levels and incomes are growing however modestly, spending resumes.

With more deficit spending/more savings and income on the way there is good reason to believe consumption will at least flatten and likely begin to rise.


[top]

Mosler Health Care Proposal


[Skip to the end]

Mosler Health Care Proposal

  1. Government funding for a full time, $8 per hour job that includes full federal health care coverage for the worker and dependents.

    This immediately triggers market forces that will result in all businesses providing health care benefits as a matter of competition.
  2. As a matter of economics and public purpose it is counter productive for health care to be a marginal cost of production.

    No economist will disagree with this. Unless going to work makes one more prone to needing health care, making the cost
    a marginal cost of production distorts the price structure and results in sub optimal outcomes.

    Therefore government should fund at least 90% of health care costs paid for by businesses.
  3. Long term vision subject to revised details:
    • Everyone gets a ‘medical debit card’ with perhaps $5000 in it to be used for qualifying medical expenses (including dental) for the year.
    • Expenses beyond that are covered by catastrophic insurance.
    • At the end of the year, the debit card holder gets a check for the unused balance on the card, up to $4,000, with the $1,000 to be spent on preventative measures not refundable.
    • The next year, the cards are renewed for an additional $5,000.
    • Advantages:
      1. Doctor/patient time doubled as doctor/insurance company time is eliminated.
      2. The doctor must discuss the diagnosis and options regarding drugs, treatments, and costs with the patient rather than an insurance company.
      3. Individuals have a strong incentive to keep costs down.
      4. Doubling the time doctors have available for patients increases capacity and service without increasing real costs.
      5. Total nominal cost of approx. $1.5 trillion ($5,000×300 million people) is about 10% of GDP which is less than being spent today, so even when catastrophic costs are added the numbers are not financially disruptive and can easily be modified.
      6. Eliminates medical costs from businesses, removing price distortions and medical legacy costs.
      7. May obviate the need for Medicare and other current programs.
      8. Eliminates issues regarding receivables and bad debt for hospitals and doctors.
      9. Eliminates the majority of administrative costs for the nation as a whole for the current system.
        Patients can ‘shop’ for medical services and prices as desired.
    • Disadvantages: Those more in need of the rebate at the end of the year may elect to forgo treatment beyond the $1,500 not subject to the rebate.
    • Doctors may be able to more easily convince patients of unneeded treatments and expensive drugs vs insurance companies.


[top]

Re: February Economic Summary in Graphs


[Skip to the end]

(email exchange)

Excellent summary of current conditions, thanks!

And gasoline consumption and inventories up year over year with a massive general output gap- so much for the presumed ‘demand destruction?’

q1 looking down 10%- and that’s with the government sector flat or maybe up some, so the rest is down that much more.

q3 forecasts now flat to up some as the fiscal adjustments unfold, including the ‘automatic stabilizers’ of falling revenues and rising transfer payments.

% gains from these levels will be dramatic without making all that much of dent in reducing the output gap.

Unless of course the mainstream reduces the output gap by declaring the natural rate of unemployment has gone up.

Like they always have in the past.

It’s all a staggering loss of real output and a larger loss in quality of life, with Congress fully responsible.

The current fiscal adjustment could have come right after it all went bad in July.

Clearly the 170 billion package last year ‘worked’ as q2 came in at over 2% real growth.

All they needed to do was do it each quarter.

That would have added up to about $700 billion per year and would probably have sustained at least modest levels of output and employment.

>   
>   On Sat, Feb 28, 2009 at 7:41 PM, Russell wrote:
>   

February Economic Summary in Graphs

Feb 28 (Calculated Risk) — Here is a collection of 20 real estate and economic graphs from February …
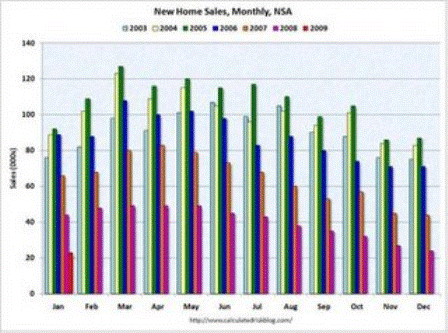


The first graph shows monthly new home sales (NSA – Not Seasonally Adjusted).

Note the Red column for January 2009. This is the lowest sales for January since the Census Bureau started tracking sales in 1963. (NSA, 23 thousand new homes were sold in January 2009).

From: Record Low New Home Sales in January
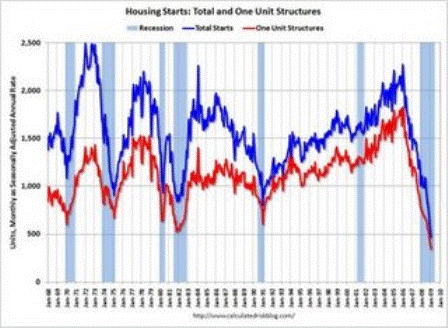


Total housing starts were at 464 thousand (SAAR) in January, by far the lowest level since the Census Bureau began tracking housing starts in 1959.

Single-family starts were at 347 thousand in January; also the lowest level ever recorded (since 1959).

From: Housing Starts at Another Record Low


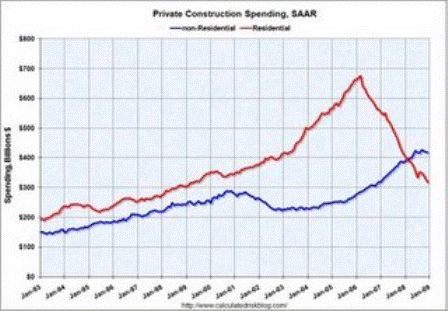
This graph shows private residential and nonresidential construction spending since 1993.

Residential construction spending is still declining, and now nonresidential spending has peaked and will probably decline sharply over the next 18 months.

From: Construction Spending: Private Nonresidential has Peaked


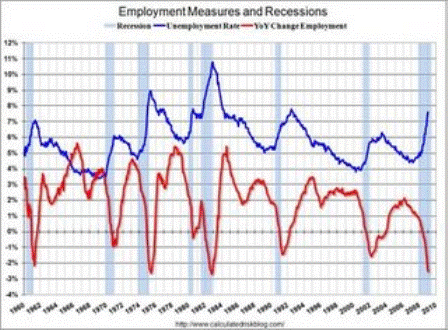
This graph shows the unemployment rate and the year over year change in employment vs. recessions.

Nonfarm payrolls decreased by 598,00 in January, and the annual revision reduced employment by another 311,000 in 2008. The economy has lost almost 2.5 million jobs over the last 5 months!

The unemployment rate rose to 7.6 percent; the highest level since June 1992.

Year over year employment is now strongly negative (there were 3.5 million fewer Americans employed in Jan 2008 than in Jan 2007).

From: January Employment Report: 598,000 Jobs Lost, Unemployment Rate 7.6%


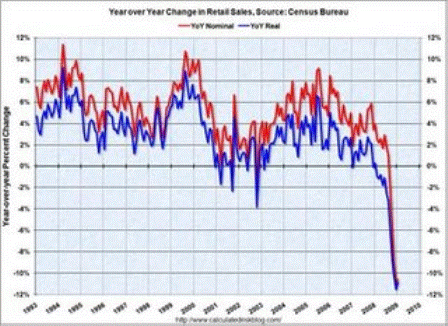
This graph shows the year-over-year change in nominal and real retail sales since 1993.

Although the Census Bureau reported that nominal retail sales decreased 10.6% year-over-year (retail and food services decreased 9.7%), real retail sales declined by 10.9% (on a YoY basis). The YoY change decreased slightly from last month.

From: Retail Sales Increase Slightly in January


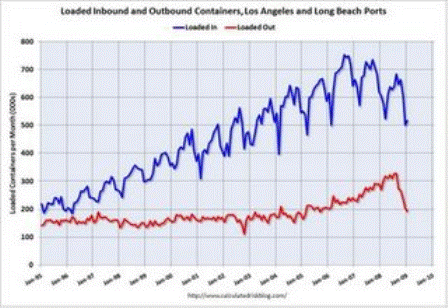
This graph shows the combined loaded inbound and outbound traffic at the ports of Long Beach and Los Angeles in TEUs (TEUs: 20-foot equivalent units or 20-foot-long cargo container).

Inbound traffic was 14% below last January. This slowdown in imports (inbound traffic to the U.S.) is hitting Asian countries hard. There was a slight increase from December to January, but that appears to be mostly seasonal (the data is NSA).

For the LA area ports, outbound traffic continued to decline in January, and was 28% below the level of January 2008. Export traffic is now at about the same level as in 2005.

From: LA Area Ports: Exports Decline in January


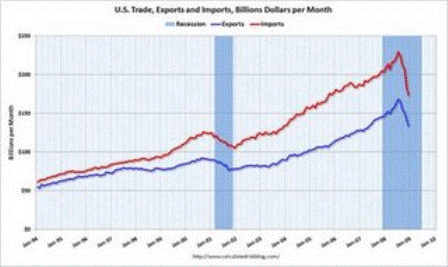
The first graph shows the monthly U.S. exports and imports in dollars through December 2008. The recent rapid decline in foreign trade continued in December. Note that a large portion of the decline in imports is related to the fall in oil prices – but not all.

From: U.S. Trade: Exports and Imports Decline Sharply


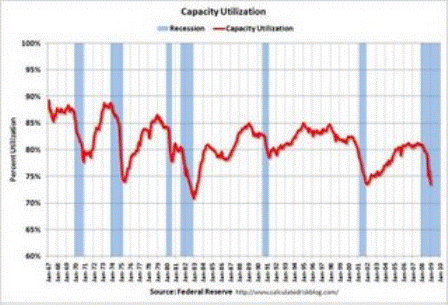
The Federal Reserve reported that industrial production fell 1.8 percent in January, and output in January was 10.0% below January 2008. The capacity utilization rate for total industry fell to 72.0%, the lowest level since 1983.

The significant decline in capacity utilization suggests less investment in non-residential structures for some time.

From: Capacity Utilization and Industrial Production Cliff Diving


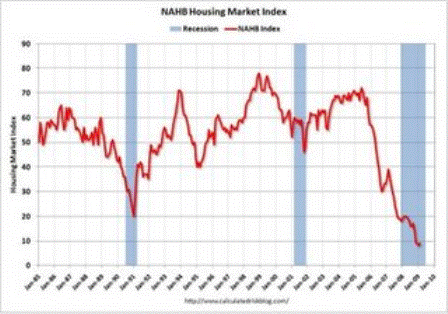
This graph shows the builder confidence index from the National Association of Home Builders (NAHB).

The housing market index (HMI) increased slightly to 9 in February from the record low of 8 set in January.

From: NAHB Housing Market Index Near Record Low


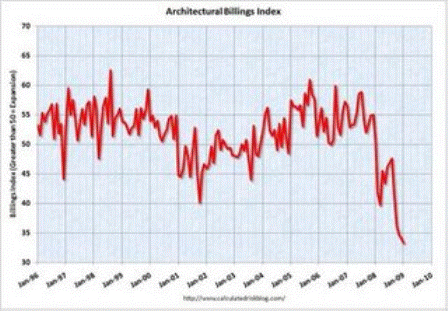
The American Institute of Architects (AIA) reported the January ABI rating was 33.3, down from the 34.1 mark in December (any score above 50 indicates an increase in billings).

From: Architecture Billings Index Hits Another Record Low


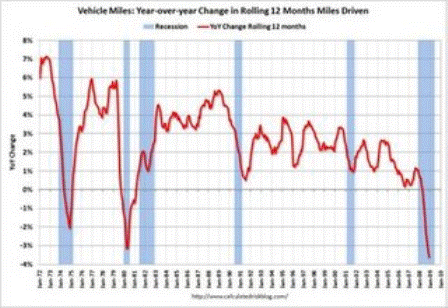
This graph shows the annual change in the rolling 12 month average of U.S. vehicles miles driven. Note: the rolling 12 month average is used to remove noise and seasonality.

By this measure, vehicle miles driven are off 3.6% Year-over-year (YoY); the decline in miles driven is worse than during the early ’70s and 1979-1980 oil crisis. As the DOT noted, miles driven in December 2008 were 1.6% less than December 2007, so the YoY change in the rolling average may start to increase.

From: U.S. Vehicle Miles Driven Off 3.6% in 2008


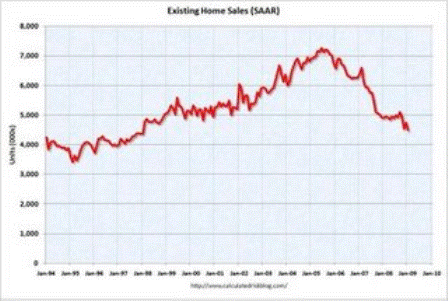
This graph shows existing home sales, on a Seasonally Adjusted Annual Rate (SAAR) basis since 1993.

Sales in January 2009 (4.49 million SAAR) were 5.4% lower than last month, and were 8.6% lower than January 2008 (4.91 million SAAR).

From: More on Existing Home Sales (and Graphs)


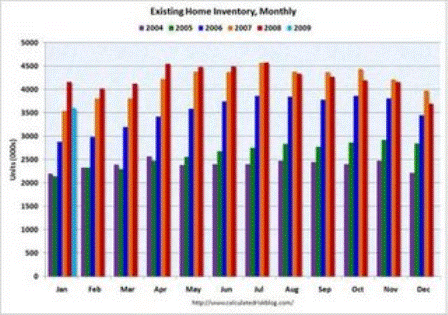
This graph shows inventory by month starting in 2004. Inventory levels were flat for years (during the bubble), but started increasing at the end of 2005.

Inventory levels increased sharply in 2006 and 2007, but have been close to 2007 levels for most of 2008. In fact inventory for the last five months was below the levels of last year. This might indicate that inventory levels are close to the peak for this cycle.

From: More on Existing Home Sales (and Graphs)


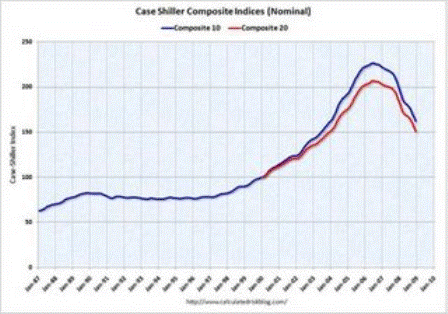
This graph shows the nominal Composite 10 and Composite 20 indices (the Composite 20 was started in January 2000).

The Composite 10 index is off 28.3% from the peak.

The Composite 20 index is off 27.0% from the peak.

From: Case-Shiller: House Prices Decline Sharply in December


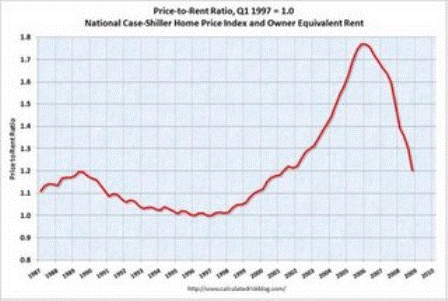
This graph shows the price to rent ratio (Q1 1997 = 1.0) for the Case-Shiller national Home Price Index. For rents, the national Owners’ Equivalent Rent from the BLS is used.

Looking at the price-to-rent ratio based on the Case-Shiller index, the adjustment in the price-to-rent ratio is probably 75% to 85% complete as of Q4 2008 on a national basis. This ratio will probably continue to decline.

However it now appears rents are falling too (although this is not showing up in the OER measure yet) and this will impact the price-to-rent ratio.

From: House Prices: Real Prices, Price-to-Rent, and Price-to-Income


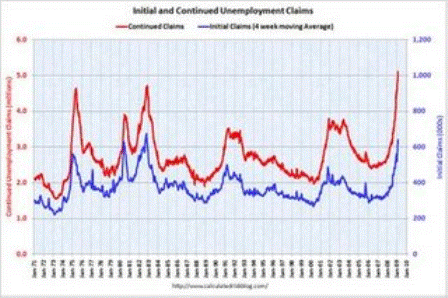
This graph shows weekly claims and continued claims since 1971.

The four week moving average is at 639,000 the highest since 1982.

Continued claims are now at 5.11 million – another new record (not adjusted for population) – above the previous all time peak of 4.71 million in 1982.

From: Weekly Claims: Continued Claims Over 5 Million


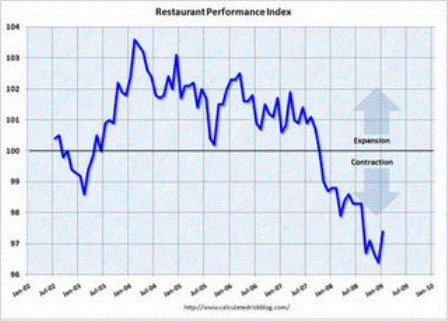
“The Association’s Restaurant Performance Index (RPI) – a monthly composite index that tracks the health of and outlook for the U.S. restaurant industry – stood at 97.4 in January, up 1.0 percent from December’s record low level of 96.4.”

From: Restaurant Performance Index Rebounds Slightly


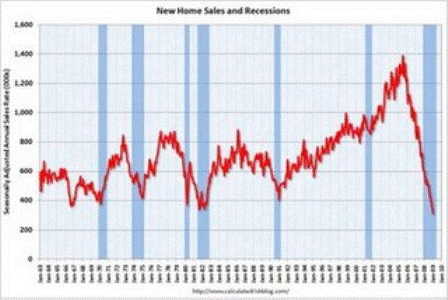
This graph shows New Home Sales vs. recessions for the last 45 years. New Home sales have fallen off a cliff.

From: Record Low New Home Sales in January


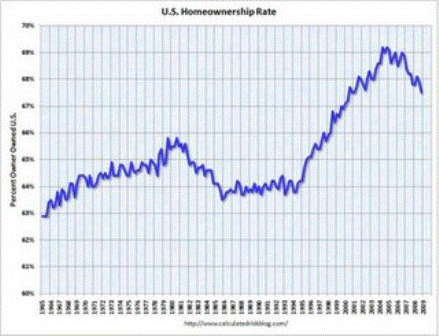
The homeownership rate decreased slightly to 67.5% and is now back to the levels of late 2000.

Note: graph starts at 60% to better show the change.

From: Q4: Homeownership Rate Declines to 2000 Level


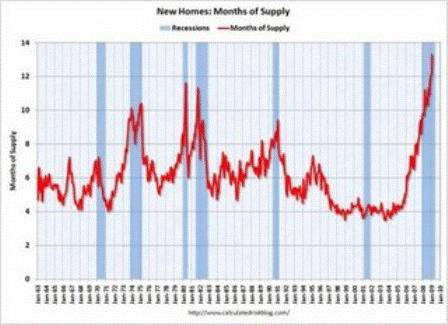
The months of supply is at an all time record 13.3 months in January.

From: Record Low New Home Sales in January

[top]

Gasoline consumption up year over year


[Skip to the end]

All the way to the bottom of the recession and gasoline demand up year over year.

The sell off in price still looks to me like it was all due to the Great Mike Masters Inventory Liquidation triggered by his efforts last summer.

Prices are now heading up with inventories in short supply, a trillion dollar fiscal adjustment in the pipeline, and no policy to directly reduce fuel consumption.

Crude prices jump as US gasoline demand rises

Feb 25 (Xinhua) — Crude prices jumped Wednesday after a U.S. government report showing demand for gasoline is on the rise.

The Energy Department’s Energy Information Administration report said crude inventories rose by 700,000 barrels to 351.3 million barrels. Analysts expected crude stocks would grow by 2.25 million barrels.

Gasoline inventories slipped by 3.4 million barrels, or 1.6 percent, to 215.3 million barrels, which is 7.6 percent below year-ago levels.

Meanwhile, gasoline demand was up 1.7 percent, compared with the same period last year to an average of 9 million barrels per day.


Light, sweet crude for April delivery was up 2.54 U.S. dollars to settle at 42.50 dollars on the New York Mercantile Exchange.

Brent prices rose 1.79 dollars to settle at 44.29 dollars a barrel on the ICE Futures exchange in London.


[top]

California housing data


[Skip to the end]

Quote from Data Quick:

Record January sales totals in Perris, Temecula, Victorville and Fontana in the Inland Empire. Palmdale in Los Angeles County posted a record total in January, and record January sales totals also were achieved in Chula Vista and Lemon Grove in San Diego County and Oxnard in Ventura County.

I just checked the numbers from the 2005-2006 highs per the C.A.R. and compared to today’s release.

California housing Data

City 12/05-06 1/09 % decline
Palmdale 377K 135K 64%
Perris 384K 151K 60%
Temecula 510K 250K 51%
Victorville 330K 132K 60%
Fontana 460K 209K 54%
Lemon Grove 419K 209K 54%
Chula Vista 545K 324K 40%
Oxnard 617K 259K 58%
Entire State of California 568K 254K 54%

State’s existing home sales increased 100.8 percent

For release: Thursday, Feb 26 2009

Quick facts

  • Existing, single-family home sales increased 100.8 percent in January to a seasonally adjusted rate of 624,940 on an annualized basis.
  • The statewide median price of an existing single-family home decreased 40.5 percent in January to $254,350.
  • C.A.R.’s Unsold Inventory Index was 6.7 months in January, compared with 16.6 months in January 2008.
  • The median number of days it took to sell a single-family home was 49.9 days in January 2009, compared with 70.8 days in January 2008

C.A.R. reports sales increased 100.8 percent; median home price declined 40.5 percent in January

LOS ANGELES (Feb. 26) – Home sales increased 100.8 percent in January in California compared with the same period a year ago, while the median price of an existing home fell 40.5 percent, the CALIFORNIA ASSOCIATION OF REALTORS® (C.A.R.) reported today.

“Statewide sales in January edged past the 600,000 threshold for the first time since October 2005,” said C.A.R. President James Liptak. “The strength in California home sales in recent months signifies that the market is gradually working its way through the large numbers of distressed sales that have followed in the wake of the troubled mortgage problem. With favorable home prices and historically low mortgage rates, affordability in the California housing market is now at its highest since the start of the decade.”

Closed escrow sales of existing, single-family detached homes in California totaled 624,940 in January at a seasonally adjusted annualized rate, according to information collected by C.A.R. from more than 90 local REALTOR® associations statewide. Statewide home resale activity increased 100.8 percent from the revised 311,160 sales pace recorded in January 2008. Sales in January 2009 increased 14 percent compared with the previous month.

The statewide sales figure represents what the total number of homes sold during 2009 would be if sales maintained the January pace throughout the year. It is adjusted to account for seasonal factors that typically influence home sales.

The median price of an existing, single-family detached home in California during January 2009 was $254,350, a 40.5 percent decrease from the revised $427,200 median for January 2008, C.A.R. reported. The January 2009 median price fell 9.5 percent compared with December’s revised $281,180 median price.

“A lot of attention has rightfully been directed toward the high number of distressed properties,” said C.A.R. Vice President and Chief Economist Leslie Appleton-Young. “California’s housing market also is feeling the effects of a drought in the availability of jumbo mortgage loans.

“Since the start of the credit crisis in 2007, jumbo lending has been severely constrained to the point where markets that rely on jumbo loans experienced a 24 percent year-to-year decline in sales in the month of January. This stands in contrast to the 100 percent sales gain the overall market experienced,” she said.
Highlights of C.A.R.’s resale housing figures for January 2009:

. C.A.R.’s Unsold Inventory Index for existing, single-family detached homes in January 2009 was 6.7 months, compared with 16.6 months (revised) for the same period a year ago. The index indicates the number of months needed to deplete the supply of homes on the market at the current sales rate.

. Thirty-year fixed-mortgage interest rates averaged 5.05 percent during January 2009, compared with 5.76 percent in January 2008, according to Freddie Mac. Adjustable-mortgage interest rates averaged 4.92 percent in January 2009, compared with 5.23 percent in January 2008.

. The median number of days it took to sell a single-family home was 49.9 days in January 2009, compared with 70.8 days (revised) for the same period a year ago.

Regional MLS sales and price information are contained in the tables that accompany this press release. Regional sales data are not adjusted to account for seasonal factors that can influence home sales. The MLS median price and sales data for detached homes are generated from a survey of more than 90 associations of REALTORS® throughout the state. MLS median price and sales data for condominiums are based on a survey of more than 60 associations. The median price for both detached homes and condominiums represents closed escrow sales.

In a separate report covering more localized statistics generated by C.A.R. and DataQuick Information Systems, none of the 331 cities and communities reporting showed an increase in their respective median home prices from a year ago. DataQuick statistics are based on county records data rather than MLS information. DataQuick Information Systems is a subsidiary of Vancouver-based MacDonald Dettwiler and Associates. (The top 10 list is generated for incorporated cities with a minimum of 30 recorded sales in the month.)

Note: Large changes in local median home prices typically indicate both local home price appreciation, and often, large shifts in the composition of housing market activity. Some of the variations in median home prices for January may be exaggerated due to compositional changes in housing demand. The DataQuick tables listing median home prices in California cities and counties are accessible through C.A.R. Online at http://www.car.org/economics/historicalprices/2009medianprices/jan2009medianprices.

.. Statewide, the 10 cities with the highest median home prices in California during January 2009 were: Santa Barbara, $939,250; Redondo Beach, $672,500; Pleasanton, $655,000; San Clemente, $602,500; San Ramon, $582,000; Yorba Linda, $566,750; San Francisco, $561,000; Huntington Beach, $555,000; Encinitas, $550,000; and Sunnyvale, $530,000.

Leading the way…® in California real estate for more than 100 years, the CALIFORNIA ASSOCIATION OF REALTORS® (www.car.org) is one of the largest state trade organizations in the United States, with nearly 180,000 members dedicated to the advancement of professionalism in real estate. C.A.R. is headquartered in Los Angeles.

January 2009 Regional Sales and Price Activity*-Regional and Condo Sales Data Not Seasonally Adjusted

Median Price Jan 09 Percent Change in Price from Prior Month Dec 08 Percent Change in Price from Prior Year Jan 08 Percent Change in Sales from Prior Month Dec 08 Percent Change in Sales from Prior Year Jan 08
Statewide
California (sf) $254,350 -9.5% -40.5% 14.0% 100.8%
California (condo) $218,960 -7.2% -41.0% -18.3% 58.2%
C.A.R. region
High Desert $127,750 -7.1% -45.5% -10.5% 234.6%
Los Angeles $305,310 -9.4% -35.0% -7.1% 84.7%
Monterey Region $263,540 -9.1% -54.6% -23.0% 132.7%
Monterey County $230,000 -9.8% -54.5% -21.6% 213.5%
Santa Cruz County $450,000 -1.1% -25.7% -27.8% 20.3%
Northern California $259,920 -4.5% -17.3% -19.8% 10.0%
Northern Wine Country $331,150 -3.8% -32.4% -21.0% 85.8%
Orange County $423,100 -4.4% -32.7% -25.9% 79.1%
Palm Springs/Lower Desert $153,150 -9.8% -52.1% -11.8% 51.0%
Riverside/San Bernardino $175,200 -8.2% -41.2% -20.6% 149.4%


[top]

From a memo from Paul Saunders


[Skip to the end]

Paul runs James River Capital Corp and sent this out today:

Everyone, including our public officials running this country, think in terms of the private sector and not the public sector. They are so used to running their own businesses or their own lives, that they are unable to think in terms of how the government works. The private sector, you and me, needs to borrow money or earn money in order to spend. The public sector never needs to earn money or borrow money. The Government prints US dollars and only the Government is able to print US dollars making the US Government the monopoly producer of US dollars. It is strange that so many smart people struggle with this concept. Every dollar that the government spends ends up in the private sector. The only way that those dollars are reduced is if the government taxes those dollars back from you. If the government taxes more than it spends then the Government runs a surplus and the private sector is depleted of its savings which eventually leads to a contraction in the economy. If they spend more than they tax then they run a deficit and the private sector increases its financial savings and this is stimulative to the economy.


[top]

Bernanke describes jobless recovery


[Skip to the end]

Yes, and this is a massive political risk.

The deficit is getting large enough to stabilize the economy at high levels of unemployment.

With flat employment growth, and 2% productivity growth, real GDP grows at 2% and unemployment stays north of 8%.

And the equity markets are in a very good place with costs under control and sales stabilized and rising.

So the financial sector booms while the real economy stagnates.

And fuel prices move higher as well.

Bernanke Offers Jobless Recovery as Humphrey-Hawkins Hopes Fade

by Craig Torres

Feb 23 (Bloomberg) — Bernanke Offers Jobless Recovery as Humphrey-Hawkins Hopes Fade delivering semiannual testimony required in legislation written by the late lawmakers, will describe a U.S. economy returning to growth next year without generating many new jobs. Even with credit markets thawing, Fed officials see unemployment persisting at 8 percent or higher through the final three months of 2010.


[top]

Re: Tax cuts may heighten deflation risks – NY Fed study


[Skip to the end]

(email exchange)

It doesn’t make sense in any model this side of sanity. Comments below:

>   
>   On Sun, Feb 22, 2009 at 7:47 PM, Steve wrote:
>   
>   Does this make sense in your model of fiscal policy?….interesting
>   counter intuitive argument…
>   

Tax cuts may heighten deflation risks- NY Fed study

Feb 18 (Reuters) — Cutting taxes to try to stimulate the economy could do more harm than good in a zero interest rate environment as it can heighten the risk of deflation, according to a recent New York Federal Reserve study.

Policies that are aimed at increasing the supply of goods can be counterproductive when the main problem is insufficient demand, New York Fed economist Gauti Eggertsson said in a research paper entitled “Can tax cuts deepen the recession?”

Increasing the supply of public goods is never contractionary. Though wise investment can bring down real costs and prices and thereby increase productivity and our real standards of living.

“The emphasis should be on policies that stimulate spending,” Eggertsson said, adding that his research found the impact of tax cuts is “fundamentally different” with interest rates near zero.

“At zero short-term nominal interest rates, tax cuts reduce output in a standard New Keynesian (economic) model. They do so because they increase deflationary pressure,” he wrote. Eggertsson’s study focused primarily on labor taxes and some sales taxes.

There’s the problem- the standard ‘new Keynesian model’ is garbage.

Cutting payroll taxes, for example, would create an incentive for people to work more. But if there are not enough jobs, this could have a negative effect: creating more demand for work and thus driving down wages.

Huh? First of all, for me personally at least, when my income is cut I tend to work more to at least try to make the same income. And when taxes are cut I certainly don’t work more. But that’s just anecdotal.

The main point is there are already millions of unemployed so even if somehow cutting payroll taxes so people struggling to make ends meet can better do so causes a few more people to seek work the pressure on wages can hardly go up.

And maybe the strongest point, these new people supposedly seeking work due to a cut in payroll taxes will only work at the higher wage as a point of this (convoluted) logic which is far different from a market and wage level pressure point of view than the millions of others willing to work at current wages who can’t find work.

Last, the notion that changes in payroll tax could measurably alter wage seekers is extremely far fetched at best and not statistically significant in any case.

And with interest rates near zero, the Fed cannot cut rates further to fight deflation.

As if cutting rates does or ever has fought deflation.

If anything the causation is reversed. The new Keynesian model has this all wrong.

President Barack Obama on Tuesday signed into law a $787 billion package of measures to lift the recession-mired U.S. economy that included about $287 billion in tax cuts.

Eggertsson’s findings counter the argument that cutting taxes to put an extra buck in consumers’ pockets will boost their spending. Instead, given the current economic backdrop, it is likely people would save money from temporary tax cuts,

Yes, this is likely, and not a ‘bad thing’ as it means taxes can be cut at least that much further and/or spending increased further.

given the recession and expectations that tax increases are inevitable in the future.

This is the ‘Ricardian Equivalent’ argument put forth by some of the ‘new Keynesians’ and has largely been dismissed as nonsensical by most. The idea that tax cuts do nothing because people automatically expect higher taxes later as they ‘know’ the budget must eventually be balanced, taken to the extreme, means totally eliminating taxes does nothing for demand which of course is ridiculous.

He said that while a number of economists have argued that aggressive tax cuts are needed to revive the U.S. economy, policy-makers should “view with a great deal of skepticism” studies that use post World War Two data — a period characterized by positive interest rates.

Interest rates have nothing to do with the effect of tax cuts. And history (and all other theory) has shown that tax cuts add to demand, tax increases lower demand.

The best ways to stimulate spending, according to Eggertsson’s study, is through traditional government spending and a credible commitment to boosting inflation, creating an incentive to spend now before prices rise. (Reporting by Kristina Cooke; Editing by Diane Craft)

Good old ‘inflation expectations theory’ again from the new Keynesians, which is also nonsense. It’s a ‘plug’ due to no other theory of where the price level comes from, as they have yet to recognize the currency itself is a public monopoly, and monopolists are necessarily price setters.


[top]

Re: Martin Wolf spot on


[Skip to the end]

(email exchange)

Cliff,

Martin Wolf is spot on below. Our biggest risk is the reluctance of our leaders to implement the fiscal adjustments on an as needed, size no object, basis to reverse shortfalls in aggregate demand.

>   
>   On Fri, Feb 20, 2009 at 11:11 AM, Cliff wrote:
>   
>   Warren,
>   
>   Many people ask me why Japan did not have large
>   inflation with their large deficits,
>   

They weren’t even large enough to fully offset the deflationary forces.

>   
>   and they ask will the U.S. be like Japan or will
>   inflation recur in the next few years.
>   

Depends on crude prices. If they go up inflation as we know it comes back. This is very likely.

We need a hard policy to cut our imported fuel consumption to prevent ‘inflation’ and declining real terms of trade.

>   
>   Please see the article below, and can you
>   comment on the article and the related two
>   questions posed above.
>   
>   Thanks, Cliff
>   

Japan’s lessons for a world of balance-sheet deflation

by Martin Wolf

Feb 17 (Financial Times) — What has Japan’s “lost decade” to teach us? Even a year ago, this seemed an absurd question. The general consensus of informed opinion was that the U.S., the U.K. and other heavily indebted western economies could not suffer as Japan had done. Now the question is changing to whether these countries will manage as well as Japan did. Welcome to the world of balance-sheet deflation.

As I have noted before , the best analysis of what happened to Japan is by Richard Koo of the Nomura Research Institute.* His big point, though simple, is ignored by conventional economics: balance sheets matter. Threatened with bankruptcy, the overborrowed will struggle to pay down their debts. A collapse in asset prices purchased through debt will have a far more devastating impact than the same collapse accompanied by little debt.

Most of the decline in Japanese private spending and borrowing in the 1990s was, argues Mr Koo, due not to the state of the banks, but to that of their borrowers. This was a situation in which, in the words of John Maynard Keynes, low interest rates – and Japan’s were, for years, as low as could be – were “pushing on a string”. Debtors kept paying down their loans.

How far, then, does this viewpoint inform us of the plight we are now in? A great deal, is the answer.

First, comparisons between today and the deep recessions of the early 1980s are utterly misguided. In 1981, U.S. private debt was 123 per cent of gross domestic product; by the third quarter of 2008, it was 290 per cent. In 1981, household debt was 48 per cent of GDP; in 2007, it was 100 per cent. In 1980, the Federal Reserve’s intervention rate reached 19-20 per cent. Today, it is nearly zero.

When interest rates fell in the early 1980s, borrowing jumped. The chances of igniting a surge in borrowing now are close to zero. A recession caused by the central bank’s determination to squeeze out inflation is quite different from one caused by excessive debt and collapsing net worth. In the former case, the central bank causes the recession. In the latter, it is trying hard to prevent it.

Second, those who argue that the Japanese government’s fiscal expansion failed are, again, mistaken. When the private sector tries to repay debt over many years, a country has three options: let the government do the borrowing; expand net exports; or let the economy collapse in a downward spiral of mass bankruptcy.

Despite a loss in wealth of three times GDP and a shift of 20 per cent of GDP in the financial balance of the corporate sector, from deficits into surpluses, Japan did not suffer a depression. This was a triumph. The explanation was the big fiscal deficits. When, in 1997, the Hashimoto government tried to reduce the fiscal deficits, the economy collapsed and actual fiscal deficits rose.

Third, recognising losses and recapitalising the financial system are vital, even if, as Mr Koo argues, the unwillingness to borrow was even more important. The Japanese lived with zombie banks for nearly a decade. The explanation was a political stand-off: public hostility to bankers rendered it impossible to inject government money on a large scale, and the power of bankers made it impossible to nationalise insolvent institutions. For years, people pretended that the problem was downward overshooting of asset price. In the end, a financial implosion forced the Japanese government’s hand. The same was true in the U.S. last autumn, but the opportunity for a full restructuring and recapitalisation of the system was lost.

In the U.S., the state of the financial sector may well be far more important than it was in Japan. The big US debt accumulations were not by non-financial corporations but by households and the financial sector. The gross debt of the financial sector rose from 22 per cent of GDP in 1981 to 117 per cent in the third quarter of 2008, while the debt of non-financial corporations rose only from 53 per cent to 76 per cent of GDP. Thus, the desire of financial institutions to shrink balance sheets may be an even bigger cause of recession in the US.

How far, then, is Japan’s overall experience relevant to today?

The good news is that the asset price bubbles themselves were far smaller in the US than in Japan. Furthermore, the U.S. central bank has been swifter in recognising reality, cutting interest rates quickly to close to zero and moving towards “unconventional” monetary policy.

The bad news is that the debate over fiscal policy in the U.S. seems even more neanderthal than in Japan: it cannot be stressed too strongly that in a balance-sheet deflation, with zero official interest rates, fiscal policy is all we have. The big danger is that an attempt will be made to close the fiscal deficit prematurely, with dire results. Again, the U.S. administration’s proposals for a public/private partnership, to purchase toxic assets, look hopeless. Even if it can be made to work operationally, the prices are likely to be too low to encourage banks to sell or to represent a big taxpayer subsidy to buyers, sellers, or both. Far more important, it is unlikely that modestly raising prices of a range of bad assets will recapitalise damaged institutions. In the end, reality will come out. But that may follow a lengthy pretence.

Yet what is happening inside the US is far from the worst news. That is the global reach of the crisis. Japan was able to rely on exports to a buoyant world economy. This crisis is global: the bubbles and associated spending booms spread across much of the western world, as did the financial mania and purchases of bad assets. Economies directly affected account for close to half of the world economy. Economies indirectly affected, via falling external demand and collapsing finance, account for the rest. The US, it is clear, remains the core of the world economy.

As a result, we confront a balance-sheet deflation that, albeit far shallower than that in Japan in the 1990s, has a far wider reach. It is, for this reason, fanciful to imagine a swift and strong return to global growth. Where is the demand to come from? From over-indebted western consumers? Hardly. From emerging country consumers? Unlikely. From fiscal expansion? Up to a point. But this still looks too weak and too unbalanced, with much coming from the US. China is helping, but the eurozone and Japan seem paralysed, while most emerging economies cannot now risk aggressive action.

Last year marked the end of a hopeful era. Today, it is impossible to rule out a lost decade for the world economy. This has to be prevented. Posterity will not forgive leaders who fail to rise to this great challenge.


[top]