Crude Oil Falls on Demand Concerns After IEA Lowers Forecast – Bloomberg.com


[Skip to the end]

I’m not sure it falls from end of Q1 levels as I see that as the low point of US GDP and motor fuel consumption for this cycle.

This is another example of forecasters not looking to the federal deficits as the drivers of the world economy.

And even a further drop of 2.4 million bpd isn’t enough to dislodge OPEC and the Saudis as they can easily cut that much if they want to support prices.

More interesting is the cut in prices by the Saudis published last week. Seems maybe they aren’t ready for higher prices yet, but instead want to keep prices here to keep investments in substitutes unprofitable. So I agree oil prices could stay in a tight range for a while.

Crude Oil Falls After IEA Cuts Demand Forecast to Five-Year Low

by Christian Schmollinger

April 13 (Bloomberg) — Crude oil fell in New York after the International Energy Agency said 2009 demand may slump to the lowest in five years as factories shut and car sales tumble amid a deepening global recession.

Oil consumption will fall 2.4 million barrels a day this year, about the same amount that Iraq produces, to 83.4 million barrels a day, the IEA said on April 10 as trading in New York and London was closed for the Good Friday holiday. U.S. crude supplies are at their highest since July 1993, the Energy Department said on April 8.


[top]

Crude oil inventories falling


[Skip to the end]

Higher crude prices means dollars are easier to get overseas and will tend to weaken the dollar.

And the talk is higher oil prices will give the Fed more reason to keep rates low as the higher prices tend to slow growth.

And don’t immediately impact core price measures.

Oil at $50 as OPEC Plans Cut, Keeps to Quota

by Grant Smith

Mar 9 (Bloomberg) — OPEC’s record production cuts are draining the glut in world oil markets, leading traders to bet that $50 crude is two months away.

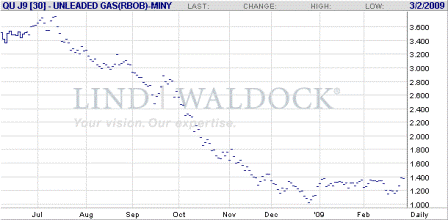
Ever since oil began its 69 percent plunge from a record $147.27 a barrel in July, traders have been looking for a bottom. Now that the Organization of Petroleum Exporting Countries reduced supplies 13 percent since September, inventories are falling 1.4 million barrels a day, according to PVM Oil Associates Ltd., the world’s biggest broker of energy trades between banks. OPEC will limit exports again when the group meets March 15, according to a survey by Bloomberg News


[top]

Gasoline consumption up year over year


[Skip to the end]

All the way to the bottom of the recession and gasoline demand up year over year.

The sell off in price still looks to me like it was all due to the Great Mike Masters Inventory Liquidation triggered by his efforts last summer.

Prices are now heading up with inventories in short supply, a trillion dollar fiscal adjustment in the pipeline, and no policy to directly reduce fuel consumption.

Crude prices jump as US gasoline demand rises

Feb 25 (Xinhua) — Crude prices jumped Wednesday after a U.S. government report showing demand for gasoline is on the rise.

The Energy Department’s Energy Information Administration report said crude inventories rose by 700,000 barrels to 351.3 million barrels. Analysts expected crude stocks would grow by 2.25 million barrels.

Gasoline inventories slipped by 3.4 million barrels, or 1.6 percent, to 215.3 million barrels, which is 7.6 percent below year-ago levels.

Meanwhile, gasoline demand was up 1.7 percent, compared with the same period last year to an average of 9 million barrels per day.


Light, sweet crude for April delivery was up 2.54 U.S. dollars to settle at 42.50 dollars on the New York Mercantile Exchange.

Brent prices rose 1.79 dollars to settle at 44.29 dollars a barrel on the ICE Futures exchange in London.


[top]

China crude drop only 8%


[Skip to the end]

Not nearly enough to dislodge the Saudis from being the swing producer and price setter now that the Great Mike Masters Inventory Liquidation has run its course.

Beware an even modest recovery that increased crude consumption.

China’s Net Crude Imports Decline to Lowest in a Year

by Wang Ying

Feb 11 (Bloomberg) — Crude-oil imports dropped by 8 percent to 12.82 million tons from a year earlier while overseas shipments of the fuel more than doubled, rising 156 percent to 450,000 tons, the customs said today.


[top]

Re: Crude oil inventories update


[Skip to the end]

(email exchange)

Thanks, should be more than enough given the small drop in actual demand.

>   
>   On Mon, Jan 26, 2009 at 9:59 AM, David wrote:
>   
>   Tanker tracking suggests an OPEC11 production of 26.1 mbpd in January,
>   compared to the target of 24.85 mbpd, with Saudi Arabia, Venezuela and
>   Nigeria leading the cutbacks. However, this represents a cut of only
>   2.9 mbpd from the agreed cut of 4.2 mbpd (a compliance of 69%), which is
>   somewhat under the estimated 3.5 mbpd cut needed to balance the market in
>   the near term. But it should easily balance the tightening market further out,
>   especially if compliance improves.
>   

The contango in the futures market continues to come in, as does the spread between WTI and Brent.

The RBOB contango also coming in, indicating gasoline supplies are also tightening.

This indicates spot supplies are tightening- the OPEC cuts are ‘working’.

Most consumption indicators show crude consumption to be about flat or only down slightly year over year.

The great Mike Masters inventory liquidation that began in July may finally have run its course.

And the Saudis are back to being price setter.

I would strongly recommend any fiscal adjustment that increases aggregate demand be accompanied by policy that immediately and substantially reduces crude oil and gasoline consumption.


[top]

Crude oil inventories


[Skip to the end]

The contango in the futures market continues to come in, as does the spread between WTI and Brent.

The RBOB contango is also coming in, indicating gasoline supplies are also tightening.

This indicates spot supplies are tightening- the OPEC cuts are ‘working’.

Most consumption indicators show crude consumption to be about flat or only down slightly year over year.

The great Mike Masters inventory liquidation that began in July may finally have run its course.

And the Saudis are back to being price setter.

I would strongly recommend any fiscal adjustment that increases aggregate demand be accompanied by policy that immediately and substantially reduces crude oil and gasoline consumption.


[top]

Weakest crude demand report to date


[Skip to the end]

Still looks to me the call on OPEC crude will be about the same:

CGES: Global oil demand to contract in 2009

CGES,The Centre for Global Energy Studies a leading energy forecasting organization said on Tuesday on its monthly oil report that Global oil demand
is likely to contract in 2009 for the first time in 25 years.

CGES said demand growth in Asia, Latin America and the Middle East can no longer offset the continuing decline in the Organization of Economic Cooperation and Development countries.

In a report, the consultancy said consumers are still responding to recent high pump prices, and a loss of confidence in employment and income prospects means even a lower price won’t halt the decline in demand.

CGES also said the recent slide in oil prices won’t end until the Organization of Petroleum Exporting Countries implements its recent 1.5 million barrels a day cut in output, or higher cost non-OPEC production is shut-in.

CGES said its demand pessimism is “offset to a degree” by its view of non-OPEC supply, which is “unlikely to show any real growth in either 2008 or 2009.”


[top]

Re: CFTC reclassifies crude oil position


[Skip to the end]

(An email exchange)

>   (3) The reclassified trader is quite a special one:
>   
>      (a) The reclassified trader has interests in only a few
>   commodities (I have highlighted the reclassified ones in the
>   chart).
>   
>      (b) The trader is heavily focused on crude oil. The
>   reclassified positions include 330 million bbl of WTI contracts,
>   45 million bbl WTI calendar spread options, 20 million bbl of
>   crude oil calendar swap options, 15 million bbl of European style
>   crude oil options and about 15 million bbl of financial WTI crude
>   oil futures and options.
>   
>      (c) In some of these contracts, the trader’s reclassified
>   positions are enormous. For example, in the WTI contract, the
>   traders 330 million bbl of reclassified positions amounted to
>   about 11% of all the open interest in this contract. In the WTI
>   calendar spread options, the trader’s 45 million bbl position was
>   equivalent to about 35% of all open interest. So the trader was
>   a very big participant in these markets.
>   
>      (d) The trader has a few other reclassified interests, mostly
>   in natural gas, with little or no reclassified interest in electricity
>   derivatives or petroleum products such as RBOB gasoline. But
>   the reclassified positions in these markets are tiny in relation to
>   open interest and the trader does not appear to have been a
>   significant participant, at least from its reclassified positions.
>   
>   The CFTC has not revealed the identity of the reclassified trader
>   – which remains confidential. But given the scale of positions
>   which the CFTC has reclassified, there are only a few types of
>   institutions which could be running this type of book: oil
>   companies, refiners, distributors, merchants, banks, index funds
>   and swap dealers.
>   
>   
>   And the CFTC staff obviously examined the numbers and concluded
>   that “commercial hedging or risk-management activities did not
>   constitute a significant part of the overall trading activity”. In other
>   words, the CFTC concluded that this was all or almost all
>   speculative.
>   
>   Now we don’t have full information about the revisions going all
>   the way back to Jul 2007 for all the contracts. But we do have
>   information about the basic WTI position for this trader. Back in
>   Jul 2007, this trader had a position of about 180 million bbl that
>   has been reclassified. But by Jul 2008, this traders’ reclassified
>   position had grown to 330 million bbl. This traders’ positions
>   have been growing faster than the market as a whole so its
>   share of total open interest in the WTI contract has risen from
>   9.1% in Jul 2007 to a massive 11.5% in Jul 2008.
>   
>   The reclassification is so large it affects understanding of the
>   whole market. Under the old classification, non-commercial
>   traders accounted for about 38% of the total open interest in
>   the WTI contract. But now that one large trader has been
>   reclassified, non-commercial traders account for 49% of the
>   market — half rather than one third.
>   
>   Assuming that one individual trader did increase their already
>   large 180 million bbl position in the WTI spreads in Jul 2007 to as
>   much as 330 million bbl in Jul 2008, and that the additional
>   positions were not hedging an underlying exposure, it seems
>   impossible that the massive accumulation would not have
>   disturbed the market at least somewhat.
>   
>   It is interesting, though perhaps coincidental, to note that
>   crude oil prices peaked around Jul 4-14, a few days before the
>   CFTC announced its reclassification on Jul 18.
>   
>   These positions are so large that they clearly exceed the
>   NYMEX position limits by a substantial margin (no more than
>   20,000 contracts in all months; no more than 10,000 contracts
>   in any one month; and no more than 3,000 contracts in the last
>   three days of trading in the spot month). Presumably, the
>   holder of these positions has received a waiver from NYMEX and
>   the CFTC on the basis that it is hedging under the normal
>   hedging exemptions. But if the CFTC no longer believes that the
>   holder of these positions is using them for “hedging or risk
>   managing” to any significant extent, will they still be allowed to
>   qualify for the waiver (a question I am not qualified to answer).
>   
>   

thanks,

any idea who holds that large position?

A liquidation of this size is more than sufficient to drive down futures prices and even cause a liquidation of some portion of spot inventories.

The Saudis could keep prices high as this happens but that would make it obvious they are setting prices as swing producer.

So instead, as in Aug 06 during the Goldman liquidation, they instead lower their prices as futures prices fall, but with a small lag, until the liquidation is over.

They then go back to setting/hiking prices

Warren

>   
>   
>   The CFTC has published revised Commitment of Traders data
>   back to 3 Jul 2007 to take account of the reclassification of one
>   or more positions from the commercial to the non-commercial
>   category.
>   
>   CFTC has published both the original and the revised data for a
>   single point in time (15 Jul 2008) to help users understand the
>   impact of the change. It is has NOT published identical
>   historical data sets of both original and revised data. However,
>   I still have the complete data as originally reported — and of
>   course the revised numbers from the CFTC website. Comparing
>   the two series gives a fascinating insight into what the CFTC
>   has done (this is a little sneaky because I don’t think the CFTC
>   staff meant to identify the position of an individual trader quite
>   so publicly).
>   
>   (1) The revisions over the entire period from Jul 2007 onwards
>   affect just one very large participant in the crude oil market
>   each week (and presumably the same participant over time).
>   
>   (2) In each case, the positions seem to have been almost
>   entirely in the time spread. A large number of positions that
>   were originally reported as separate “long” and “short”
>   commercial positions are now being reported as a combined
>   non-commercial “spread” position with a small balance reported
>   as an non-commercial short position each week.
>   
>   (3) The attached chart gives some indication of the impact of
>   the reclassification back through Jul 2007 (as far back as the
>   CFTC staff have so far been able to recalculate the data). The
>   scale of the reclassified position is very large (see chart) and it
>   has been growing over time. The position which CFTC has
>   reclassified has grown from around 190,000 contracts in Jul
>   2007 to 320,000 contracts in Jul 2008. By the middle of Jul this
>   year, this one massive trader held spread positions equivalent to
>   about 25% of the entire market for non-commercial spread>   positions.
>   
>   (4) Interestingly, we can also look at the residuals — ie the
>   part of the commercial long-short position that was not
>   reclassified as a commercial spread position. The residual has
>   varied over time between about 1,000 contracts (1 million bbl)
>   and 11,000 contracts (11 million bbl) and every week it was a
>   residual short position rather than a long one. None of the
>   CFTC reclassifications affect the non-commercial long side of
>   the market at all. It doesn’t necessarily imply that this trader
>   was always short overall (they might have had offsetting long
>   positions somewhere else). But interestingly, those short
>   positions have been gradually cut over time (see chart)
>   although as of the middle of last month (15 Jul 2007) the
>   reclassified trader was still net short almost 4,000 lots (4 million
>   bbl).
>   
>   


[top]

Wed am recap

Mainstream economics says:

Get inflation right and that ‘automatically’ optimizes long-term growth and employment.

Adding to demand with a negative supply shock turns a ‘relative value story’ into an ‘inflation story.’

The ECB is following mainstream theory, while the Fed is not.

why?

The Fed sees looming systemic, deflationary tail risk at the door. At least up to now.

The panic of 1907 and the early 1930s deflationary collapse (both previous examples given by the Fed) were gold standard events.

With a gold standard (and/or other fixed rate regimes) there are direct supply side constraints on the reserve currency. Interest rates are market determined, and during a credit crunch rates spike higher ‘automatically.’ Even the treasury must fund itself and faces the same supply side constraints, thereby limiting fiscal responses. This continues in today’s fixed fx currencies.

With floating fx/non-convertible currency there are inherent no direct supply side constraints on bank lending, deposit creation, and credit in general. Any constraints are on the demand side, including financial capital where constraints are also on the demand side. The CB necessarily directly sets rates, not market forces, and government spending is not constrained by taxing, borrowing, etc., hence fiscal packages are subject only to political choice.

Today’s risks are much the same as previous financial crisis type risks like 1987 and 1998, where the government and its agencies have the open option of ‘writing the check’ as desired, with inflation the price to pay, not government solvency as with fixed fx regimes.

Just like the 1970s, the Saudis are acting the swing producer and setting price and letting quantity they pump adjust. This is also necessarily the case when one is single supplier at the margin with excess capacity. The alternative of pumping flat out and hitting bids in the spot market is not a functional option for any monopolist. Only price setting is.

Russia is also a monopoly supplier at the margin and probably is also acting as a swing producer. So crude prices go to where the higher of the two set them.

Mainstream theory has not yet publicly addressed this kind of negative supply shock.

One option is to match the domestic inflation rates to the price hikes to try to avoid declining real terms of trade.

This is both politically impossible, and it can quickly lead to accelerating inflation.

We have two choices, neither particularly attractive:

  1. Watch our real terms of trade continue to collapse as crude prices are continuously hiked.
  2. Try to inflate to moderate the drop in real terms of trade.

Ironically, we will chose the later as we did in the 1970s because inflation is not a function of interest rates in the direction CBs subscribe to.

Increasing nominal rates increases inflation via the cost and demand channels.

Costs of holding inventory and investment rise with rate hikes.

Governments are net payers of interest to the non-government sectors; so, rate hikes also increase government spending on interest to support incomes in the non-government sectors.

Good luck to us!