Wholesale trade, BOE on Greece, Redbook sales, Jolts

Inventories looking excessive:

Wholesale Trade
wholesale-trade-dec
Highlights
The economy may be solid right now but inventories at the wholesale level look heavy, rising 0.1 percent in December vs a noticeable 0.4 percent decline in sales at the wholesale level. The mismatch drives up the stock-to-sales ratio by 1 tenth to 1.22 which is the heaviest reading since way back in the troubled days of late 2009. This ratio was at 1.17 through the middle of last year but has since been moving higher.

December’s unwanted wholesale build is centered in the non-durable component where sales, in contrast to durable goods which rose 1.1 percent, fell 1.7 percent in the month. Here the culprit is petroleum where sales, reflecting both price effects and lower demand, fell 13.7 percent in the month. And the supply overhang, based on weekly petroleum inventory data, has continued to build into the new year. Showing a big draw in the month are lumber and electrical goods, two products that may be signaling rising demand out of the construction sector.

The nation’s inventories have been moving higher but the imbalance has been centered in the wholesale sector, though inventories at the factory level are showing a little pressure. Watch Thursday for the business inventories inventory report which will round out December’s data with data on the retail sector.

Wholesale inventories up 0.1% in December, versus expectations for 0.2% gain

Feb 10 (Reuters) — U.S. wholesale inventories barely rose in December, the latest suggestion that fourth-quarter growth could be revised lower.

The Commerce Department said on Tuesday wholesale inventories edged up 0.1 percent as lower crude oil prices weighed on the value of petroleum stocks. Stocks at wholesalers had increased by an unrevised 0.8 percent in November.

Economists polled by Reuters had forecast wholesale inventories rising 0.2 percent in December.

Inventories are a key component of gross domestic product changes. The component that goes into the calculation of GDP – wholesale stocks excluding autos—nudged up 0.1 percent.

The report, together with last week’s data showing a 0.3 percent fall in manufacturing inventories in December, suggested the boost to GDP growth from restocking in the fourth quarter was probably not as large as initially thought.

The government estimated last month that inventories added 0.8 percentage point to the economy’s annualized 2.6 percent growth pace in the fourth quarter.

Sales at wholesalers fell 0.4 percent in December after a similar decline in November. At December’s sales pace it would take 1.22 months to clear shelves, down from 1.21 months in November.

The last thing Greece needs are collaborators. First Italy and now the BOE:

BOE’s Carney Applauds ECB Policy (WSJ) “There are many reasons why the ECB’s actions are important, one of them is it shows the ECB has the full tool kit to support the underlying economy as necessary…the ECB is taking bold action,” BOE Governor Mark Carney said. While the ECB move is constructive, it won’t deliver medium-term prosperity to the eurozone economy, Mr. Carney said.

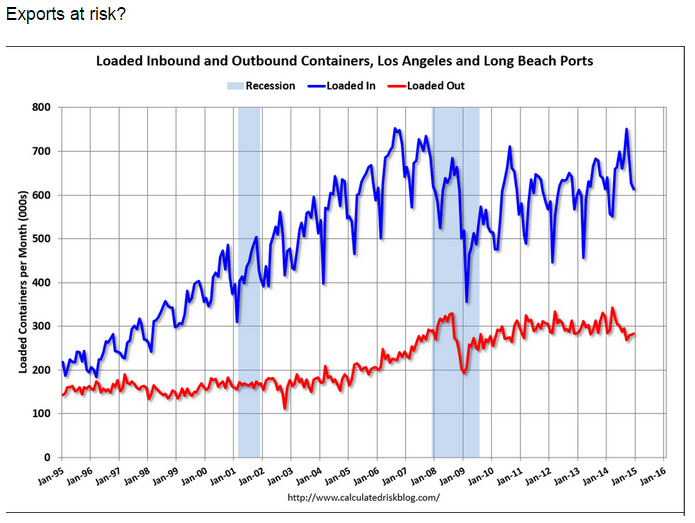
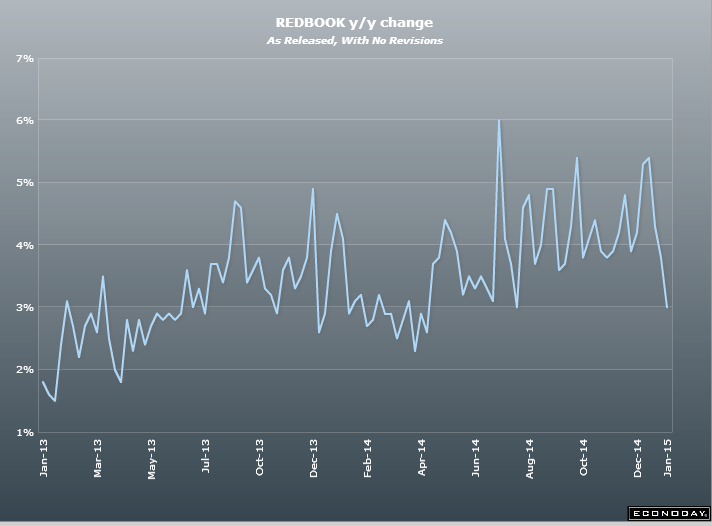
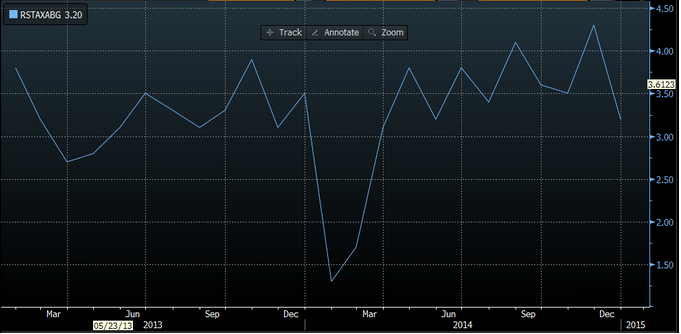
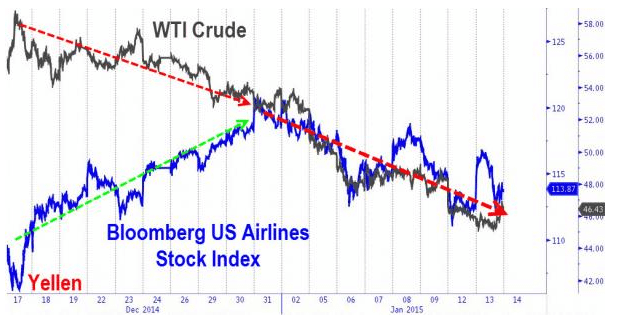
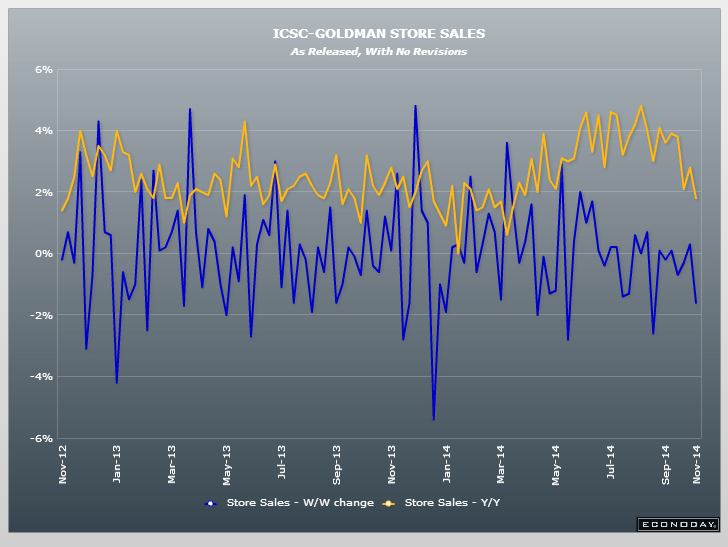
This isn’t supposed to be declining with the presumed boost to the consumer from low oil prices:

Redbook
redbook-2-7
Highlights
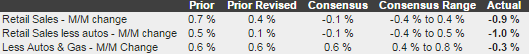
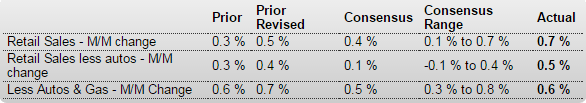
Retail sales slowed substantially in the February 7 week, to a year-on-year plus 2.1 percent from 3.8 percent in the prior week. The 2.1 percent rate is very low which the report attributes to the Super Bowl which diverted consumer attention. Redbook sees sales picking up in the next report due to Valentine’s Day. The government’s retail sales report this Thursday is the week’s big event on the calendar and is expected to show a bounce-back rise in core sales for January (ex-auto ex-gas).

JOLTS
jolts-dec
Highlights
There were 5.028 million job openings on the last business day of December, slightly improved from 4.847 million in November. Hires (5.148 million) and separations (4.886 million) were little changed in December. Within separations, the quits rate (1.9 percent) and the layoffs and discharges rate (1.2 percent) were unchanged. This release includes estimates of the number and rate of job openings, hires, and separations for the nonfarm sector by industry and by four geographic regions.

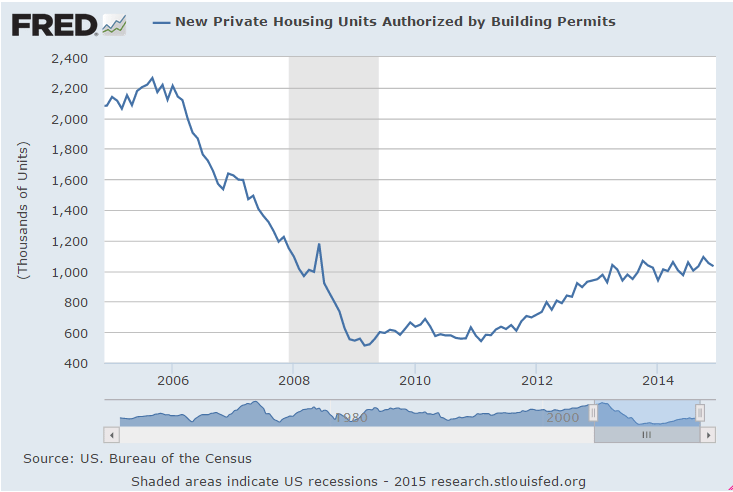
There were 5.148 million hires in December, slightly higher than November’s 5.054 million. This was the highest level of hires since November 2007. The hires rate in December was 3.7 percent. The number of hires was little changed for total private and government. Hires increased over the month in construction.

Total separations include quits, layoffs and discharges, and other separations. Total separations are referred to as turnover. Quits are generally voluntary separations initiated by the employee. Therefore,
the quits rate can serve as a measure of workers’ willingness or ability to leave jobs. Layoffs and discharges are involuntary separations initiated by the employer. Other separations include separations
due to retirement, death, and disability, as well as transfers to other locations of the same firm.
There were 4.9 million total separations in December, little changed from November. This was the highest level of separations since October 2008. The separations rate was 3.5 percent. The number of total separations was little changed for total private and government.

There were 2.717 million quits in December, little changed from November. The quits rate in December was 1.9 percent. The number of quits was little changed for total private and government. Quits increased in construction and durable goods manufacturing. The number of quits was little changed in all four regions.

Overall, the JOLTS numbers portray a slowly improving jobs market with job openings rising along with hires.

Redbook, Fed lending survey, Factory orders

This is interesting in that it isn’t showing any
pickup in consumer spending from the lower oil prices:

Redbook
redbook-1-31
Highlights
Retail sales picked up in the January 31 week based on Redbook’s sample whose year-on-year same-store sales rate rose 6 tenths from the prior week to plus 3.8 percent. TV sales and sales of food & beverages got a lift from the Super Bowl but other sales were held down by the week’s heavy weather which kept shoppers at home and closed stores. Clearance sales are expected to dominate sales activity in the weeks ahead as winter goods are moved out and spring goods moved in. Sales rates from Redbook were no better than moderate in January and are not pointing to a sales surge for the government’s ex-auto ex-gas reading, a reading that posted a disappointing decline in December.

Nor are the banks impressed by the supposed new found consumer savings on fuel:
consumer-loans-cb-2
Even worse than the low expectations:

Factory Orders
factory-orders-dec
Highlights
The headlines are once again very weak for the factory sector masking core readings that are less weak. Factory orders fell a very steep 3.4 percent in December for a 5th straight decline. This is the longest losing streak since the collapse of late 2008 and early 2009. Not helping is a full percentage point downward revision to November to minus 1.7 percent.

Turning first to the durables component, durables orders fell 3.3 percent in December, revised 1 tenth higher from the initial reading posted last week. But when excluding defense goods and civilian aircraft, which are two components subject to volatile monthly swings, durables orders actually rose 0.1 percent, breaking a string of three negative readings. Another core reading is also worth noting and that’s nondefense capital goods excluding aircraft which slipped only 0.1 percent for, however, a 4th straight decline.
factory-orders-dec-graph

Factory orders falls 3.4% in December, versus down 2.2% estimate

Feb 3 (Reuters) — New orders for U.S. factory goods fell for a fifth straight month in December, but a smaller-than-previously reported drop in business spending plans supported views of a rebound in the months ahead.

The Commerce Department said on Tuesday new orders for manufactured goods declined 3.4 percent as demand fell across a broad sector of industries.

November’s orders were revised to show a 1.7 percent drop instead of a previously reported 0.7 percent fall. Economists polled by Reuters had forecast new orders received by factories sliding 2.2 percent.

Manufacturing is slowing, constrained by weak global demand and falling crude oil prices, which have caused some companies in the energy sector to either delay or cut back on capital expenditure projects.

Business spending on equipment in the fourth quarter was the weakest since mid-2009. The soft trend in business investment likely persisted early into the first quarter, with a report on Monday showing a manufacturing sector gauge falling in January.

Factory activity has also been hampered by an ongoing labor dispute at the nation’s West Coast ports, which has caused shipment delays. But there is cautious optimism that firming domestic demand will limit the slowdown in manufacturing.

In December, factory orders excluding the volatile transportation category fell 2.3 percent, the biggest drop since March 2013, after declining 1.3 percent in November.

The Commerce Department also said orders for non-defense capital goods excluding aircraft—seen as a measure of business confidence and spending plans—slipped 0.1 percent instead of the 0.6 percent drop reported last month.

Overall orders for durable goods, manufactured products expected to last three years or more, fell 3.3 percent instead of the previously reported 3.4 percent decline.

ECB, Jobless Claims, Sea Container Counts, Housing Starts, Purchase apps, Architecture Billings, miles driven, Redbook sales, my take on consequences of $50 oil

Like the carpenter with the piece of wood “no matter how much I cut off it’s still too short”

Draghi has yet to realize rate cuts/QE/etc. are a deflationary/contractionary bias:

*DRAGHI SAYS WILL BUY UNTIL SEE SUSTAINED INFLATION IMPROVEMENT

Jobless Claims
claims-1-17
Highlights
Jobless claims have been inching higher and are not pointing to increasing strength for the January employment report. Initial claims did fall 10,000 in the January 17 week but to a 307,000 level that is just outside the high end of the Econoday consensus range (289,000 to 305,000).

The January 17 week is the sample week for the monthly employment report and a comparison with the December sample week shows a sizable 18,000 increase. The current 4-week average at 306,500 is up 6,500 from the prior week for the highest reading since way back in July. A sample-week to sample-week comparison for the average shows a 7,750 increase this month.

Continuing claims, which are reported with a 1-week lag, have also been on the increase. Continuing claims for the January 10 week rose 15,000 to 2.443 million with the 4-week average up 9,000 to 2.427 million. This average has also been on the rise and is up 8,000 from the month-ago comparison. The unemployment rate for insured workers is unchanged at 1.8 percent.
claims-1-17-graph

December 2014 Sea Container Counts Continue to Show Softness in Trade

By Steven Hansen

Export container counts continue to weaken, which is usually awarning that the global economy is slowing. Export three month rolling averages continue to decelerate – being in negative territory year-over-year. However, there are serious labor issues at all West Coast ports, and it is hard to understand the effect on the container counts. One should also consider that exports have been decelerating most of 2014 – well before the labor disputes.
containers

Housing Starts
starts-dec
starts-dec-graph

Permits lead housing:
permits-dec

MBA Purchase Applications
mba-apps-1-16
mba-apps-1-16-graph

private-permits
This isn’t going anywhere:
architecture-billings-index-dec
Miles driving per capital even worse than this:
miles-driven

This isn’t supposed to be soft with the consumer saving so much on gas and oil:
red-book-1-17
So here’s the latest ‘back of the envelope’ mainstream take on oil:

Consumer saves $200 billion, but
Capex down by $100 billion =
Unambiguous Net Gain of $100 billion

Except they all left out the fact that if the consumer is saving $200 billion other agents are losing $200 billion of income.

And that foreign capex that totaled over $500 billion in 2014 is being cut back as well, with some of those cutbacks translating into reduced US exports.

Not to mention the US consumer only spends part of that $200 billion saved, and what is spent on imports doesn’t add to US GDP.

So my back of the envelope remains:

Consumers who save $200 billion spend only $120 billion on domestic output. Agents who lose $200 billion of income cut spending on domestic output by $120 billion That all nets to 0, consistent with weak December retail sales, for example.

Additionally, US capex falls $100 billion, and US exports fall $50 billion, both also supported by recent data releases.

Therefore $50 oil is an unambiguous negative for the US economy.

retail sales, import and export prices, business inventories, airline stocks, ECB QE comment

This is not supposed to happen with falling gas prices…

Retail Sales
retail-sales-dec
Highlights
Retail sales disappointed for December. Retail sales in December fell 0.9 percent after posting a 0.4 percent gain in November and a 0.3 percent rise in October. Expectations were for a 0.1 percent decline. The December decrease is the largest negative since January 2014. Both November and October were revised down. Excluding autos, sales decreased 1.0 percent after rising 0.1 percent in November. Analysts expected a 0.1 percent decrease. Excluding both autos and gasoline sales declined 0.3 percent after advancing 0.6 percent in November. Expectations were for a 0.6 percent boost.

The motor vehicle component was weak as expected from the unit new auto sales report. Motor vehicles dipped 0.7 percent in December, following a 1.6 percent gain the month before. Gasoline station sales fell again on lower prices. Sales dropped a sharp 6.5 percent after a 3.0 percent drop in November.

Within the core weakness was broad based, led by miscellaneous store retailers (down 1.9 percent), building materials & garden supplies (down 1.9 percent), electronics & appliance (down 1.6), and general merchandise (down 0.9 percent). Notable gains were seen in furniture & home furnishings (up 0.8 percent) and food services & drinking places (up 0.8 percent).

Today’s retail sales report is a surprise on the downside. But it also is a quandary. Consumer confidence is up and discretionary income is up with gasoline prices down. It is possible that more money is going to services which do not show up in the retail sales report. Probably the biggest positive in the report is the boost in food services & drinking places which is a very discretionary spending item-suggesting a positive mood for the consumer. But looking at the numbers technically, fourth quarter GDP forecasts likely are being shaved.
retail-sales-dec-graph

‘Control Group’: Retail Sales ex food, gas, building materials, auto dealers:
control-group

Retail Sales decreased 0.9% in December

The decrease in December was well below consensus expectations of a 0.1% decrease. Both October and November were revised down.

This was a weak report even after removing the impact of lower gasoline prices.

Import and Export prices:
imp-exp-prices

For November:

business-inventories

Airlines not flying as high as expected either:

airlines

claims, retail sales, prices, inventories

If sales are going to fall off it will be after the layoffs and capital expenditure cuts from the fall in crude prices take place:
c-rs-p-i-1

c-rs-p-i-2

Jobless Claims
c-rs-p-i-3

Highlights
Jobless claims data are low but still are still trending higher than a month ago in comparisons that do not point to further improvement for the monthly employment report. Initial claims did fall 3,000 in the December 6 week to 294,000 but the 4-week average, up slightly to 299,250, is still about 15,000 higher than in early November.

Continuing claims tell the same story, up a steep 142,000 to 2.514 million in lagging data for the November 29 week. This is the highest level since mid August. The 4-week average, up 28,000 to 2.386 million, is also up about 15,000 vs the month-ago comparison. The unemployment rate for insured workers ticked higher for the first time since late August, up 1 tenth to 1.9 percent.

Retail Sales
c-rs-p-i-4
Highlights
Retail sales in November came in strong despite lower gasoline prices. Retail sales in November posted a 0.7 percent boost after rebounding 0.5 percent in October Market expectations were for 0.4 percent rise for November. Autos jumped a notable 1.7 percent after gaining 0.8 percent in October. Excluding autos, sales increased 0.5 percent after rising 0.4 percent in October. Forecasts were for a 0.1 percent boost.

Gasoline station sales fell on lower prices. Sales declined 0.8 percent after a 1.3 percent drop in October. Excluding both autos and gasoline sales advanced 0.6 percent in November after a 0.7 percent rise the prior month. The median market forecast was for 0.5 percent.

Within the core strength was broad based, led by building materials & garden equipment (up 1.4 percent); clothing & accessories (up 1.2 percent); and nonstore retailers (up 1.0 percent).

Today’s retail sales report is favorable for fourth quarter GDP in the personal consumption component. Currently, the consumer sector is leading the recovery with confidence and spending up.
c-rs-p-i-5

Import and Export Prices
c-rs-p-i-6
Highlights
Cross-border price pressures are nowhere to be found in the import & export price report where import prices dropped 1.5 percent in November, the 5th straight drop and the steepest since June 2012, and export prices fell 1.0 percent for the 4th straight drop and matching the steepest drop since June 2012. The year-on-year rate for import prices is at minus 2.3, the steepest negative reading since April 2013, with export prices at minus 1.9, the steepest since October 2013.

And it’s not just oil-related prices that are falling. Excluding petroleum, import prices fell 0.3 percent in the month for a 4th straight drop and the steepest since April this year while export prices, excluding both food and fuels for this reading, fell 0.5 percent for a third straight drop. The year-on-year reading for ex-petroleum import prices is at only plus 0.1 percent with ex-food & ex-fuel export prices at minus 0.4 percent.

A look at finished goods shows extended declines for nearly all readings. Prices of imported motor vehicles are down 0.1 percent in the month for a 1.0 percent year-on-year decline while prices of exported consumer goods are down 0.3 percent for both the monthly and year-on-year comparisons.

The strong dollar is an important factor that is keeping import prices down, but it’s more than the dollar as evidenced by the export side of the data. Falling oil prices are having a spillover effect throughout the global price picture. Today’s data point to very soft readings for tomorrow’s producer price report and they won’t be lifting expectations for Wednesday’s consumer price report.

Business Inventories
c-rs-p-i-7
Highlights
Total business inventories rose slightly in October, up 0.2 percent, but show no significant change relative to business sales which slipped 0.1 percent. The stock-to-sales ratio is unchanged for a 3rd straight month at 1.30.

Car sales up

Good news here:

Motor Vehicle Sales
vehicle-sales-table

Highlights
Vehicle sales rose a strong 4.2 percent in November to a 17.2 million unit annual rate which is outside the top end of the Econoday consensus for 17.0 million. Sales of North American-made vehicles proved especially strong, at a 14.0 million rate which is also outside the top-end forecast. Sales of foreign-made vehicles rose to a 3.3 million rate from 3.2 million. Today’s data point to a second straight gain, and an especially strong gain, for the motor vehicle component of the November retail sales report which rose a solid 0.5 percent in October.

dom-vehicle-sales

Employment and related commentary

Seems universally agreed the labor market is ‘improving’ even as the jobs chart has been downward sloping since the peak in April, wage growth has softened from relatively low levels, and the work week fell back some.

It’s all screaming ‘lack of aggregate demand’ in no uncertain terms. That is, the deficit is too small. And the new Congress is heck bent on deficit reduction and the majority supports the balanced budget amendment to the constitution that needs only a few more states to pass.

So the recent data shows export growth fading, credit expansion fading, housing soft and housing prices in decline, car sales past their peak, retail sales fading, and even industrial production fading.

Not to mention the Saudi price cutting that could easily wipe out the energy related investment component of GDP.

Employment Situation
payrolls-oct

Highlights
The October employment situation was mixed. Payroll jobs advanced but below expectations. The unemployment rate ticked down again. But wages remained soft. The data will let the Fed remain loose.

Nonfarm payroll jobs advanced 214,000 in October after gaining 256,000 September and 203,000 in August. Net revisions for August and September were up 31,000. The median market forecast for October was for a 240,000 boost.

The unemployment rate dipped to 5.8 percent in October from 5.9 percent in September. Expectations were for 5.9 percent.

Going back to the payroll report, private payrolls grew 209,000 after advancing 244,000 in September. Analysts projected 235,000.

Average hourly earnings edged up 0.1 percent after no change in September. Market forecasts were for 0.2 percent. Average weekly hours ticked up to 34.6 hours versus 34.5 hours in September. Projections were for 34.6 hours.

Essentially, the labor market is improving but slowly and remains soft. Based on today’s data and unless the numbers strengthen faster the Fed likely will not rush increases in policy rates.
payrolls-oct-graph

pr-1

pr-2

pr-3

pr-4

pr-5

Store sales, Trade

A lesser indicator but might be indicative at the moment:

ICSC-Goldman Store Sales

trade-balance store-sales-graph

Redbook

red-book-11-1
Highlights
Both ICSC-Goldman and Redbook report slowing in the November 1 store-sales week with Redbook’s year-on-year same-store rate down 5 tenths to plus 3.9 percent. Redbook notes that this year’s late week Halloween, which fell on a Friday, may have backfired, having on the one hand boosted sales at those stores focusing on Halloween items but reducing sales at other retailers. Still, Redbook’s month-to-month comparison is plus 0.2 percent which offers a marginally positive indication for the ex-auto ex-gas reading of the government’s October retail sales report. Individual stores will post their October results on Thursday.

Trade a bit less then expected is also a downward revision to q3 GDP as exports fell.
Recall a prior post indicating the trade contribution to GDP looked suspect to the high side.
This is a partial adjustment.

Lower oil prices will help, but that also means less oil income for foreign producers who also buy our exports.

International Trade

trade-balance
Highlights
Slower global growth may have worsened the U.S. trade deficit in September. The trade gap in September expanded to $43.0 billion from $40.0 billion in August,

Exports declined 1.5 percent in September, following a rise of 0.3 percent in August. Imports were unchanged, following a 0.1 percent uptick the month before.

The petroleum gap grew to $14.0 billion from $13.1 billion in August. The goods excluding petroleum gap increased to $47.2 billion from $45.5 billion in August. The services surplus slipped to $19.6 billion from $20.2 billion.

Overall, slower global growth is nudging down growth in the U.S. But recently lower oil prices likely will result in a favorable number for October.

NFIB, Mtg apps, retail sales, Empire State

Today’s releases are causing analysts to reduce their GDP forecasts for Q3, which ended Sept 30. Note the difficulty in forecasting the past when considering the difficulty in forecasting the future…

This was released yesterday, turned down from not so good levels:

NFIB Small Business Optimism Index


Full size image

Mtg purchase apps down and cash sales down as well, makes it problematic for total sales to rise?

MBA Purchase Applications


Highlights
The steep drop underway in mortgage rates is sharply stimulating demand for refinancing but isn’t yet doing much for home purchases. The refinancing index surged 11.0 percent in the October 10 week as the average rate for conforming loans ($417,000 or less) fell 10 basis points in the week to 4.20 percent which is the lowest average since June last year. But in contrast, the purchases index fell 1.0 percent in the week for a year-on-year decline of 4.0 percent.


Full size image

Bank mtg lending way down from a year ago, flattish this year:

At Wells Fargo and Chase, mortgage lending inches up

By Ruth Mantell

Oct 14 (MarketWatch) — Wells Fargo the country’s No. 1 mortgage originator, said it made $48 billion in new home loans in the third quarter, a hair up from the prior quarter, and down 40% from the year-earlier period. Meanwhile, J.P. Morgan Chase JPM the second-largest mortgage lender, said its third-quarter originations hit $21 billion, up from $17 billion in the second quarter, and down 48% from a year earlier. Some qualified borrowers can’t get a mortgage because of many lenders’ strict standards that aim to shield banks from the financial risks that come with the possibility of having to buy back a questionable loan, said John Stumpf, chairman and chief executive at Wells, on aTuesday conference call.

Recall last month when retail sales were up an unexpected .6% I wrote about how 13 state had tax holidays in August which may have moved sales forward from September, which just came out weaker than expected at -.3%, leaving the down trend intact:

Retail Sales


Highlights
As expected, auto sales and gasoline sales tugged down on retail sales in September. But core numbers were weaker than expected. Retail sales in September declined 0.3 percent after jumping 0.6 percent in August. Analysts forecast a 0.1 percent dip for September. Excluding autos, sales slipped 0.2 percent after gaining 0.3 percent in August. Expectations were for a 0.3 percent increase. Excluding both autos and gasoline sales dipped 0.1 percent, following a jump of 0.5 percent in August. Expectations were for 0.5 percent.

Within the core, softness was seen in declines furniture & home furnishings, building materials, nonstore retailers, clothing & accessories, and sporting goods & hobbies. Gains were posted for electronics & appliances (likely iPhones), health & personal care, general merchandise, and food services & drinking places.

Today’s report is very mixed. It was not surprising that a downswing in autos after a strong August pulled down sales. And the same was expected for gasoline prices pulling down sales. But core sales eased despite a surge in electronics sales. Core sales eased after a very strong August. On a very positive note, food services & drinking places gained a robust 0.6 percent, matching the pace for August.

I don’t put much stock in these as they seem to follow the stock market, as this exceptional drop seems to confirm. Or maybe the stock market leads weakness…