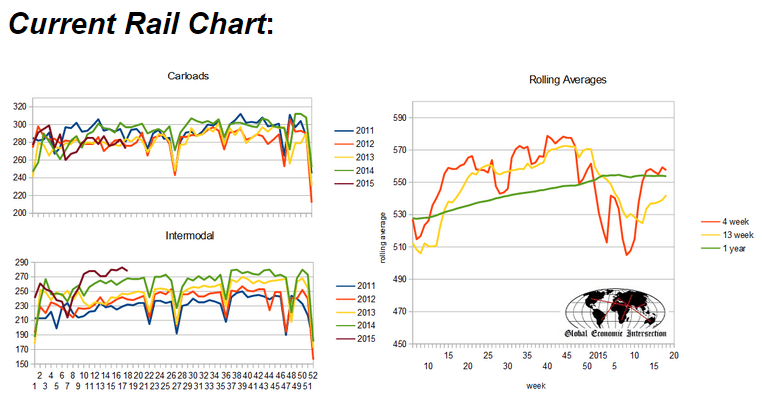
(Econintersect) — Week 18 of 2015 shows same week total rail traffic (from same week one year ago) declined according to the Association of American Railroads (AAR) traffic data. Intermodal traffic improved, which accounts for half of movements – but weekly railcar counts goes deeper into contraction.
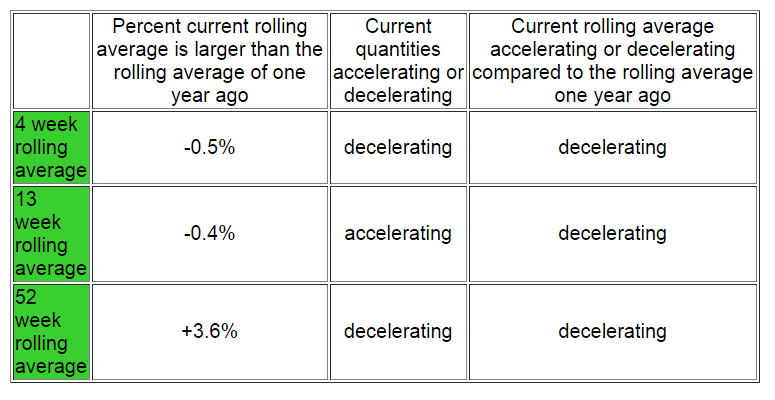
This analysis is looking for clues in the rail data to show the direction of economic activity – and is not necessarily looking for clues of profitability of the railroads. The weekly data is fairly noisy, and the best way to view it is to look at the rolling averages which generally are in a weak growth cycle.
A summary of the data from the AAR:
The Association of American Railroads (AAR) today reported U.S. rail traffic for the week ending May 9, 2015.
For this week, total U.S. weekly rail traffic was 551,034 carloads and intermodal units, down 2.3 percent compared with the same week last year.
Total carloads for the week ending May 9, 2015 were 273,433 carloads, down 7.9 percent compared with the same week in 2014, while U.S. weekly intermodal volume was 277,601 containers and trailers, up 3.8 percent compared to 2014.
Four of the 10 carload commodity groups posted increases compared with the same week in 2014. They include: motor vehicles and parts, up 8.9 percent to 18,997 carloads; petroleum and petroleum products, up 6.1 percent to 15,464 carloads; and miscellaneous carloads, up 3.6 percent to 9,220 carloads. Commodity groups that saw decreases during this one week included: coal, down 16.1 percent to 93,691 carloads; metallic ores and metals, down 12.1 percent to 23,572 carloads; and grain, down 11.2 percent to 17,959 carloads.
For the first 18 weeks of 2015, U.S. railroads reported cumulative volume of 5,043,559 carloads, down 1.8 percent from the same point last year; and 4,679,513 intermodal units, up 1.7 percent from last year. Total combined U.S. traffic for the first 18 weeks of 2015 was 9,723,072 carloads and intermodal units, a decrease of 0.1 percent compared to last year.
North American rail volume for the week ending May 9, 2015 on 13 reporting U.S., Canadian and Mexican railroads totaled 368,931 carloads, down 7.5 percent compared with the same week last year, and 350,845 intermodal units, up 3.2 percent compared with last year. Total combined weekly rail traffic in North America was 719,776 carloads and intermodal units, down 2.6 percent. North American rail volume for the first 18 weeks of 2015 was 12,681,610 carloads and intermodal units, up 1 percent compared with 2014.
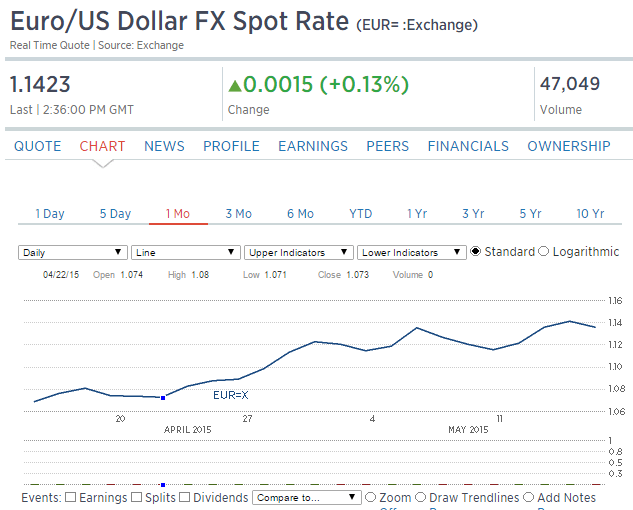
Here we go. This kind of thing previously had caused the euro to fall vs the dollar. If it doesn’t happen this time there’s a serious problem brewing. And right now the euro is up on the day…
Draghi helps stocks
Aside from individual stocks, sentiment received a boost from the ECB on Friday. Draghi said Thursday that the central bank will “implement in full” its bond-buying program and it will stay in place “as long as needed.”
“While we have already seen a substantial effect of our measures on asset prices and economic confidence, what ultimately matters is that we see an equivalent effect on investment, consumption and inflation,” Draghi said, according to the text of a speech delivered in Washington.
“To that effect, we will implement in full our purchase program as announced and, in any case, until we see a sustained adjustment in the path of inflation.”
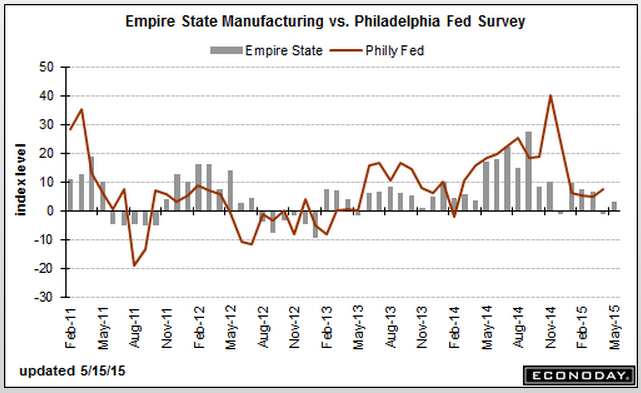
Empire State Mfg Survey

Highlights
The first indication on May conditions in the manufacturing sector is soft, as indications have been all year. The Empire State index came in at 3.09, below what were already weak Econoday expectations for 5.00. Shipments look respectable at 14.94 but are way ahead of new orders, at only 3.85, and even further ahead of backlog orders which are in deep contraction at minus 11.46. Employment growth is down as is the 6-month outlook, both pointing to a lack of optimism.
Price readings in this report stand out, pointing to even less pressure than in April with input cost inflation very subdued, down nearly 10 points to 9.38, and with virtually no price traction at all for finished goods, at only 1.04.
The manufacturing sector, hurt in part by weak exports, looks to be more and more of a drag at a time when economic growth is supposed to be on a springtime rebound. Next indication on the May manufacturing sector will be next Thursday with the Philly Fed report. Later this morning the industrial production report will offer the first definitive data on the April manufacturing sector.
This is bad too:
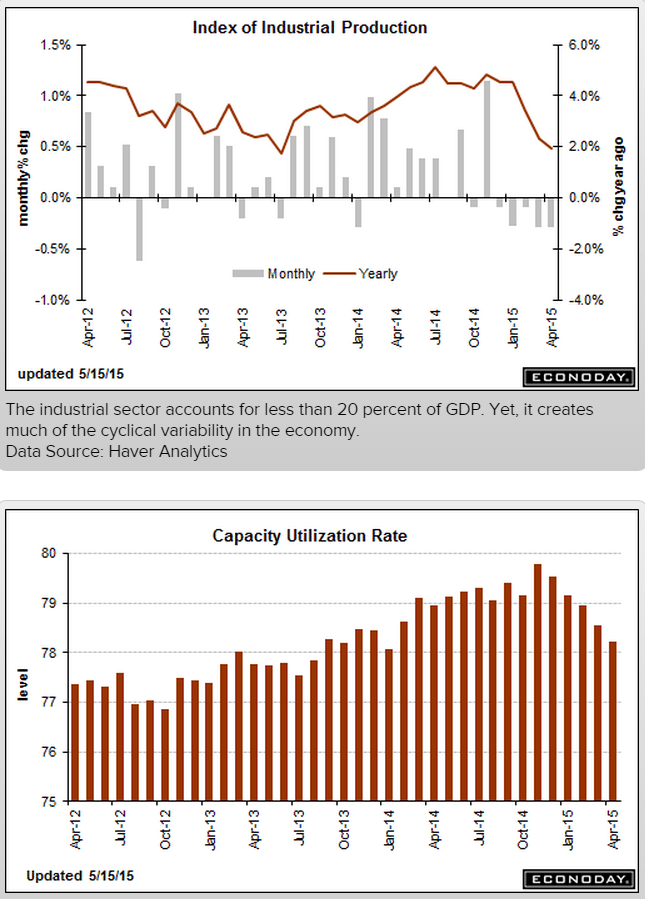
Industrial Production
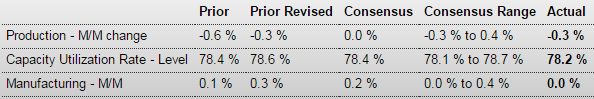
Highlights
Industrial production is stalling, down 0.3 percent in April for a 5th straight monthly contraction. Factories are cutting back with capacity utilization down 4 tenths to 78.2 percent. And the manufacturing component, which has been flat to negative all year, is unchanged. All these readings are at or near the Econoday low-side forecasts.
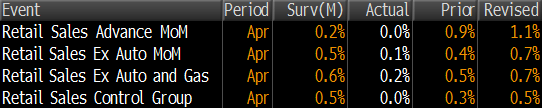
Among manufacturing subcomponents, consumer goods output fell 0.3 percent with business goods down 0.4 percent. Construction supplies rose only fractionally but at 0.1 percent the reading is the best all year (this a reminder of how weak construction and housing has been). A positive is a second strong month for auto output, up 1.3 percent on top of March’s 4.3 percent surge, but whether output increases further will depend on auto sales which, in yesterday’s retail sales report, turned lower in April.
The two other main components in today’s report show even greater weakness with mining, hurt by oil & gas, at minus 0.8 percent for the 6th contraction in 7 months and utilities at minus 1.3 percent for a 2nd straight decline.
The industrial economy remains flat and is holding down what is supposed to be the economy’s springtime bounce. The news from the factory sector, including this morning’s Empire State report, won’t be pulling forward expectations for the Fed’s first rate hike.
Even this has suddenly broken:
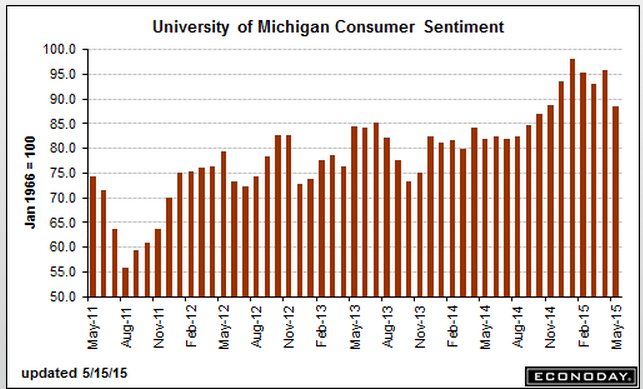
Consumer Sentiment

Highlights
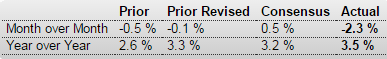
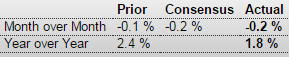
Consumer confidence had been holding, as the FOMC assured us just a couple of weeks ago, at high levels, but perhaps less so now with the consumer sentiment index at 88.6 which is nearly 5 points below Econoday’s low-side forecast. Both components show weakness with current conditions down 7.2 points to 99.8 and expectations down 7.3 points to 81.5. These are the lowest readings since October and November of last year.
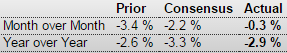
At the same time that confidence is going down, inflation expectations, reflecting rising gasoline prices, are going up. Expectations 1-year out are up 3 tenths to 2.9 percent while expectations 5-years out are up 2 tenths to 2.8 percent. Despite the turn higher, however, these are still low levels.
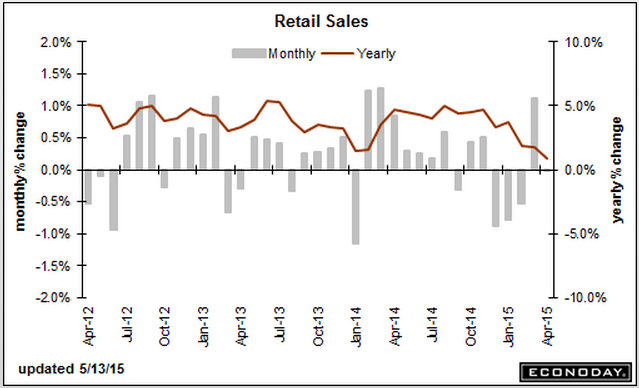
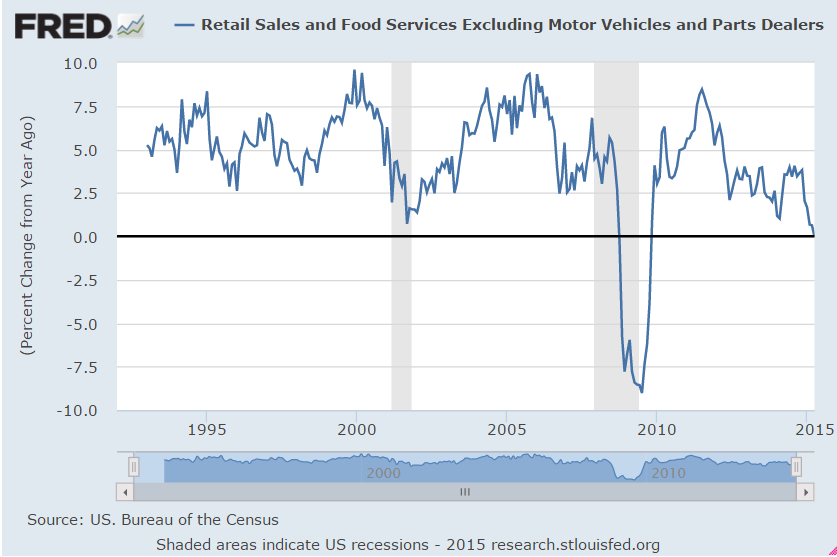
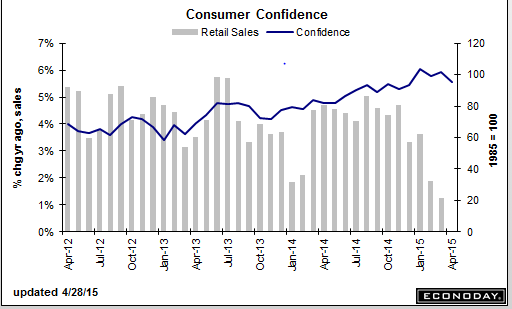
The drop in current conditions hints at softness in this month’s jobs market while the drop in expectations is a downgrade for the outlook on jobs. The hawks at the Fed have been anticipating, perhaps over anticipating, that strong consumer confidence levels would eventually translate to gains for retail sales. Retail sales have been flat along and now consumer confidence, based at least on today’s consumer sentiment report, is moving backwards.
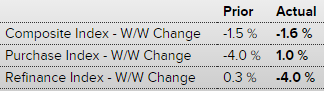
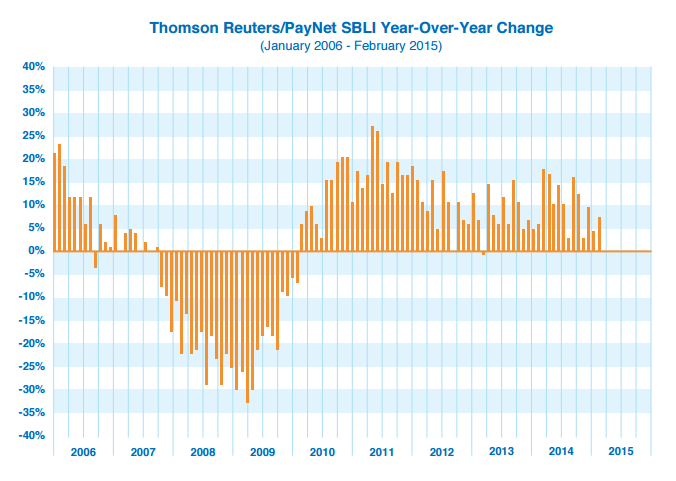
Of the nearly 1.6 million loan originations in Q1, 471,822 were purchase loan originations, down 25% from the prior quarter and up less than 1% from a year ago. There were 1,080,043 refinance originations in Q1, an increase of 6% from the prior quarter and 27% from a year ago.