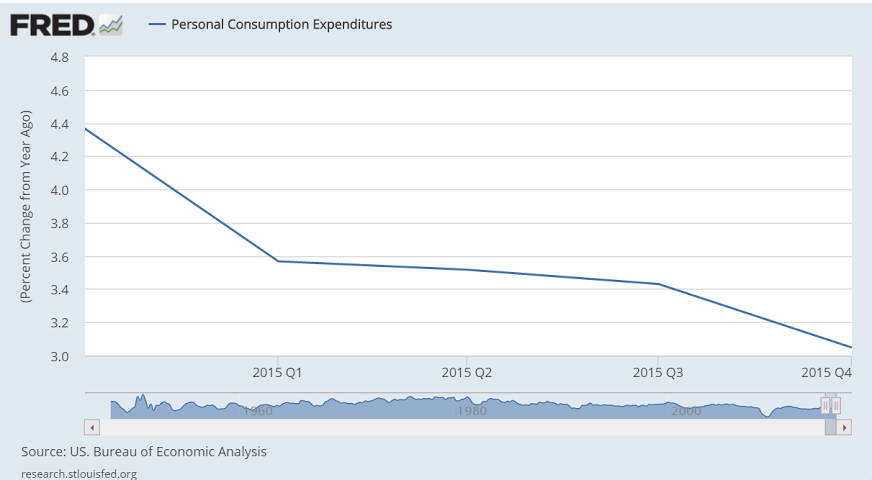
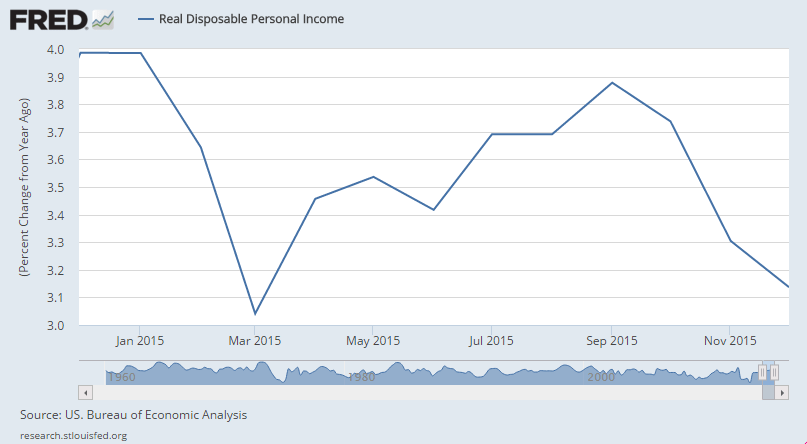
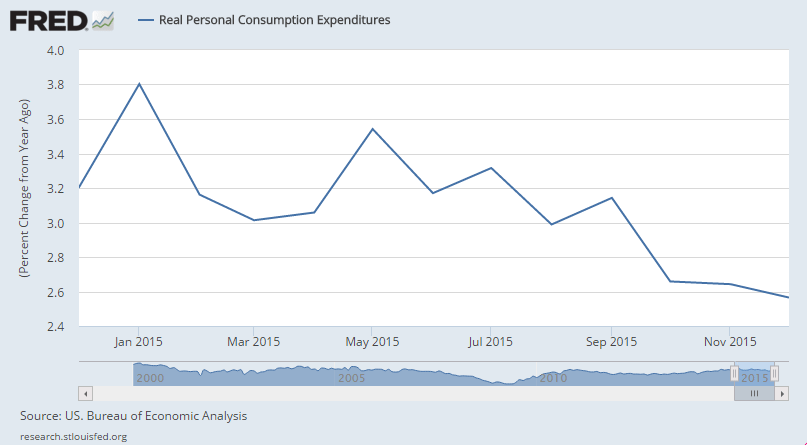
Spending still not good, and GDP *is* spending. Personal income growth remains low, but is higher than spending. I suspect this gets reconciled with downward revisions to income over time, perhaps due to downward revisions to employment.
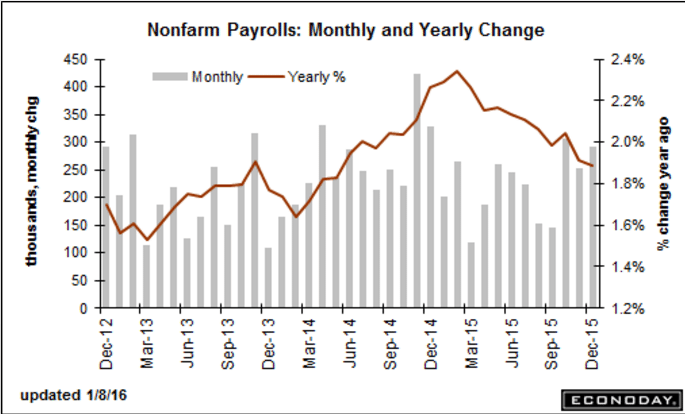
With GDP growth near flat employment growth implies more employees are being hired to produce the same levels of output, which sends up a red flag for downward revisions to employment.
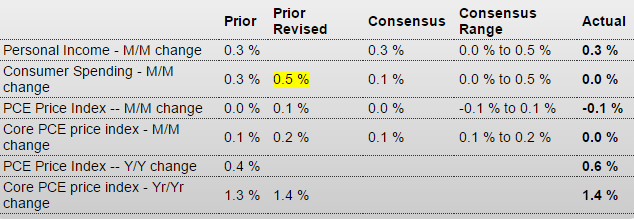
Personal Income and Outlays
Highlights
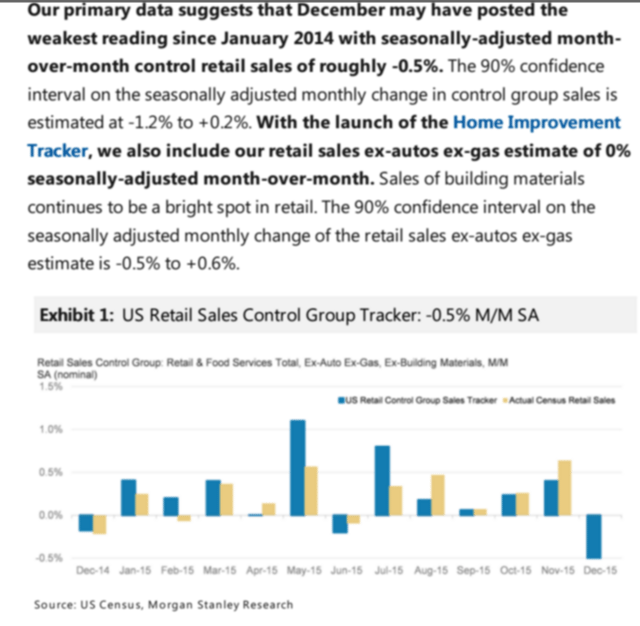
Consumers had a healthy December but kept the money to themselves. Personal income rose a solid 0.3 percent with the savings rate moving 2 tenths higher to 5.5 percent, its strongest level since December 2012. Wages & salaries, however, slowed to only plus 0.2 percent in the month but follow outsized gains of 0.5 and 0.6 percent in the prior two months. Service industries lead the pay data with manufacturing pay in contraction. Proprietors’ income rose in the month along with rental income while income receipts were down on lower interest income, the latter reflecting, despite the Fed’s rate hike, the downdraft in rates.
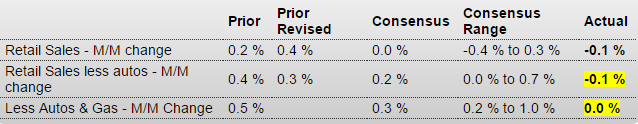
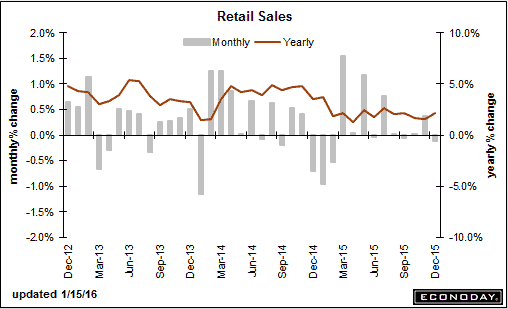
Spending, as retailers already know, was very soft, unchanged with only services showing a gain. December spending on both durable and non-durable goods fell 0.9 percent each, the former reflecting weak spending on holiday gifts and also vehicles and the latter reflecting lower hitting bills. A partial offset is a 2 tenths upward revision to November’s spending to plus 0.5 percent.
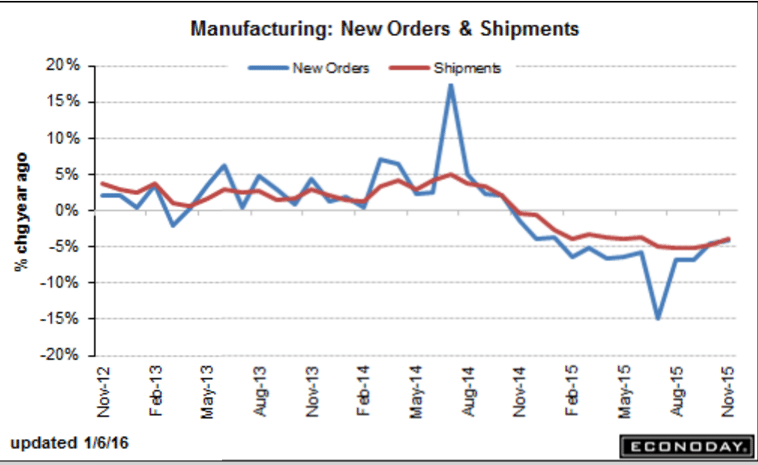
More bad, and downward revisions as well:
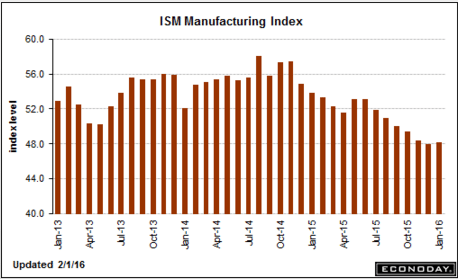
ISM Mfg Index
Highlights
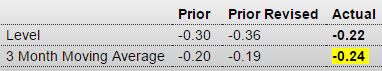
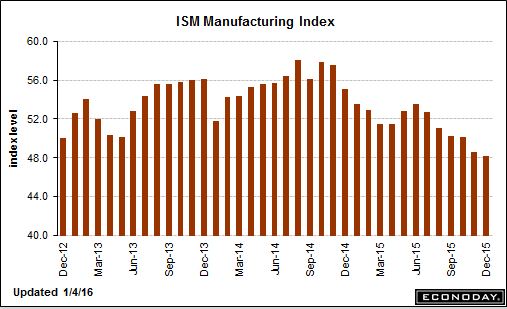
Employment sank the ISM index in January which could muster no better than a 48.2 for what, following annual revisions to 2015, is the fourth sub-50 reading in a row. This is by far the worst run for this closely watched indicator since the Great Recession days of 2009.
Employment fell a very steep 2.1 points to 45.9 to signal significant contraction for manufacturing payrolls in Friday’s employment report, which however would not be much of a surprise given the sector’s prior payroll contraction. This is the third sub-50 reading for employment of the last four months and the lowest reading since, once again, 2009.
There is good news in the report and that’s a snapback for new orders, to 51.5 for only the second plus 50 reading of the last five months and which points to overall improvement in the coming reports. But backlog orders, at only 43.0, remain in deep contraction, and what strength there is in orders isn’t coming from exports which are in contraction for the seventh of the last eight months. Manufacturers have been working down backlogs to keep production up, which came in at 50.2 to signal fractional monthly growth. Inventories remain steady and low but the sample still say they are too high, sentiment that points to lack of confidence in the business outlook.
Confirming the weakness is breadth among industries with 10 reporting composite contraction against eight reporting monthly growth. If it wasn’t for strength in new orders, January’s data would be almost entirely negative. This report is a downbeat opening to 2016 which follows a definitively downbeat year for the factory sector in 2015.

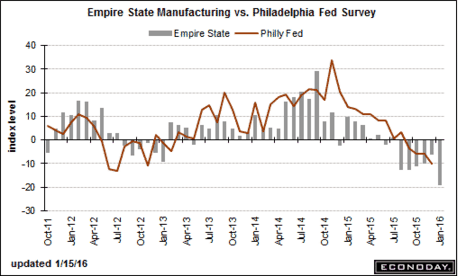
No mention of the NY tax breaks that expired in June:
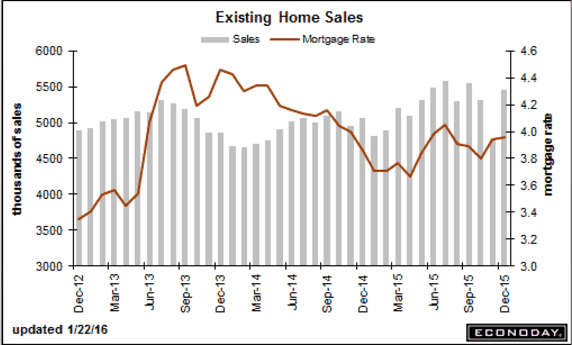
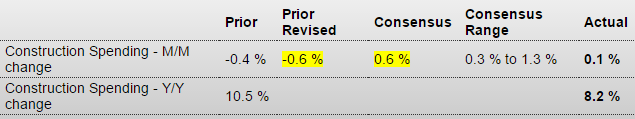
Construction Spending
Highlights
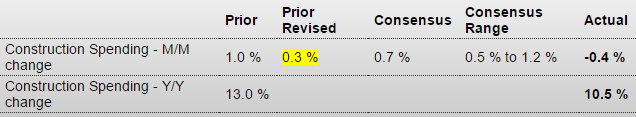
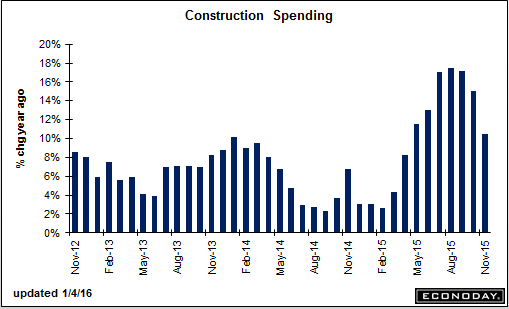
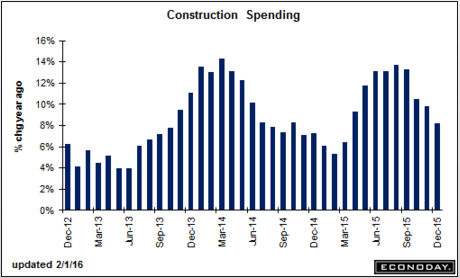
Held down by weakness in the nonresidential component, construction spending didn’t get a lift at all from the mild weather late last year, rising only 0.1 percent in December following a downwardly revised 0.6 percent decline in November and a 0.1 percent contraction in October. Year-on-year, spending was up 8.2 percent, a respectable rate but still the slowest since March last year.But there is very good news in the report and that’s a very strong 0.9 percent rise in residential construction where the year-on-year rate came in at plus 8.1 percent. Spending on multi-family units continues to lead the residential component, up 2.7 percent in the month for a 12.0 percent year-on-year gain. Single-family homes rose 1.0 percent in the month for an 8.7 percent year-on-year gain.
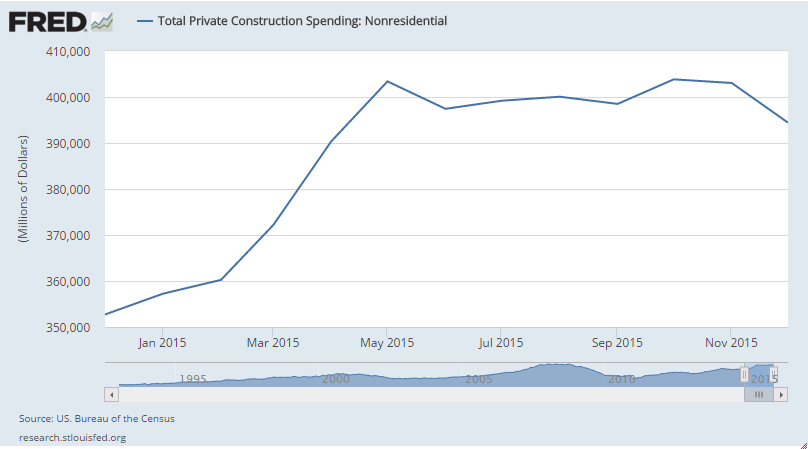
Now the bad news. Non-residential spending fell 2.1 percent following a 0.2 percent decline in November. Steep declines hit manufacturing for a second month with the office and transportation components also showing weakness. Still year-on-year, non-residential construction rose 11.8 percent.
Rates of growth in the public readings are led by highway & streets, at a 9.4 percent surge for December and a year-on-year rate of plus 12.0 percent. Educational growth ended 2015 at 9.4 percent with state & local at plus 4.4 percent. The Federal subcomponent brings up the rear at minus 1.4.
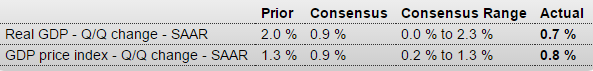
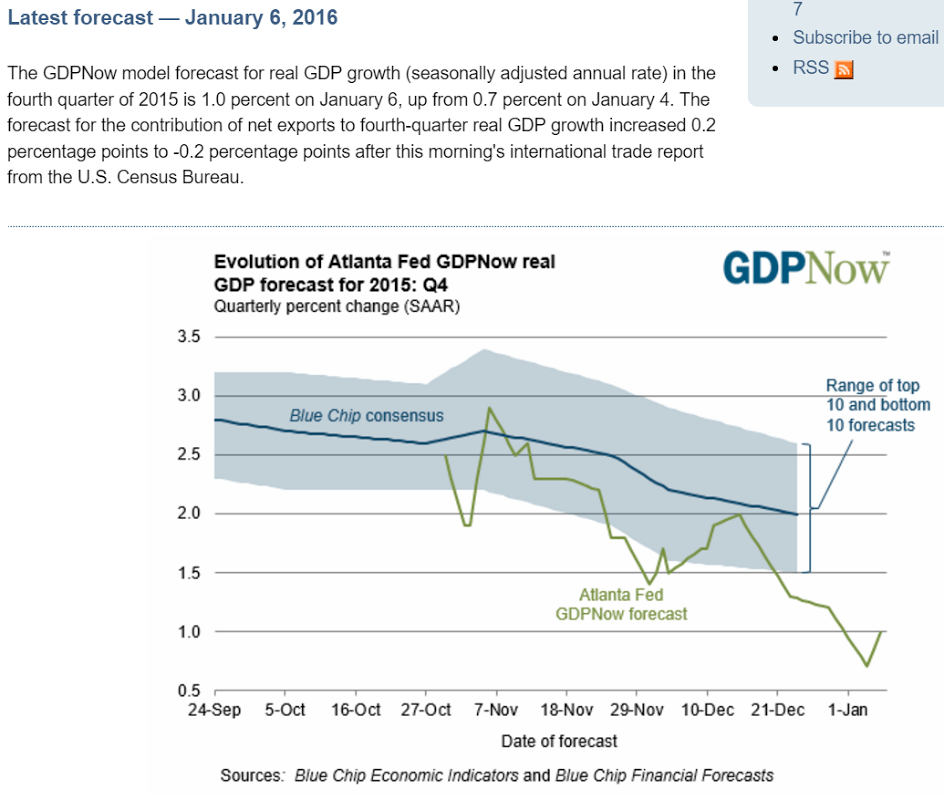
Lack of business confidence and cutbacks for business spending are evident in this report but not troubles on the consumer side, where residential spending remains very solid and a reminder that the housing sector is poised to be a leading driver for the 2016 economy. Still, the weak December and revised November headlines are likely to pull down, at least slightly, estimates for revised fourth-quarter GDP which came in at plus 0.7 percent in last week’s advance report.
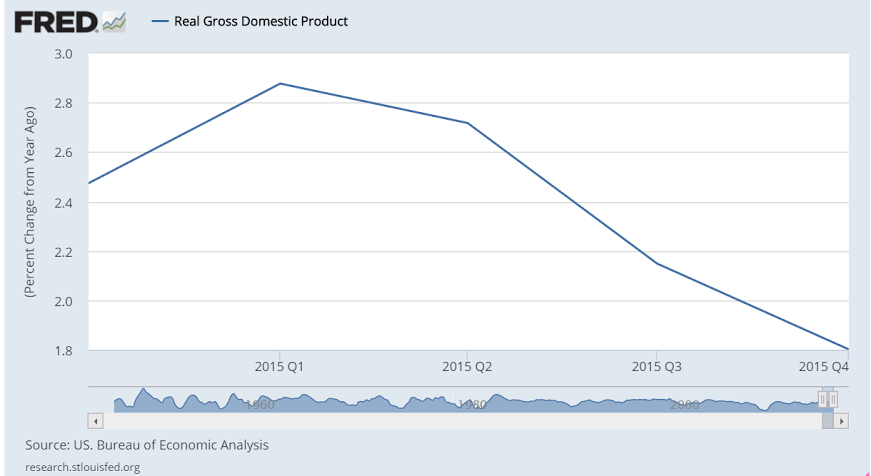
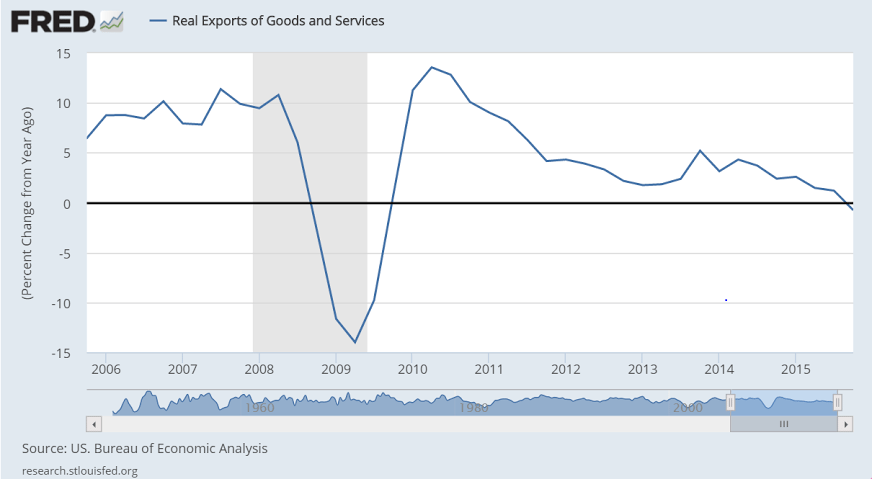
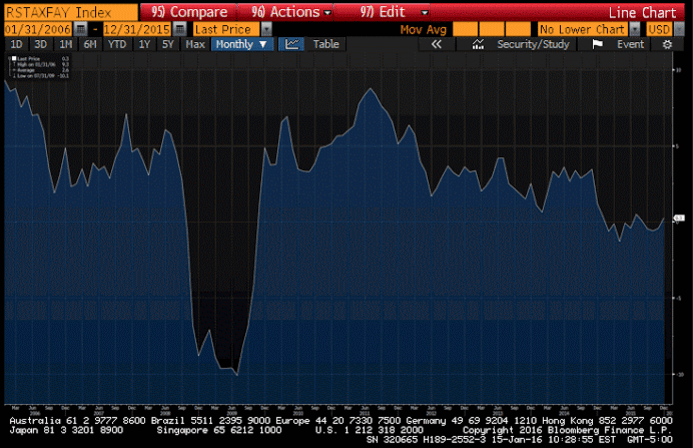
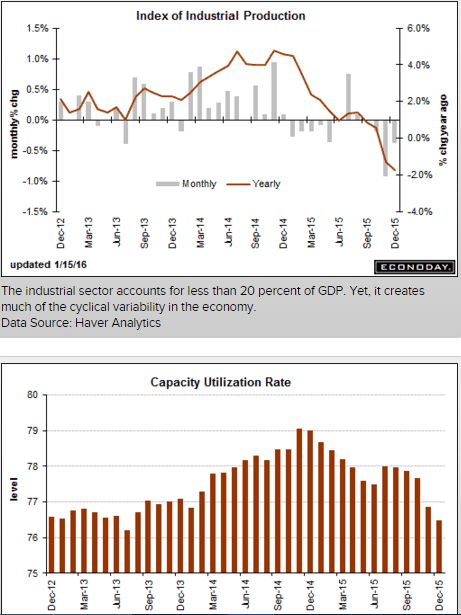
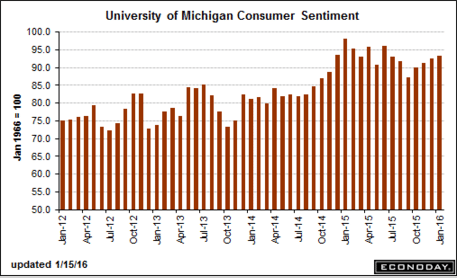
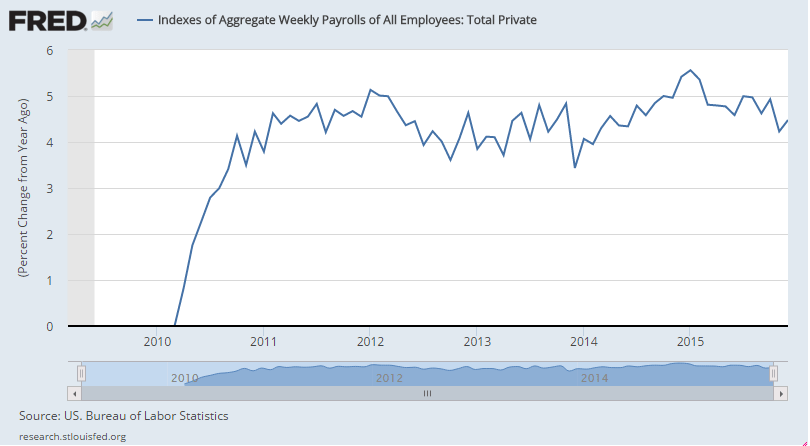
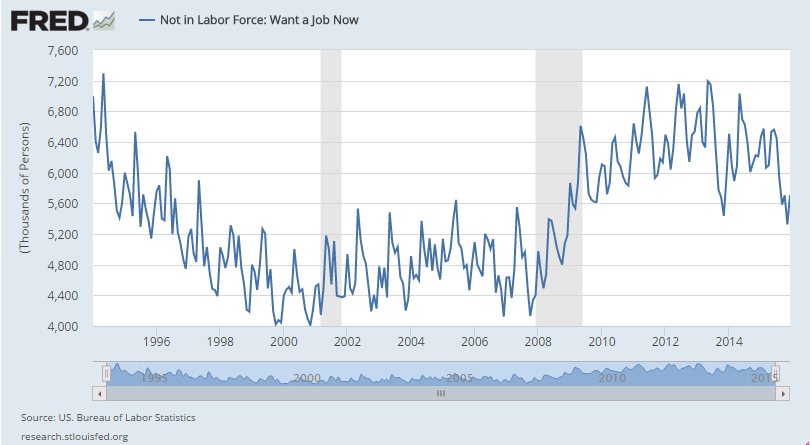
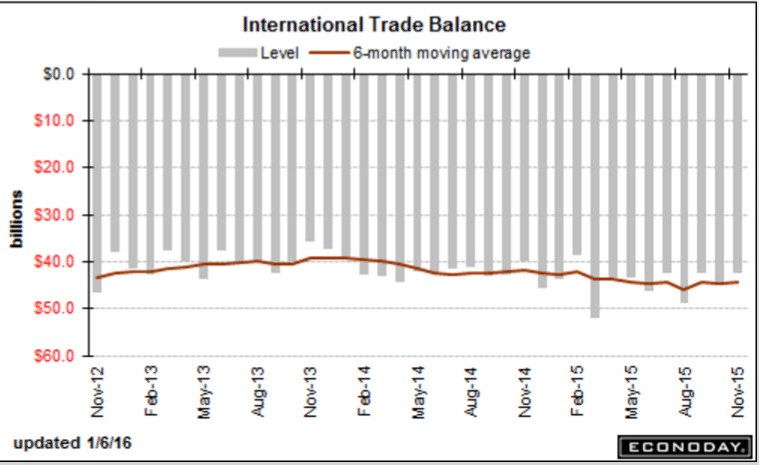
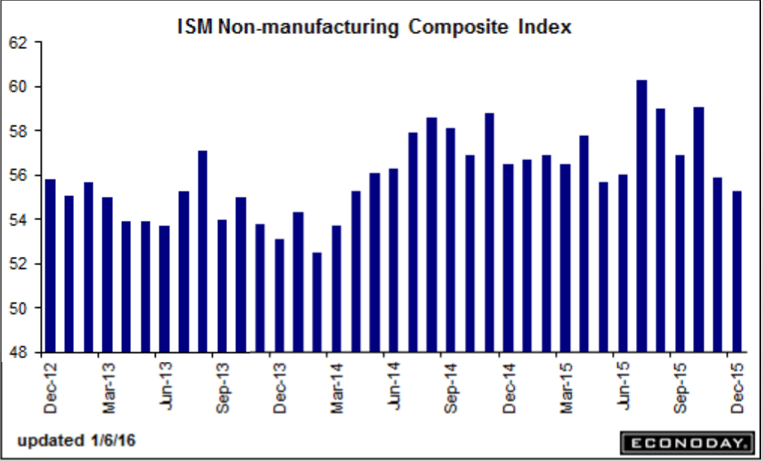
A blind man can see this chart has been decelerating for a long time now:
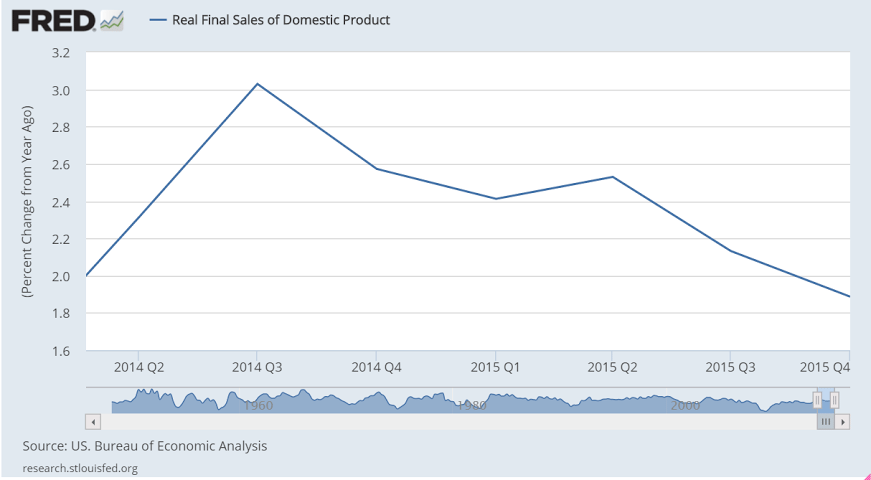
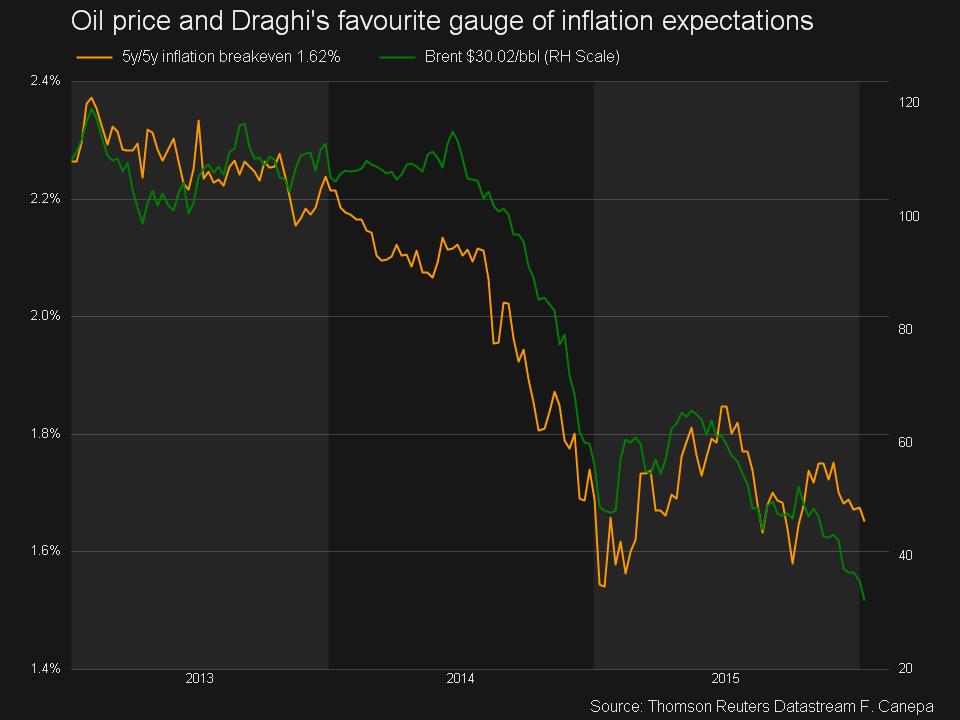
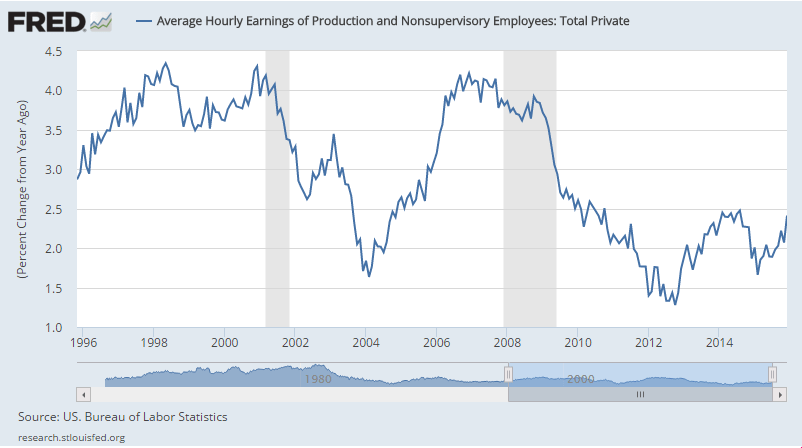
Looks to me like it was growing but then flattened out not long after oil capex spending collapsed?
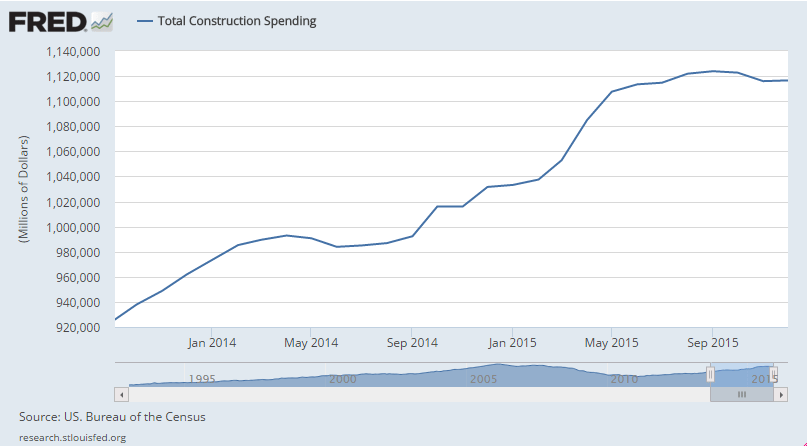
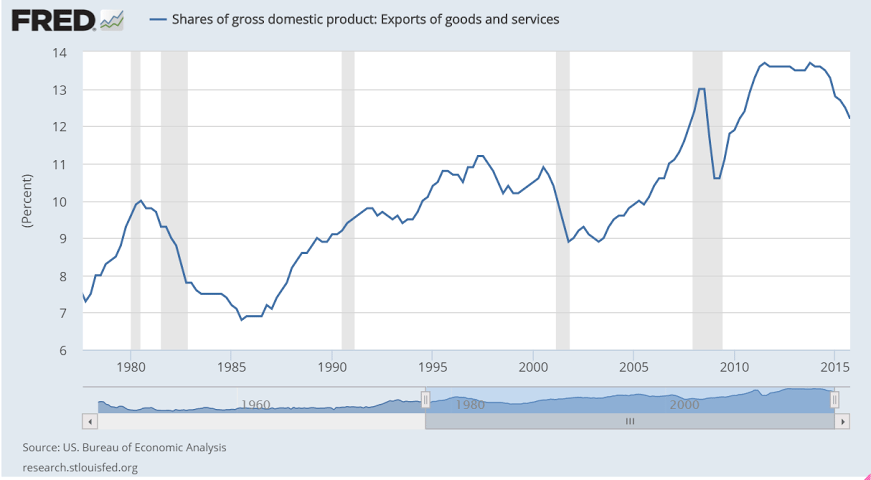
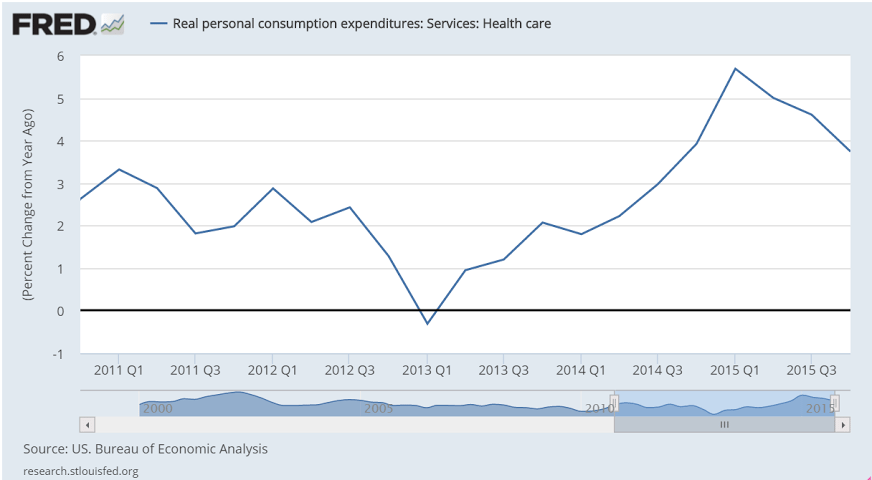
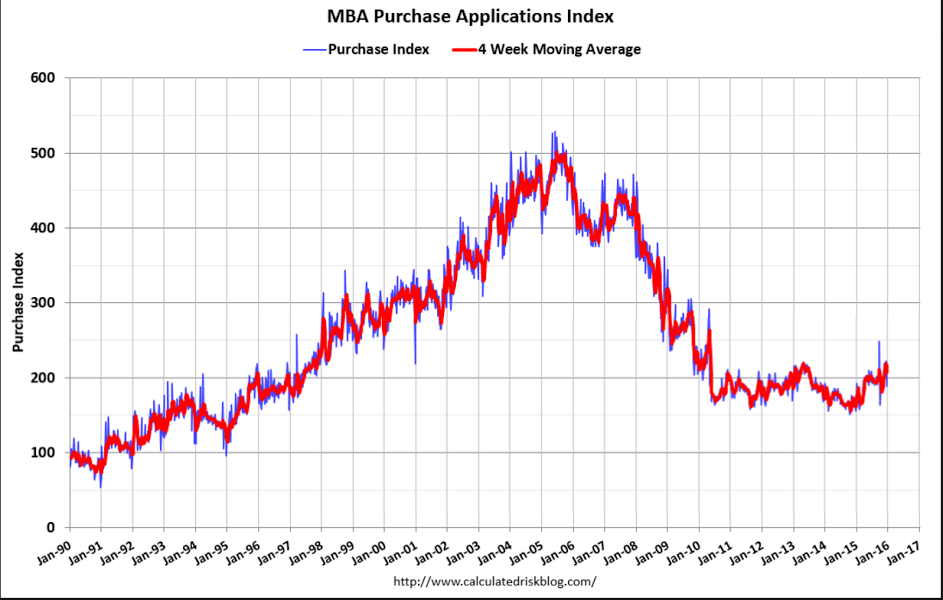
This is the ‘driver’ for 2016?
It’s only now just back to 2004 levels, and not growing nearly as fast as the prior cycle, and this chart isn’t adjusted for inflation, which brings it’s influence down that much more: