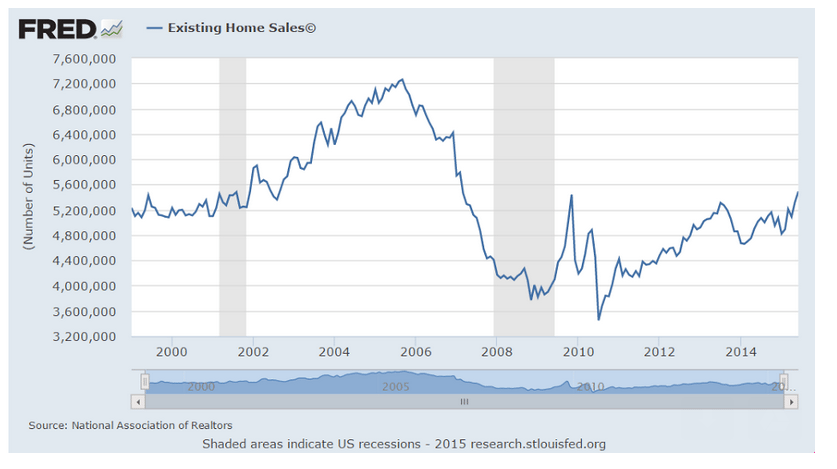
Still bad:
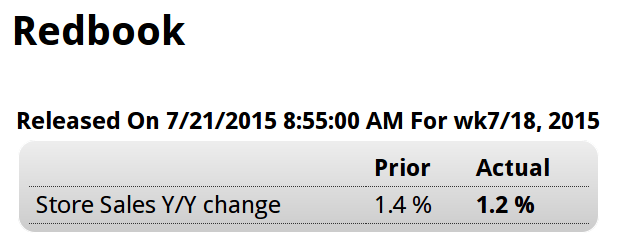
Softening:
I don’t put much weight on Markit surveys, but the optimism comment is interesting:
source: Econoday.com
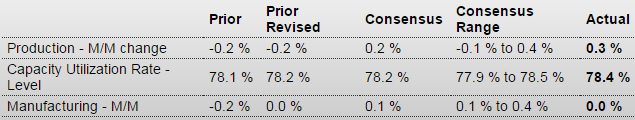
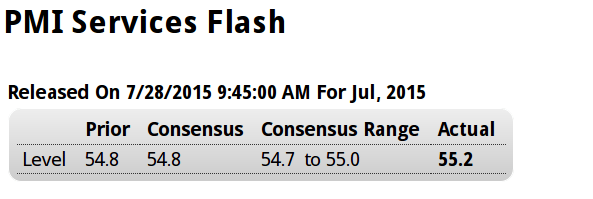
Highlights
Service sector growth is strengthening slightly this month based on Markit’s July flash index which is up 4 tenths to a very solid 55.2. New orders are at a 3-month high and are getting a boost from both consumer spending and from business customers, the latter a welcome signal of strength for business investment. Backlogs are up and so is hiring. But optimism in the 12-month outlook, perhaps shaken by the outlook for the global economy, is the softest it’s been in three years. Input prices continue to rise but final prices are flat. This report is mostly upbeat and, despite the easing in the outlook, points to solid contribution from the service sector.
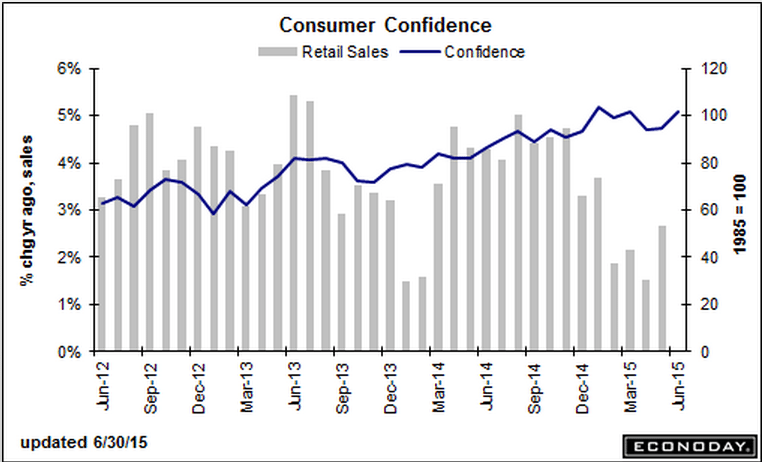
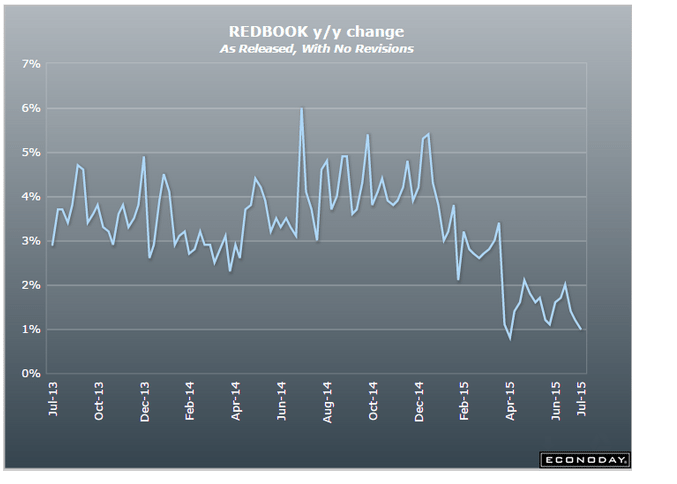
This kind of drop is concerning, and I’ve been watching for employment, a lagging indicator, to take a dive:
source: Econoday.com
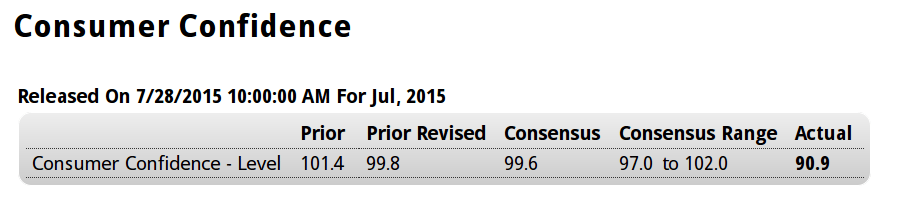
Highlights
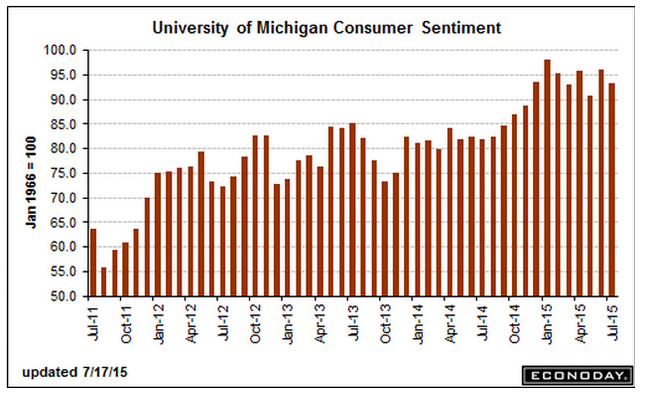
Consumer confidence has weakened substantially this month, to 90.9 which is more than 6 points below Econoday’s low estimate. Weakness is centered in the expectations component which is down nearly 13 points to 79.9 and reflects sudden pessimism in the jobs outlook where an unusually large percentage, at 20 percent even, see fewer jobs opening up six months from now.Less severe is weakness in the present situation component which is down nearly 3 points to 107.4. Here, slightly more, at 26.7 percent, say jobs are hard to get but this is still low for this reading.
A striking negative in the report is a drop in buying plans for autos which confirms weakness elsewhere in the report. Inflation expectations are steady at 5.1 percent which is soft for this reading.
This report is citing problems in Greece and China as possible factors for the decline in expectations, but US consumers are typically insulated from international events. The decline in expectations, mirrored earlier this morning by a similar decline in the service-sector outlook, may be sending early hints of second-half slowing, slowing that could push back of course the Fed’s expected rate hike.
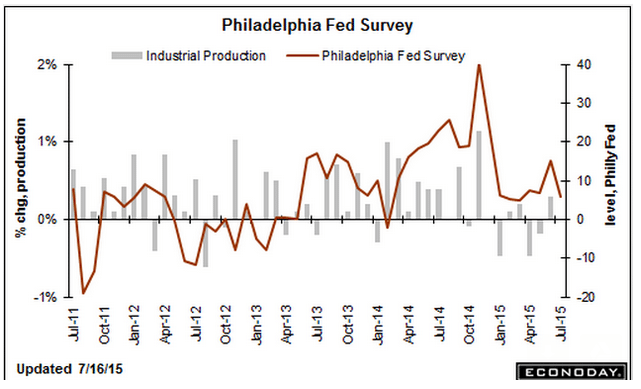
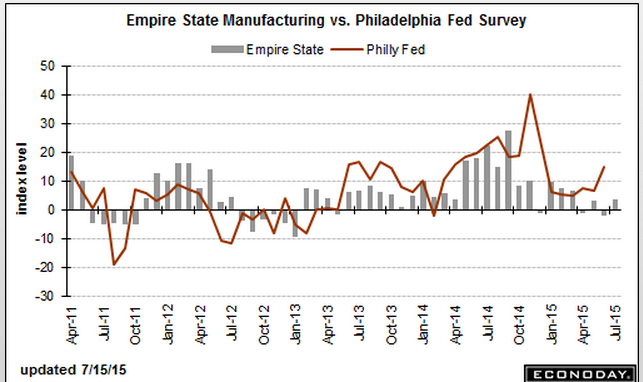
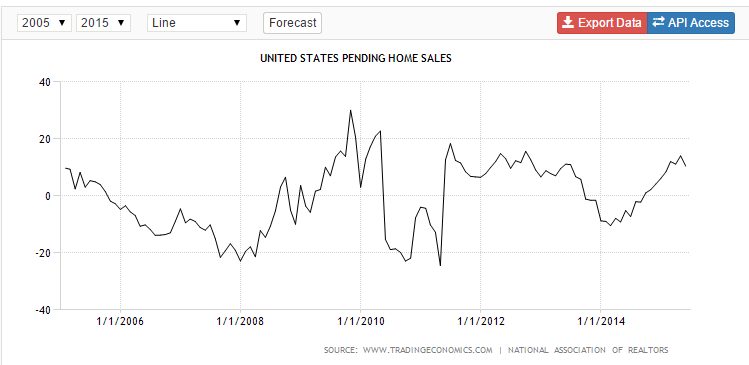
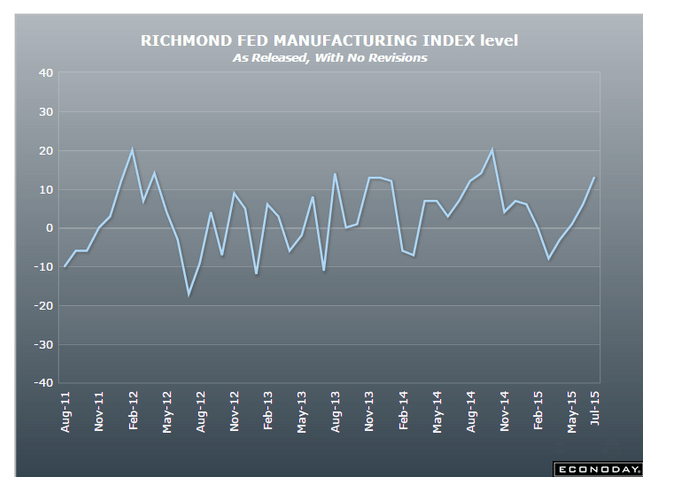
A bit better, but another reference to softening employment. And note the volatility of this series, with moves up often followed quickly with moves down:
source: Econoday.com
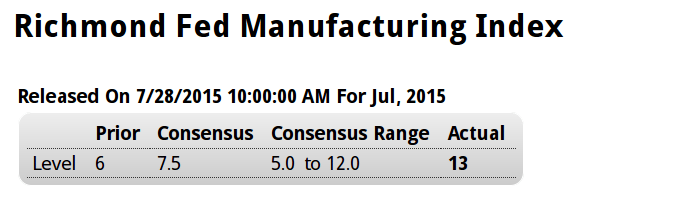
Highlights
The Richmond Fed is reporting the best strength of any manufacturing region this month, at 13 which is above the Econoday top-end estimate. New orders are especially strong, up 7 points to 17, with backlog orders also rising, up 7 points to 10. Shipments are strong, capacity utilization is up and inventories, because of the activity, are being drawn down. Hiring, however, is slowing. Price data show slight pressure for inputs but no pressure for finished goods.
This report contrasts with much slower rates of growth in the New York and Philadelphia Fed regions and sharply contrasts with recent data from the Dallas and Kansas City Feds where manufacturing, due to the energy sector, is in deep contraction. But today’s result is a welcome positive, suggesting that manufacturing may yet pick up this year and a reminder of strength in yesterday’s durable goods report.
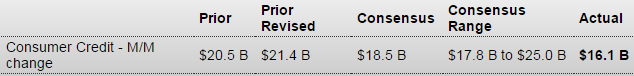
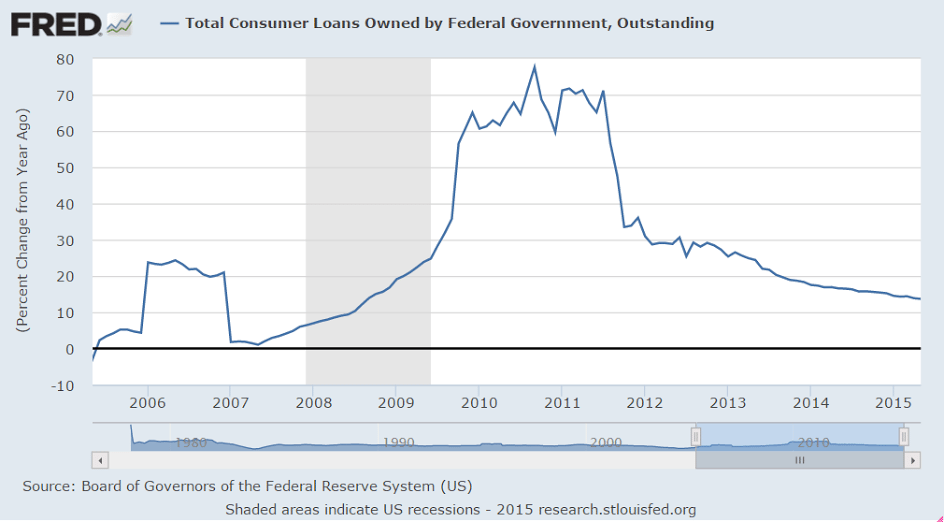
This had been estimated at $100 billion: