This Republican Economy

Not to mention taking $500 billion out of the medicare budget to give to the insurance companies and then declaring victory on healthcare. And the early statement about needing to first fix the financial sector before the real sector can recover.

And, of course, it would be nice if Professor Krugman would reverse his errant and highly counterproductive contention that the federal deficit presents a long term economic or financial problem per se.

This Republican Economy

By Paul Krugman

June 3 (NYT) — What should be done about the economy? Republicans claim to have the answer: slash spending and cut taxes. What they hope voters won’t notice is that that’s precisely the policy we’ve been following the past couple of years. Never mind the Democrat in the White House; for all practical purposes, this is already the economic policy of Republican dreams.

So the Republican electoral strategy is, in effect, a gigantic con game: it depends on convincing voters that the bad economy is the result of big-spending policies that President Obama hasn’t followed (in large part because the G.O.P. wouldn’t let him), and that our woes can be cured by pursuing more of the same policies that have already failed.

For some reason, however, neither the press nor Mr. Obama’s political team has done a very good job of exposing the con.

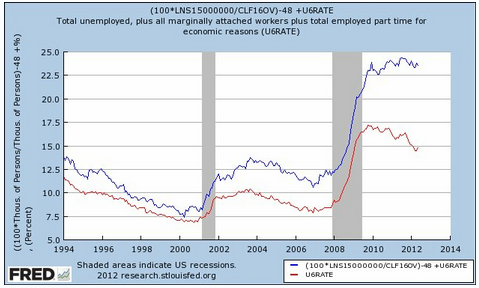
What do I mean by saying that this is already a Republican economy? Look first at total government spending — federal, state and local. Adjusted for population growth and inflation, such spending has recently been falling at a rate not seen since the demobilization that followed the Korean War.

How is that possible? Isn’t Mr. Obama a big spender? Actually, no; there was a brief burst of spending in late 2009 and early 2010 as the stimulus kicked in, but that boost is long behind us. Since then it has been all downhill. Cash-strapped state and local governments have laid off teachers, firefighters and police officers; meanwhile, unemployment benefits have been trailing off even though unemployment remains extremely high.

Over all, the picture for America in 2012 bears a stunning resemblance to the great mistake of 1937, when F.D.R. prematurely slashed spending, sending the U.S. economy — which had actually been recovering fairly fast until that point — into the second leg of the Great Depression. In F.D.R.’s case, however, this was an unforced error, since he had a solidly Democratic Congress. In President Obama’s case, much though not all of the responsibility for the policy wrong turn lies with a completely obstructionist Republican majority in the House.

That same obstructionist House majority effectively blackmailed the president into continuing all the Bush tax cuts for the wealthy, so that federal taxes as a share of G.D.P. are near historic lows — much lower, in particular, than at any point during Ronald Reagan’s presidency.

As I said, for all practical purposes this is already a Republican economy.

As an aside, I think it’s worth pointing out that although the economy’s performance has been disappointing, to say the least, none of the disasters Republicans predicted have come to pass. Remember all those assertions that budget deficits would lead to soaring interest rates? Well, U.S. borrowing costs have just hit a record low. And remember those dire warnings about inflation and the “debasement” of the dollar? Well, inflation remains low, and the dollar has been stronger than it was in the Bush years.

Put it this way: Republicans have been warning that we were about to turn into Greece because President Obama was doing too much to boost the economy; Keynesian economists like myself warned that we were, on the contrary, at risk of turning into Japan because he was doing too little. And Japanification it is, except with a level of misery the Japanese never had to endure.

So why don’t voters know any of this?

Part of the answer is that far too much economic reporting is still of the he-said, she-said variety, with dueling quotes from hired guns on either side. But it’s also true that the Obama team has consistently failed to highlight Republican obstruction, perhaps out of a fear of seeming weak. Instead, the president’s advisers keep turning to happy talk, seizing on a few months’ good economic news as proof that their policies are working — and then ending up looking foolish when the numbers turn down again. Remarkably, they’ve made this mistake three times in a row: in 2010, 2011 and now once again.

At this point, however, Mr. Obama and his political team don’t seem to have much choice. They can point with pride to some big economic achievements, above all the successful rescue of the auto industry, which is responsible for a large part of whatever job growth we are managing to get. But they’re not going to be able to sell a narrative of overall economic success. Their best bet, surely, is to do a Harry Truman, to run against the “do-nothing” Republican Congress that has, in reality, blocked proposals — for tax cuts as well as more spending — that would have made 2012 a much better year than it’s turning out to be.

For that, in the end, is the best argument against Republicans’ claims that they can fix the economy. The fact is that we have already seen the Republican economic future — and it doesn’t work.

Payrolls: Bleak with 1 Silver Lining


Karim writes:

Payrolls: Bleak with 1 Silver Lining

Highlights

  • Most of the key headlines of the survey were weak
  • Payrolls up only 69k with net revisions of -49k (April now +77k not 115k)
  • Unemployment rate up from 8.1% to 8.2% (labor force up 622k and household survey up 422k)
  • Average hourly earnings up 0.1% and index of aggregate hours -0.2%
  • Median duration of unemployment up from 19.4 weeks to 20.1 weeks and U6 unemployment rate up from 14.5% to 14.8%
  • The silver lining is that the Diffusion Index (# of industries adding jobs less those cutting jobs, indexed on a 0-100 scale) rose from 56 to 59.4
  • Downside shifts were heavily concentrated in 3 sectors (Construction -5k to -28k; Retail 27k to 2k; and Business services 37k to -1k)
  • Construction and retail (which includes leisure and hospitality) likely reflect the weather payback that Bernanke has highlighted; business services cuts likely reflect the late nature of tax season this year and some of those layoffs may not have taken place until May.

Conclusion

  • The diffusion index improvement implies the underlying state of the labor market is somewhat better than the headline; probably in the 125-150k range
  • Purely based on the economic data, additional Fed easing is unlikely
  • But the worsening of financial conditions via Europe have increased the odds of a continuation of Twist (in its current form) for at least 2-3mths

Not to overlook the increase in the labor force participation rate from 63.6 to 63.8!

And Q2 gdp talk still about 2%.
Still looks to me good for stocks, not so good for people, though lower gasoline prices good for consumers as is weak consumption overseas.

macro update

The US economy seems to be muddling through at modestly positive GDP growth, supported by a still sort of high enough 8% or so govt fiscal deficit.

The year and fiscal cliff is a looming disaster but it’s too soon for markets to discount a high chance of it actually happening.

Lower oil prices are helping the US consumer and the $US.

The stronger $US works against US exports some and earnings translations a bit as well. Weaker global demand also works against US exports.

Deficit spending in the euro zone has also been rising some, and after the latest rounds of austerity and subsequent deficit increasing weakness may total something close to 7% of GDP.

That should be enough to muddle through as well. Austerity hikes unemployment and deficits to the point where the resulting deficit is sufficient to sustain things. Without another round of austerity there should be some sort of stability of output and employment.

That is, while it’s doubtful the ‘new europe’ will engage in meaningful fiscal expansion, it may not proactively raise taxes and/or cut spending in any meaningful way, either.

So as the member nations stumble their way through each successive securities auction, it won’t surprise me if their economies sort of stabilize around 0 growth or so. And then begin to pick up a tiny bit. All supported by the current, higher levels of deficit spending.

And the lower euro could help their exports some as well.

Yes, there will be all kinds of credit related vol, but under it all there will be sales and profits taking place. The businesses that are still around are the survivors who know how to get by in this kind of economy, where, while slower than it ought to be, there is still about $40 trillion worth of goods and services getting bought/sold in the US and Europe. GDP growth has gone to near 0, but not GDP itself.

CH Daily | China to lower reserve requirement ratio

The discount rate cut doesn’t actually do anything for the economy- growth or inflation- but does show their concern.

And the relatively low Q1 state lending is showing the actual continuing policy constraint.

As previously discussed, China has what they consider an inflation problem, and there are precious few, if any, examples of inflation fights that didn’t cause hard landings.

Ch Headlines:

China to lower reserve requirement ratio
Q1 GDP slows in 29 provinces, regions
China 2012 Growth Forecast Cut to 8.1%, Citigroup Says
China 2012 Growth Outlook Revised to 8% From 8.2%, JPMorgan Says
China Growth Seen at 13-Year Low by Pimco as Banks Cut Forecast

The President’s Fairness Fiction

President Obama’s ‘Fairness’ Vision Would Bankrupt Nation

April 11 (IBD) — Economy: In two recent high-profile policy speeches, President Obama has struggled to make a case for his big-government, high-tax vision for the economy. But his comments reveal just how bankrupt his vision is.

Last I read, he’s actually reduced govt head count for maybe the first time in history, and spending as a % of GDP is up only because of transfer payments due to the recession, with taxes as a % of GDP reaching extremely low levels as well.

It’s ironic that President Obama would make two speeches this week in Florida about “fairness,” sandwiched as they were between $10,000-a-plate fundraising dinners. But that’s the level of hypocrisy coming from the White House these days.

To be polite, most of the comments Obama makes these days about the economy, taxes and, especially, “fairness” stretch all credibility. Hearing the large number of outright falsehoods and partial truths he uses to support his argument, it’s impossible not to believe it’s simply a ploy to get votes from those who envy the rich and the successful.

A full unpacking of Obama’s whoppers would require a much larger space than we have here. Here are just a few examples:

“I believe the free market is the greatest force for economic progress in human history.”

If he believed that, he would not have signed the $787 billion stimulus bill.

That helped the private sector and ‘free markets’ even though I didn’t like the details.

He wouldn’t have imposed onerous new green regulations on businesses.

Without federal pollution regulation the states get into a race to the bottom where whoever allows the most pollution gets the most businesses.

He wouldn’t have taken over the auto and banking industries.

Banking with FDIC deposit insurance makes banking a 90/10 public private partnership. And he didn’t take over banking in any case.

Nor would he seek massive new tax hikes on businesses, or use the frightening power of government — including thousands of new IRS agents to enforce ObamaCare — to pursue his utopian vision of “fairness.”

First, I’m against corporate taxes in general. But even so, he cut payroll taxes for business and the proposed increases were about closing loopholes. And Obamacare took 500 billion out of medicare to give to insurance companies- hardly pro govt/anti business.

If Obama truly believed in the free market,

And remember, there is no ‘free market’ as by definitions markets operate only within institutional structure including contract law and enforcement.

he’d eliminate Fannie Mae, Freddie Mac, the EPA, the Energy Department and many other federal departments and agencies that distort free markets.

All govt and all taxation necessarily distorts markets. All govt works on coercion. Nor are there competitive markets when there is limited competition and monopoly power, which means some form of govt regulation is required.

He would roll back thousands of costly, ineffective regulations that estimates say cost the U.S. $1.8 trillion a year.

I’d have to see the specifics, which the rest of this article makes me doubtful of.

“The gap between those at the very, very top and everybody else keeps growing wider and wider and wider and wider.”

In fact, the top 1% have a lower share of total household income than they did in 1920 — just after World War I.

So maybe 1920 was a particularly high year because of the war? Don’t know his point, except pointing to 1920 is a smokescreen to disguise the fact that the share of income has been rising dramatically for a long time.

Though the top 1% have recently boosted their share, that’s largely due to the tech boom of the 1980s, 1990s and 2000s, which made all Americans richer.

I thought it was the financial sector??? But even so, a tech boom doesn’t necessarily do that to income distribution. It doesn’t explain why the football coach earns $10 million while the professor who cured cancer gets $100,000. It’s all about institutional structure.

Even so, the so-called Gini Coefficient — the federal government’s own measure of income inequality — is today lower than it was during the Clinton era.

“At the beginning of the last decade, the wealthiest Americans got two huge tax cuts, in 2001 and 2003.”

The rich, with everyone else, did get their top tax rates cut. But the actual taxes they paid rose sharply.

Right, because their incomes rose that much more. This is out of context writing throughout, laced with lies of omission.

Don’t believe it? Just before those tax cuts were passed, the top 1% earned 18% of all adjusted gross income and paid 34% of all federal taxes.

Only because they conveniently don’t include FICA when they talk about taxes like this. But they do include it when it’s going up or down- tax cut or tax hike. And it’s something approaching half of all federal income taxes.

By 2009, the last full year for which there are data, the top 1% share of AGI had fallen to 17%, according to IRS data. But they paid 37% of all taxes.

Not including FICA

As for the bottom 50% of income earners: In 2009 they took home 13% of income but paid less than 3% of federal income taxes. And today, nearly half of all Americans don’t pay taxes at all.

Not including FICA which is 7.6% of income from dollar one, with a cap at something like $105,000. Including FICA it could be something like 30% paid by lower income earners.

In short, during the 2000s, top earners took home a smaller share of the income pie but paid a larger share of the taxes. Is that what Obama means by “fairness?”

Does leaving out FICA count as fairness?

As for the so-called Buffett Rule that Obama wants, it would impose a minimum tax of 30% on millionaires to make them pay their “fair share.” It’s premised on investor Warren Buffett’s assertion that he pays a lower tax rate than his secretary.

Nonsense. Those with incomes over $1 million pay about 30% in taxes on average, about twice the average for those with middle incomes, like Buffett’s assistant.

Not counting FICA.

Simply put, this is class warfare. The tax would only raise $47 billion over the next decade — a drop in the bucket compared to the $45 trillion in spending and $9.6 trillion in deficits under Obama’s budget.

And just under $1 trillion per year of FICA taxes

Unfortunately, by raising the capital gains tax from 15% to over 30%, it would kill millions of American jobs and send small business creation into a tailspin.

Any tax hike can reduce aggregate demand. And not having income taxes and cap gains at the same rate merely causes income to shift to the lowest taxed category, and provide massive fees for the accounting firms and financial sector as well.

Who would that help?

“We tried (free market economics) for eight years before I took office. … We were told the same thing we’re being told now — this is going to lead to faster job growth, it’s going to lead to greater prosperity for everybody. Guess what? It didn’t.”

Obama has repeatedly suggested all the economy’s problems are due to President Bush.

But Bush, like Obama, entered office during a recession. Not only did he take over after the biggest stock market crash since the Depression, but the Fed had more than doubled interest rates, killing growth.

The Fed doubled rates from very low levels after the economy started growing from the combo Bush proactively expanding the deficit and from the up leg of the sub prime adventure. It ended with the shrinking of the deficit and the down leg of the sub prime adventure.

Worse, within eight months of entering office, the U.S. was hit with the 9/11 terrorist attacks — the first on the American homeland since World War II. Within the space of just 90 days, a million jobs were lost.

Jobs were lost because private sector credit expansion ended after being stretched past it’s limits during the late 90’s, with the govt budget surplus draining off hundreds of billions of dollars of net financial assets as well.

Obama’s right. President Bush did cut tax rates. What was the result? We had 52 straight months of job growth, with 8 million new jobs over six years.

Propelled by the larger deficit and the expansion phase of the sub prime adventure.

For Bush’s entire presidency, the unemployment rate averaged 5.3%. Under Obama, it’s not been below 8%.

Yes, because the deficit is too small, and both sides want to make it smaller. Good luck to us…

Real after-tax income per person rose more than 11% under Bush, while real GDP from 2000 to 2007 grew $2.1 trillion, or 17%. In 2007, the deficit fell to $162 billion — roughly 1% of GDP.

Yes, not large enough to support aggregate demand after support from the sub prime expansion phase ended.

Does Obama really want to compare himself to that? Since he’s entered office, we’ve lost 1.7 million jobs, and unemployment has averaged over 8%.

His deficits have averaged $1.4 trillion — about 8% of GDP, a record. On his watch, debt has soared from $10.7 trillion to $16 trillion. America now has more debt than the entire euro zone and Great Britain — combined.

And still not nearly enough to restore aggregate demand.

Under Obama spending has surged. The federal government now accounts for 25% of the economy, vs. the long-term average of 20%.

Due mainly to automatic counter cyclical transfer payments, not expanded regular spending.

Through his big-government policies, Obama took a bad recession and made sure our recovery would be the worst ever — and then blamed it on everyone but himself.

Meanwhile, get ready for “taxmageddon” — the $494 billion tax hike that hits in 2013 as the Bush tax cuts expire, something Obama is doing nothing about.

Wasn’t it the opposition trying to not allow the extension this year?

Our economy, in short, will never regain its old vitality until a new president is elected, and Obama’s top-down, government-centered policies are laid to rest.

I’ve been a harsh critic of Obama’s policies all along, but this is all a pile of intellectually dishonest propaganda.

Global themes

  • Austerity everywhere keeps domestic demand in check and export channels muted
  • Non govt credit expansion pretty much stone cold dead in the US and Europe
  • Rising oil energy prices subduing global aggregate demand
  • US federal deficit just about enough to muddle through with modest GDP growth
  • Rest of world public deficits also insufficient to close output gaps, including China which has calmed down considerably
  • Zero rate policies/QE/etc. in the US, Japan, and Europe doing their thing to keep aggregate demand down and inflation low as monetary authorities continue to get that causation backwards
  • All good for stocks and shareholders, not good for most people trying to work for a living
  • Europe still in slow motion train wreck mode, with psi bond tax risk keeping investors at bay and ECB waiting for things to get bad enough before intervening

So still looking to me like a case of

‘Because we fear becoming the next Greece, we continue to turn ourselves into the next Japan’

The only way out at this point is a private sector credit expansion, which, in the US, traditionally comes from housing, but doesn’t seem to be happening this time. Past cycles have seen it come from the sub prime expansion phase, the .com/y2k boom, the S&L expansion phase, and the emerging market lending boom.

But this time we’re being more careful of ‘bubbles’ (just like Japan has done for the last two decades). So I don’t see much hope there.

Still watching for the euro bond tax idea to surface, which I see as the immediate possibility of systemic risk, but no real sign yet.

EUR PMIs-Big GDP Implications

And not only no change in fiscal policy, but more of same. As the carpenter said about his piece of wood, ‘no matter how much I cut off it’s still too short.’

Fertile ground for the ‘bond tax’ (PSI) for the next round of austerity, to reduce the need to further cut public services and raise domestic taxes.


Karim writes:

As mentioned before, PMI surveys in Europe are the most timely and important economic data point for the ECB; they have the greatest weight in the ECB’s model of estimating current quarter and quarter ahead growth.

Today’s data was weaker across the board, with Germany surprisingly weak in particular.

  • Euro composite PMI fell for the second month in a row, from 49.3 to 48.7
  • Weakness was led by manufacturing, down from 49 to 47.7
  • German manufacturing was especially weak, falling from 50.2 to 48.1
  • French PMI slipped back below 50, from 50.2 to 49

The impact on GDP according to NowCasting (which uses a similar framework as the ECB) was a downward revision to Q2 real GDP growth from +0.6% (annualized) to -0.6% (annualized) for the EuroZone, and from 0.1% (annualized) to -1.2% (annualized) for Germany.

This data should certainly push up the probability of an ECB policy rate cut in May or June.

output gap still wide…

Willing To Work, Not Looking

By Sean Higgens

(Investor’s Business Daily)

A Record 2.81 Million Including this group, jobless rate is 9.9% vs. the official 8.3% figure

The official unemployment rate has improved, but the number of jobless Americans at the fringe of the workforce has never been greater. The gap between headline and alternative joblessness is the highest on record, according to an IBD analysis of Labor Department data.

The jobless rate is 8.3%, still high but down from 9.1% last August and 9.9% in April 2010. But many don’t think that gives an accurate picture. The official number excludes a record 2.81 million discouraged or other “marginally attached” people out of work that aren’t currently looking but are willing and able.

Factoring these people in, unemployment is a much higher 9.9%, 1.6 percentage points above the official rate. That’s the widest gap on record going back to 1994. It never rose above 1.1 points during the Bush administration.

That means the official rate has been falling in part because an unprecedented number of people are taking a break from searching for work.

“The labor market has weakened so much you’ve just had more and more people falling into that group,” said Heidi Shierholz, labor market economist with the liberal Economic Policy Institute.

Some lawmakers say it is time that the government started paying more attention to them.

Rep. Duncan Hunter, R-Calif., plans to introduce a bill soon that would force the Labor Department to include the marginally attached in the official number.

“Guys like me want a way to know what the unemployment rate really is. It is that simple. The unemployment rate is not really the 8.3% figure,” Hunter, a member of the Education and Workforce Committee, told IBD.

Labor already tracks at least half a dozen variations in the jobless rate publicly released each month.

‘Marginal’ Workers Left Out

The official rate is called the “U-3” number. The one including the marginally attached is the “U-5.” That one also includes: “discouraged workers, plus all other persons marginally attached to the labor force.”

The “marginally attached” are defined as those that want to work and have sought employment within the prior year but are not currently looking.

Hunter’s bill would just make U-5 the official number. “I don’t think most people even know there is an alternate way of calculating unemployment,” he said.

Economists of all stripes agree that it is arbitrary for U-3 to be the official rate. A sound case could be made for any of the others, though most argued that no one figure should be spotlighted.

GOP lawmakers may have political motives to cast President Obama’s economic record in the worst possible light.

But Wayne Vroman, senior fellow at the Urban Institute, notes that the idea of changing the statistic to the U-5 number has a bipartisan pedigree.

“A lot of advocates from the left side of the political spectrum also would want to give (the higher statistic) more prominence because it shows distress among a group that doesn’t get as much attention,” Vroman said.

Surprisingly little is known about the marginally attached. With less than two decades of data, few economists can say much except that the group is very diverse, with many reasons as to why they drop out. Some may have other means or a working spouse, or are retiring early.

Many have quit looking after months or years out of work. Average duration of unemployment was 40.1 weeks in January, just below November’s record 40.9 weeks.

The labor force participation rate has fallen to multi-decade lows even as hiring has slowly improved in recent months.

That may reflect baby-boomer retirements in part, says James Sherk, a labor economist with the conservative Heritage Foundation. But even taking that into account, “the labor force participation rate has fallen even more than you would expect.”

oil