Chicago Fed, existing home sales

Still negative:

Chicago Fed National Activity Index
er-1-22-1
Highlights
December was a weak month for the U.S. economy but a little less weak than November, based on the national activity index which improved to minus 0.22 from minus 0.36 (revised lower from minus 0.30). The improvement is centered in the production component as contraction in industrial production eased to minus 0.4 percent from November’s very deep minus 0.9 percent. Other components were steady with sales/orders/inventories and consumption & housing both slightly negative. The only component in positive ground is employment, unchanged in the month at a solid plus 0.12. Despite the improvement in December, the 3-month average fell to minus 0.24 from minus 0.19 in November. This report is a reminder that economic activity is subdued which is a major factor, aside from low oil and commodity prices, holding down inflation.

Up more than expected, but from the chart you can see the average of the last two volatile months is still down a bit vs prior months:
er-1-22-2

Fed comment, Retail sales, Empire State Manufacturing, Industrial production, Business inventories, Consumer sentiment

Looks like the Fed hiked during a recession.

Should make for interesting Congressional testimony…

Maybe the hundreds of $ millions they spend on economic research isn’t enough???
;)

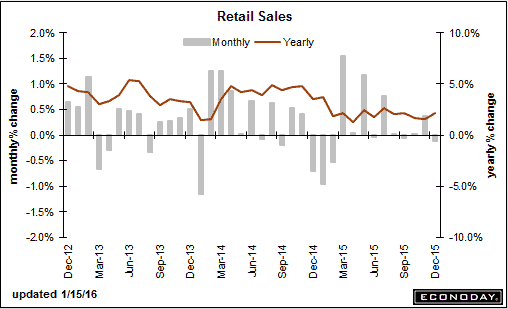
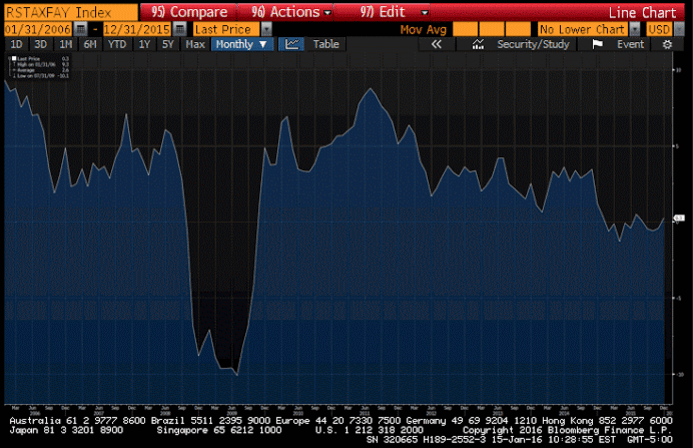
Sales remain at recession levels:

Retail Sales
er-1-15-2-1
Highlights
Retail sales proved disappointing in December, down 0.1 percent in a headline that is not skewed by vehicles or even that much by gasoline. Ex-auto sales also fell 0.1 percent while the core ex-auto ex-gas reading came in unchanged which is well below both expectations as well as low-end expectations. The Beige Book yesterday warned us about weak apparel sales which in this report fell a very steep 0.9 percent, in a decline that likely reflects more than just import-price contraction. The general merchandise category, which is very large, fell 1.0 percent in the month. Electronics & appliances also show contraction.

December winds up what was a not-so-great year for the nation’s retailers. Total sales rose only 2.1 percent in the year, the smallest gain since 2009 and well down from 3.9 percent in 2014. Excluding motor vehicles, sales rose 0.9 percent, far lower than 2014’s 3.1 percent.

There are, however, some positives in the report including another strong gain for restaurants, up 0.8 percent, and also another gain for furniture & home furnishings, up 0.9 percent in strength that confirms ongoing improvement in the housing sector. But sales at non-store retailers rose only 0.3 percent for a second straight month which are moderate gains that do not confirm anecdotal reports of unusual holiday strength for online shopping.

Upward revisions do take some of the sting out of the December report but not much. November total sales are revised 2 tenths higher to plus 0.4 percent and reflects a sharp upward revision to vehicle sales to plus 0.5 percent. But vehicle sales couldn’t muster any strength in December, coming in unchanged. And sales at gasoline stations extended their long run of contraction that reflects falling oil prices, down 1.1 percent in December.

There’s plenty of jobs for consumers and gas prices are low — but so are wages. The consumer started to slow down at year end and that was before the new trouble in China. Today’s data will pull down expectations for fourth-quarter growth.
er-1-15-2-2

Retail Sales ‘control group’ (retail sales excluding food, auto dealers, building materials, and gas stations)
er-1-15-2-3
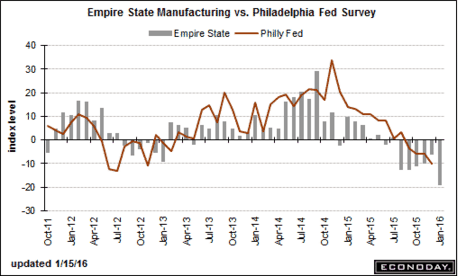
More recession evidence, and maybe worse…

Empire State Mfg Survey
er-1-15-2-4
Highlights
The contraction in factory activity in the New York manufacturing region, which began way back in August, unfortunately is picking up a lot of steam this month, at minus 19.37 for the January headline which is the lowest reading since April 2009. New orders, at minus 23.54, are contracting for an eighth straight month and at the sharpest pace since March 2009. Unfilled orders, at minus 11.00, are in an even deeper string of contraction. Employment, at minus 13.00, is down for a sixth straight month as is the workweek, at minus 6.00. And there’s a crumbling going on in the 6-month outlook which, at 9.51 is still in the positive column but shows the least optimism since way back in March 2009. This report is grim and offers an initial look at January’s factory activity which, based on these results, appears to be getting hit by global concerns.
er-1-15-2-5

More recession evidence, or worse…

Industrial Production
er-1-15-2-6
Highlights
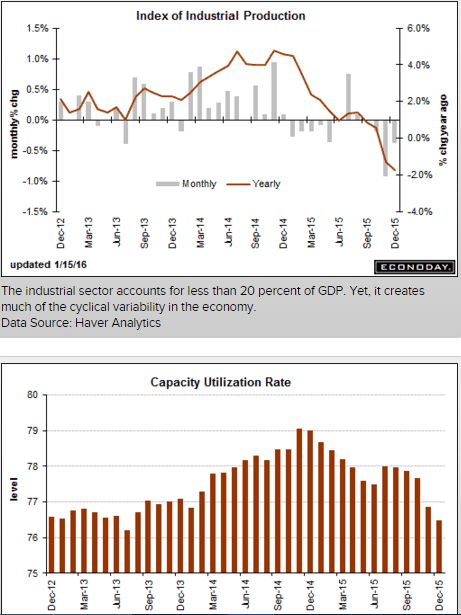
December was not a good month for the industrial economy as industrial production fell a sharper-than-expected 0.4 percent. Utility output, down 2.0 percent, declined for a third straight month reflecting unseasonably warm temperatures. Mining, reflecting low commodity prices and contraction in energy extraction, has also been week, down 0.8 percent for a fourth straight decline. Turning to manufacturing, which is the most important component in this report, production fell 0.1 percent for a second straight month (November revised downward from an initial no-change reading).

Details on manufacturing include a second straight contraction for vehicles, down 1.7 percent following November’s 1.5 percent decline. Weakness here, along with weakness in the motor vehicle component of this morning’s retail sales report, will raise talk that the auto sector, which had been one of the highlights of the 2015 economy, may slow down in 2016, at least the early part of the year. Construction supplies are a positive, up 0.6 percent for the second strong showing in three months and confirming strength underway in data for construction spending.

Capacity utilization fell 4 tenths from a downwardly revised November to 76.5 percent. A low utilization rate, which is running roughly 4 percentage points below its long-term average, holds down the cost of goods.

Year-on-year rates confirm weakness, down 1.8 percent overall with utilities down 6.9 percent and mining down 11.2 percent. Manufacturing is in the plus column but it’s nothing spectacular, at plus 0.8 percent.

Making matters worse is a downward revision to November, now at minus 0.9 percent vs an initial decline of 0.6 percent. Looking at the annualized rate for the fourth quarter, industrial production fell 3.4 percent though manufacturing did increase but not much, up 0.5 percent. Weather factors are skewing utility output but otherwise, readings are fundamentally soft and reflect the downturn in global demand made more severe for U.S. producers by strength in the dollar.
er-1-15-2-7

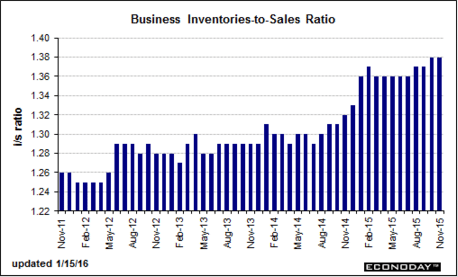
Inventories down some but sales down same so relative to sales inventories remain way high, another recession indication:

Business Inventories
er-1-15-2-8
Highlights
Inventories are contracting, the result of defensive draws in the wholesale and manufacturing sectors. Business inventories fell 0.2 percent in November following a decline in October of 0.1 percent. Wholesale inventories fell 0.3 percent for a second straight month with manufacturing down 0.3 percent following October’s 0.2 percent draw. Retail, up 0.2 and 0.1 percent in November and October, was the only sector adding inventories and today’s weak results for December retail sales may point to an unwanted build for December.

Relative to sales, which also fell 0.2 percent and were down 0.3 percent in October, total inventories are stable, at a ratio of 1.38. This report is indicative of economic weakness and will not be building expectations for fourth-quarter growth let alone the outlook for first-quarter growth.
er-1-15-2-9

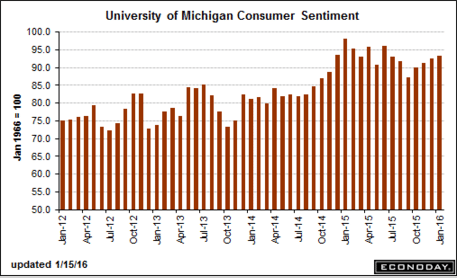
This was up a tad so they have something to report on the news. But even here the current conditions took a dive. And, as previously discussed, this is one man one vote, not one dollar one vote, and total spending has been decelerating:

Consumer Sentiment
er-1-15-2-10
Highlights
The first indication of the China effect on U.S. consumers looks positive but ultimately is mixed. January’s flash consumer sentiment index did rise 7 tenths from final December to 93.3 but current conditions, the component that picks up the immediate impact of special factors, fell 3.0 points to 105.1. Should volatility in markets begin to ease and confidence in China improve, this reading could pop back as quickly as month end.

Lifting the mid-month index is a rise in the expectations component, up 3.0 points 85.7. Behind this gain is strength in the jobs market and perhaps even falling oil prices as 1-year inflation expectations are down a sizable 2 tenths to 2.4 percent. This is offset in part by a 1 tenth rise in 5-year expectations to 2.7 percent.

The resilience in long-term optimism is a plus for the U.S. economy though the eroding in short-term inflation expectations will not be encouraging to Federal Reserve policy makers who have launched a rate-hike sequence for an economy still struggling against deflation. The Dow is moving off opening lows in early reaction to this report.
er-1-15-2-11

ECB, Fed, Rail traffic

Looks like they are again making hawkish noises, taking the lead of the Fed:

ECB wary of further action despite uncertain future

By: Balazs Koranyi and John O’Donnell

Jan 14 (Reuters)

* Many governors sceptical of need for further action in near term
* Governors urge countries to act instead with reform
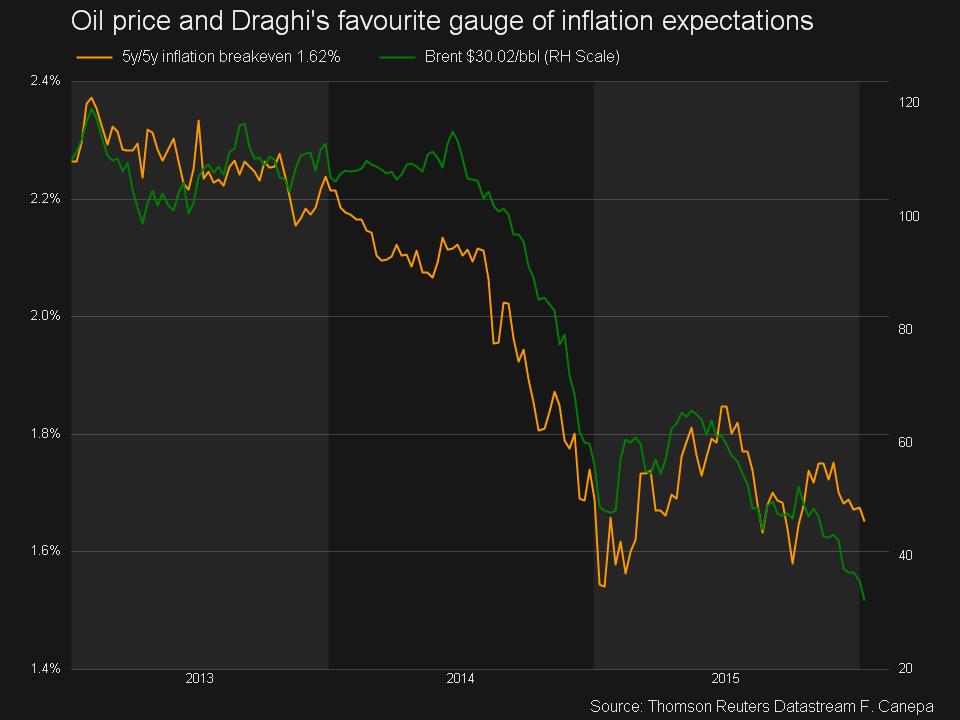
* Oil price and inflation expectations:
er-1-14-1
Many European Central Bank policy makers are sceptical about the need for further policy action in the near term, conversations with five of them indicate, even as inflation expectations sink and some investors bank on more easing.

Next week’s rate meeting is expected to be relatively uneventful with the big test coming when the ECB releases its initial 2018 growth and inflation forecasts on March 10.

But apparently recent market action has got the Fed thinking twice about it’s hiking intentions:

China may slow Fed’s interest rate rises: Fed officials

Jan 13 (Reuters) — The rout in China’s stock market, weak oil prices and other factors are “furthering the concern that global growth has slowed significantly,” Boston Fed President Eric Rosengren said. Rosengren also said a second hike will face a strict test as the Fed looks for tangible evidence that U.S. growth will be “at or above potential” and inflation is moving back up toward the Fed’s 2 percent target. “It’s something that’s got to make you nervous,” Chicago Fed chief Charles Evans said of the drag slower growth in China could have on economies like the United States that don’t do much direct trade. Evans also said he was nervous about inflation expectations not being as firmly anchored as a year ago, and added it could be midyear before the Fed has a good picture of the inflation outlook.

Confirming the rail traffic indicators:

CSX fourth quarter profit falls on lower freight volumes

Jan 13 (Bloomberg) — CSX said freight volumes fell 6 percent in the fourth quarter, with a huge 32 percent decline in the amount of coal hauled. Fourth-quarter net income was $466 million or 48 cents per share, down 5 percent from $491 million or 49 cents per share a year earlier. Revenue in the quarter was $2.78 billion, down nearly 13 percent from $3.19 billion a year earlier. “We have not seen these kind of pressures in so many different markets because you have multiple aspects working against you: Low gas prices, low commodity prices, strength of the dollar,” CEO Michael Ward said on the call. Except auto, housing, “you are seeing pressure on most of the markets.”

Spending and tax bill, Chicago Fed, CRE lending

800 billion over 10 years is something, but not enough to turn things around as it’s maybe .25% of GDP per year or so.

Historically it’s taken a good 5% of GDP deficit to reverse a decline, which today means close to a 1T deficit annually.

And interesting how they just jumped all over Trump for his tax plan that they claimed would add 1T to the debt over 10 years…

Massive Spending and Tax Package Leaves Deficit Fears Behind

Congress passed far-reaching legislation Friday to fund the government through September and to extend tax breaks for business and low-income families. They passed a $1.15 trillion government spending bill and approved a multiyear highway funding package. They also ended a Medicare funding cliff and agreed to make permanent tax credits, steps that add more than $800 billion to deficits over the coming decade. The spending bill, which also lifted a 40-year ban on oil exports, won the support of 166 House Democrats and 150 Republicans, a majority of the House GOP.

Another bad one:

Chicago Fed National Activity Index
er-12-21-1
Highlights
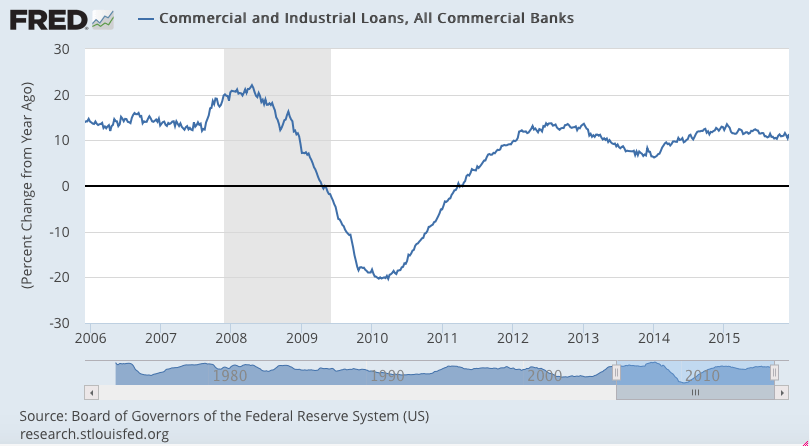
Subdued inflation pressure over the coming year is the conclusion of the monthly national activity report where the index came in at minus 0.30 in November, below a downward revised minus 0.17 in October and below the low-end Econoday forecast. The negative reading is consistent with below average economic growth, in a reminder that the Fed is raising rates at a time when the economy is far from booming. The 3-month average is at minus 0.20, only marginally improved from October’s revised minus 0.25.

Weakness in exports is a key negative right now for the economy, underscored in a very sharp decrease for the production component to minus 0.27 from minus 0.11. Much of this decline, however, likely reflects the weather-related slowdown in utility output. The consumption & housing component pulled down the index by minus 0.06 points, which however is improved from October’s minus 0.11, while sales/orders/inventories came in little changed at minus 0.02. The only one in the positive zone is employment though this component did slow to plus 0.05 from 0.08.

This doesn’t help GDP growth:

U.S. Banking Regulators Step Up Rhetoric on Commercial Real-Estate Loans

“The agencies have observed substantial growth in many CRE asset and lending markets, increased competitive pressures, rising CRE concentrations in banks, and an easing of CRE underwriting standards,” said the Federal Reserve, Federal Deposit Insurance Corp. and the Office of the Comptroller of the Currency. They vowed to “continue to pay special attention to potential risks” in 2016, and said supervisors may ask for banks to raise more capital or take other actions to remedy risks that haven’t been addressed.

PMI services index, KC Fed

Much lower than expected from the service that tends to run much higher than the others.

Fed rate hike already working! ;)

PMI Services Flash
er-12-18-6
Highlights
The services PMI is slowing sharply this month, to 53.7 vs 56.1 for the final November reading and vs 56.5 for the flash reading. This is the lowest reading in a year reflecting the slowest growth in new orders since January and a fifth straight month of contraction in backlog orders. Optimism over future growth is understandably down, reflecting what the report says is a subdued global outlook, election uncertainty and softer demand in the energy sector. Price readings remain subdued with inputs at their weakest pace since February. Despite weakness in orders and the downcast outlook, hiring is described as “resilient”. Given weakness in global demand, the service economy is the nation’s bread and butter and today’s report, though only one data point, hints at slowing for the economy.

Bad! Fed rate hike already working here too! ;)

United States : Kansas City Fed Manufacturing Index
er-12-18-7
Highlights
Kansas City’s emergence above water didn’t last long, only one month in fact. The December index came in at minus 8 for the eighth contraction in nine months with only November’s modest plus 1 reading the exception. Production is in contraction as are both new orders and backlog orders with employment in severe contraction at minus 17. Price data are also in contraction. With oil prices continuing to move lower, the worst may not yet be over for the Kansas City economy.

From Calculated Risk:

According to Chad Wilkerson, vice president and economist at the Federal Reserve Bank of Kansas City, the survey revealed that Tenth District manufacturing activity declined moderately, although expectations for future activity remained solid.

“After two months of mostly steady activity, regional factories pulled back again in December,” said Wilkerson. “The weakest activity was in energy-concentrated states.”

Tenth District manufacturing activity declined moderately in December, reversing gains from the last several months, while producers’ expectations for future activity remained solid. Most price indexes continued to ease further.

The month-over-month composite index was -9 in December, down from 1 in November and -1 in October

The employment index dropped from -8 to -14, and the capital expenditures index posted its lowest level since August 2010. …

Future factory indexes were mixed, but remained at generally solid levels. The future composite index was basically unchanged at 7, while the future production, shipments, and new orders for exports indexes increased modestly.

Posted in Fed

Rate hike comment, Container traffic, Employment comment

So a Fed rate hike is nothing more than the federal government deciding to pay more interest on what’s called ‘the public debt’.

By immediately paying more interest on balances in reserve accounts at the Fed the cost of funds to the banking system is supported at that higher level, all of which influences the interest paid on securities accounts at the Fed as well, which influences the term structure of rates.

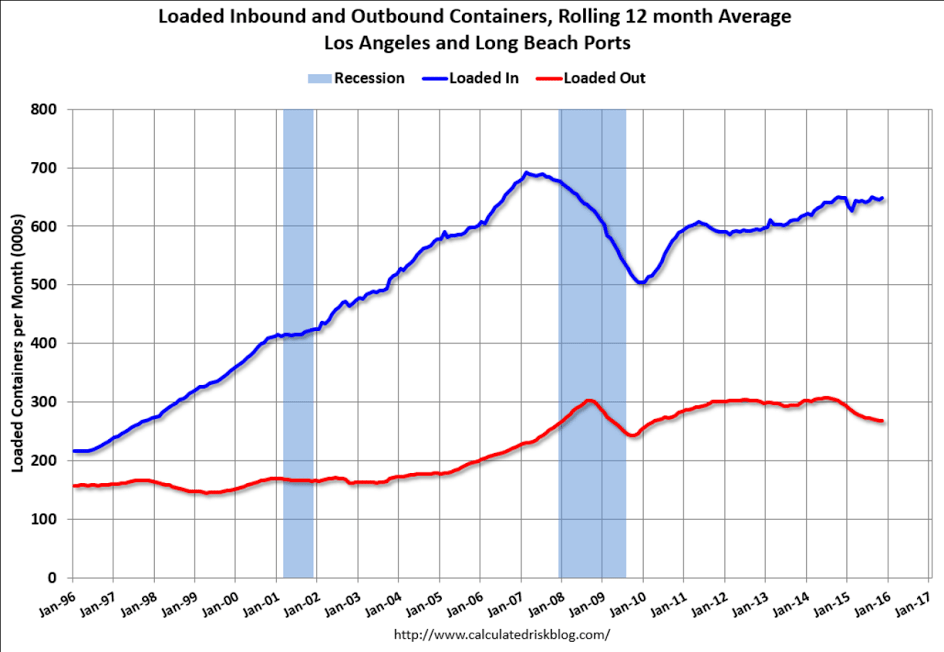
Imports up, exports down:
er-12-18-1
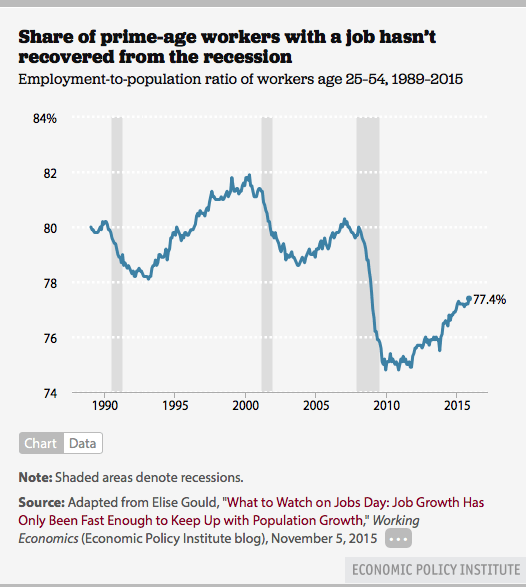
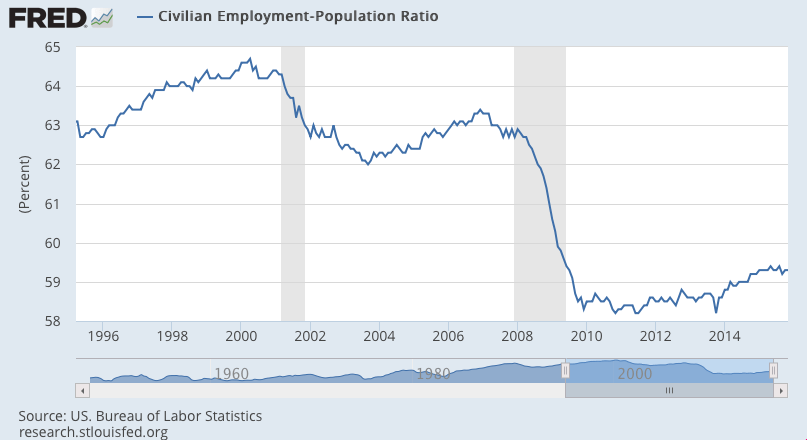
Seems to me there’s a substantial number of people who can ‘get by’ without a job, but would work if they could get a meaningful paycheck to allow them to, for example, remodel a room, or take a nicer vacation, etc. but won’t take a minimum wage job that doesn’t ‘move the needle’ in that respect. And they are not considered to be part of the labor force as defined, and therefore not unemployed. And this includes older people as well. However, as macro economic forces cause a certain amount of ‘desperation’ some do ‘trickle down’ to the lower paying jobs out of necessity, which accounts for quite a bit of the reported employment growth.

Comes back to the same thing- a whopping shortage of aggregate demand vs pre 2008 and pre 2001 levels, where people who can ‘get by’ were able to get good enough paying jobs to justify working:
er-12-18-2
er-12-18-3
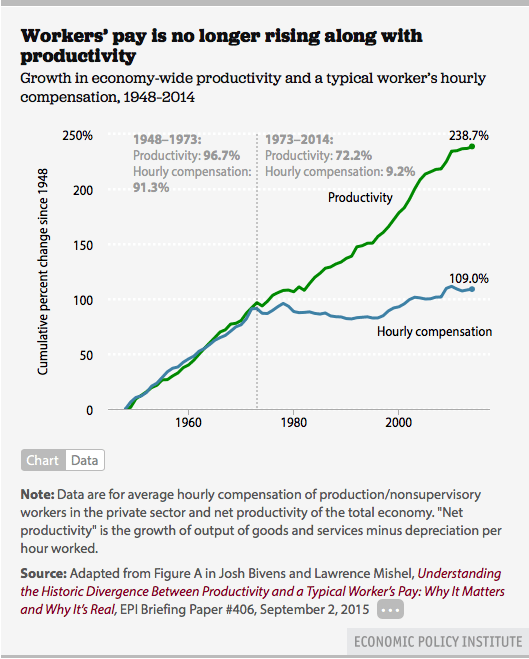
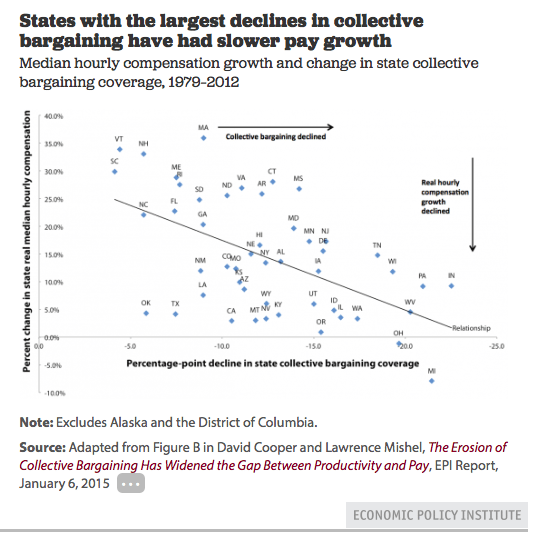
As previously discussed, mainstream game theory says the ‘labor market’ isn’t a ‘fair game’ as workers need to work to eat, and business hires only if it ‘wants to.’ The charts show what happened as support for labor was phased out:
er-12-18-4

er-12-18-5

Atlanta Fed, US current account, Philly Fed

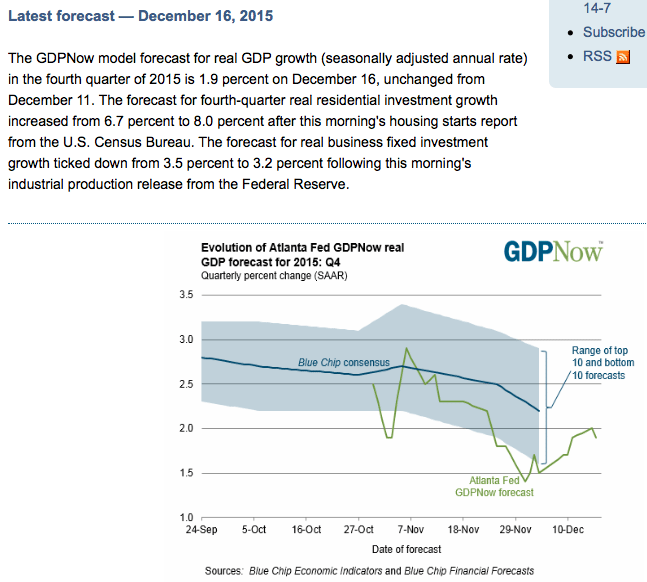
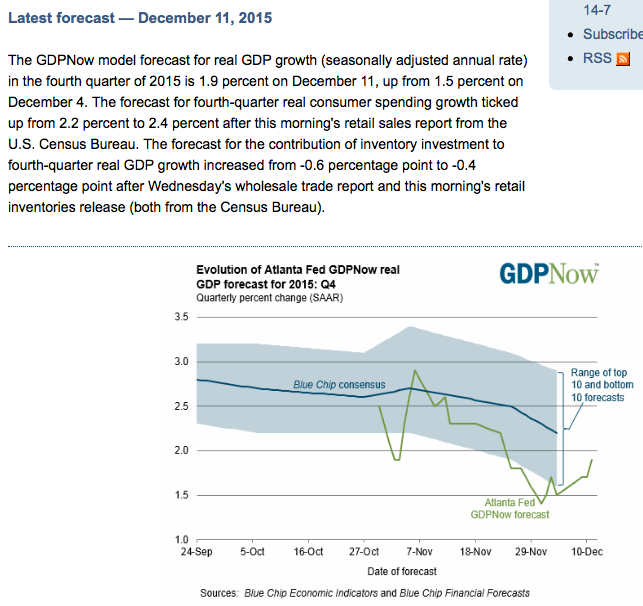
Blue chip consensus dropping quickly now, and today won’t help any:
er-12-17-5
Remember a year ago when they said the oil price drop would be an unambiguous positive for the trade balance?
;)

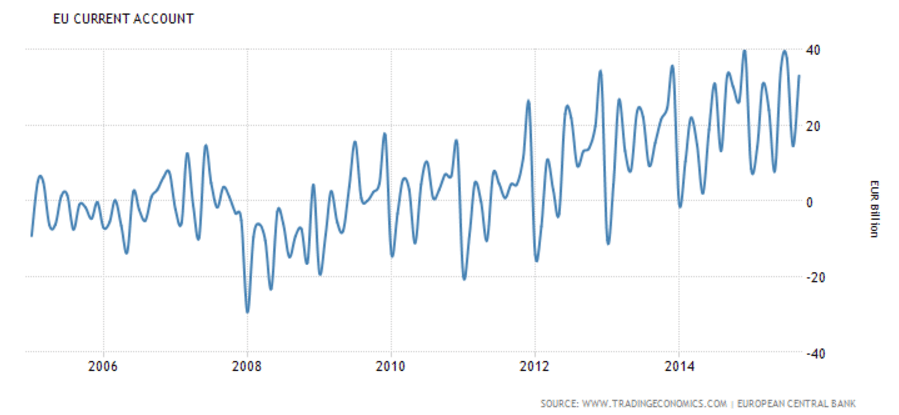
Anyway, this is weak dollar stuff, vs the euro area current account surplus, which is strong euro stuff:

Current Account
er-12-17-1
Highlights
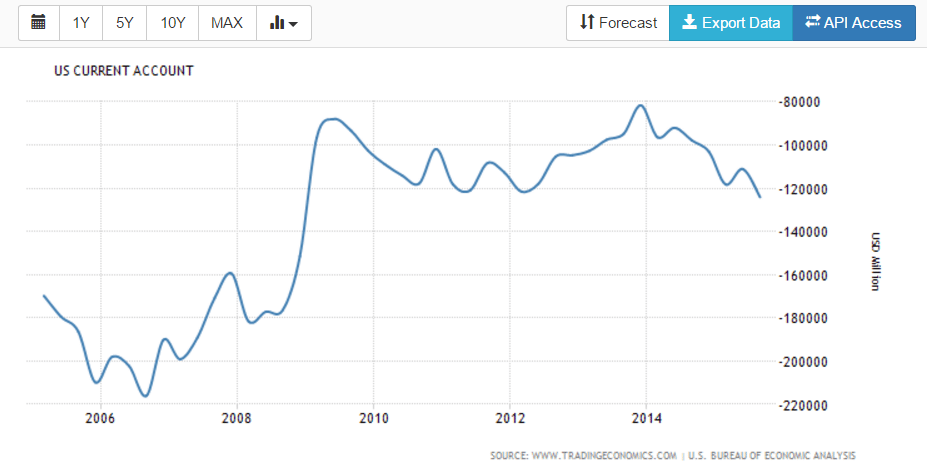
The nation’s current account deficit widened sharply in the third quarter, to $124.1 billion from a revised $111.1 billion in the second quarter. This is the widest gap of the recovery, since the troubles of fourth-quarter 2008. A greater deficit in goods trade, at $0.8 billion in the quarter, is the smallest factor in the widening. A narrowing in the surplus for primary income, at $6.6 billion, and a widening in the gap for secondary income, at $5.8 billion, are the main factors behind the quarter’s deficit. The gap relative to GDP rose 1 tenth in the third quarter to a still manageable 2.7 percent.

er-12-17-2
Bad. Fed rate hike already have an effect…
;)

Philadelphia Fed Business Outlook Survey
er-12-17-3
Highlights
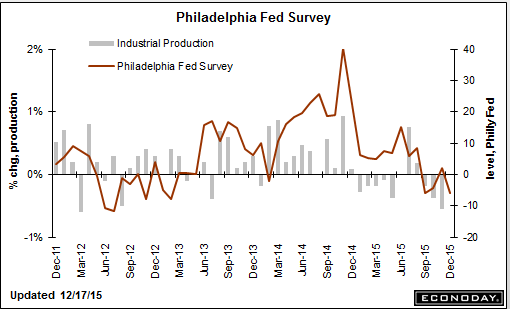
The negative headline, below Econoday’s low-end estimate, isn’t even half of story for the December Philly Fed report which is pointing to another rough month for the nation’s factory sector. The headline index came in at minus 5.9 for its third negative reading in four months. New orders have been in the negative column for the last three months, at a steep minus 9.5 in today’s report. Unfilled orders, which popped up slightly in November, are back in the minus column and deeply in the minus column at 17.7.
Manufacturers in the Philly Fed’s sample worked down their backlogs to keep up shipments which came in on the plus side at 3.7. But without new orders coming in, shipments are bound to fall. Employment, likewise, is bound to fall though it did hold in the plus column for a second month in a row at 4.1 in December. Ominously, price data are beginning to turn deeply negative, at minus 9.8 for inputs and minus 8.7 for final goods — the latter an indication of weakening demand.

Another ominous detail in the report is a breakdown in the 6-month outlook, down more than 20 points to 23.0 which is low for this reading. Expectations for future orders are especially weak. Today’s report falls in line with Tuesday’s Empire State report and are both reminders that weak global demand, together with the breakdown in the energy and commodity sectors, are pulling down the nation’s factory sector.

er-12-17-4

Mtg prch apps, Housing starts, Industrial production, Euro trade

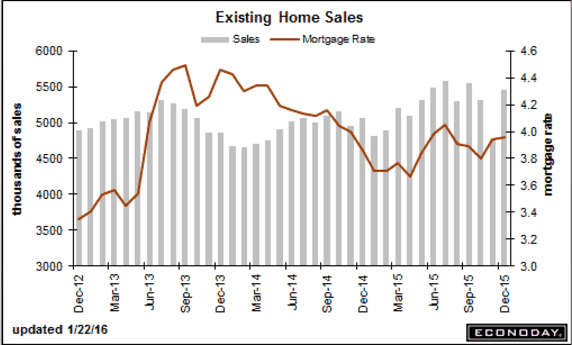
Yes, up vs last year’s dip, but remain depressed and have been
heading south since early this year:

MBA Mortgage Applications
er-12-16-12
Highlights
Application activity was little changed in the December 11 week, up 1 percent for refinancing and down 3.0 percent for home purchases. Year-on-year, purchase applications remain very high, up 34 percent in a gain that in part reflects a pulling forward of demand ahead of what is expected to be a rate hike at today’s FOMC. Rates were little changed in the week with the average 30-year fixed loan for conforming loan balances ($417,000 or less) unchanged at 4.14 percent. The rise in purchase applications points to strength for today’s housing starts and permits data.
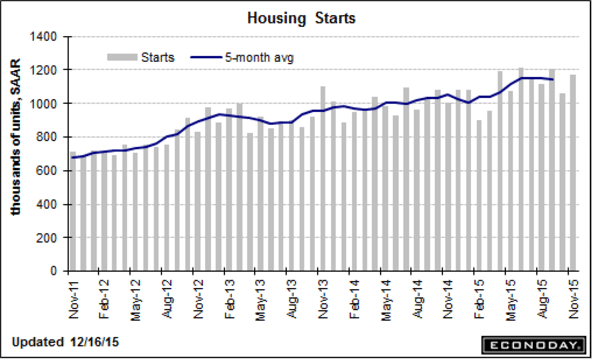
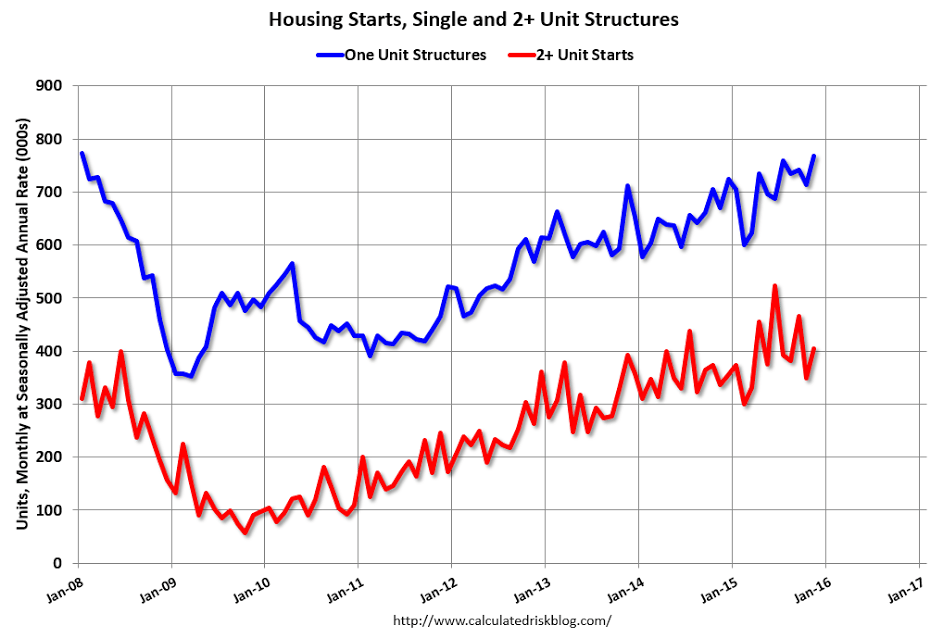
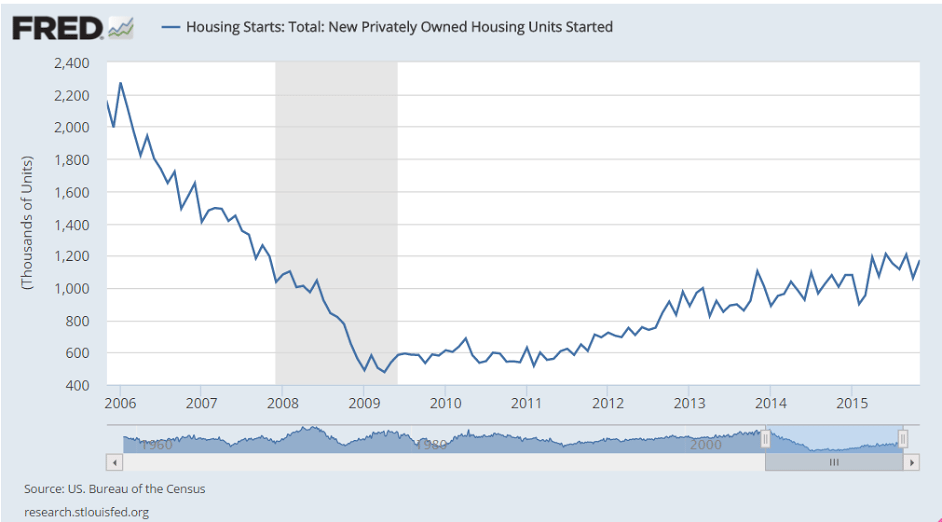
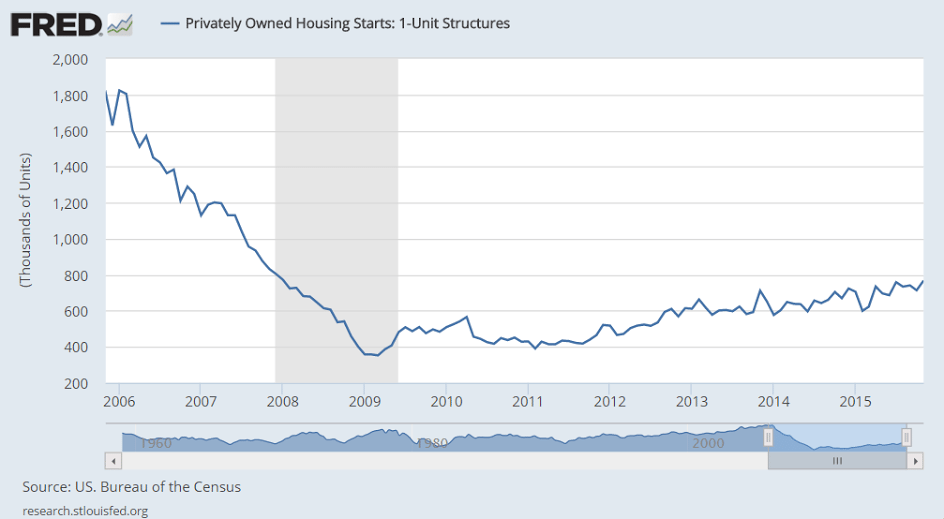
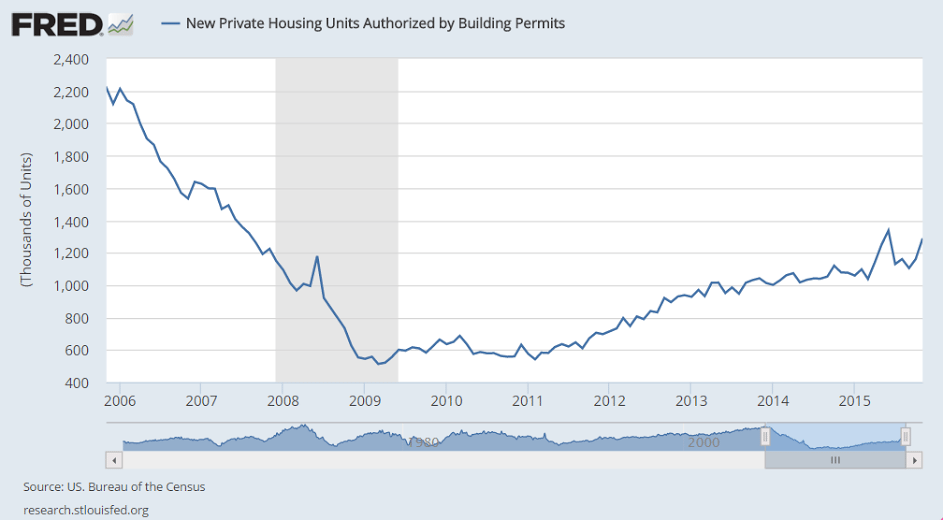
Up, which may give the Fed an excuse to hike rates, but remains severely depressed and gains again are in lower cost multifamily units, and even then the chart shows it’s all only been going sideways since February, with multifamily starts decelerating since the NY tax break expired in June:

Housing Starts
er-12-16-11

Highlights
Housing permits surged in November, up 11.0 percent to a far higher-than-expected annualized rate of 1.289 million and reflecting a 27 percent monthly jump for multi-family units though permits for single-family homes also increased, up 1.1 percent. Starts were also very strong, up 10.5 percent to a 1.173 million rate with multi-family homes again leading the way, up 16.4 percent with single-family homes up 7.6 percent.

Year-on-year rates are robust, up 19.5 percent for permits (single-family up 9.0 percent, multi-family up 36 percent) and up 16.5 percent for starts (single-family up 14.6 percent, multi-family up 20 percent).

Homes under construction offer more good news, up a monthly 2.2 percent to a recovery best rate of 965,000 and up a very strong 18.3 percent year-on-year. Housing completions fell back for a second month in November, down 3.2 percent to a 947,000 to indicate that there’s still plenty of building underway. Year-on-year, completions are up 9.2 percent.

Strength for starts is certainly getting a boost from this winter’s mild weather while the gain in permits points in part to speculative demand, especially for multi-family units. Housing readings have been inconsistent but this report is very constructive for the new home and construction outlooks.

er-12-16-10

er-12-16-9

er-12-16-8

er-12-16-7

er-12-16-6

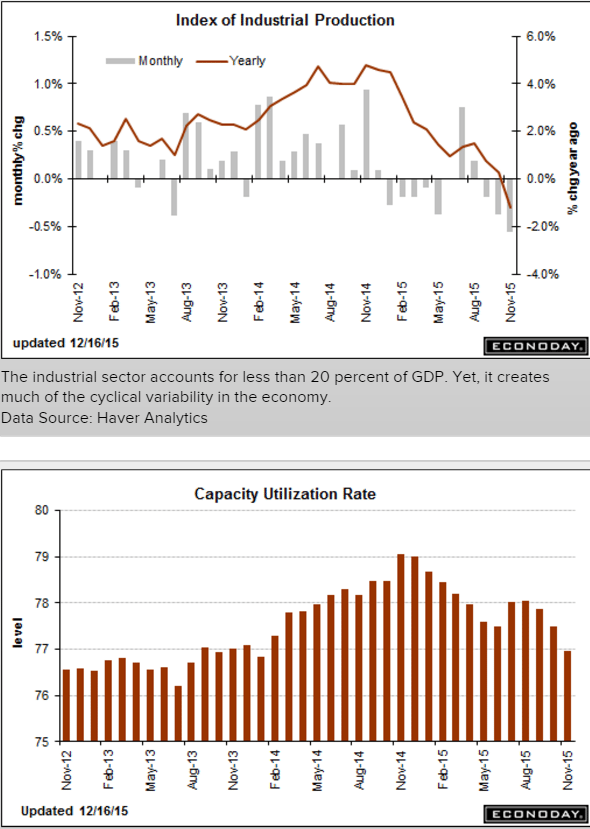
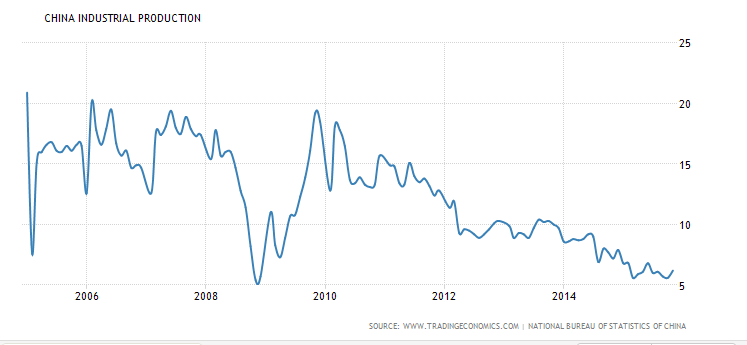
Yet another abysmal report from the industrial sector, which continues the tumble that began when oil capex collapsed about a year ago, and has yet to be ‘replaced’ by some other sector. And lost sales and output also means that much lost income in a downward spiral that can only be reversed by some sector ‘dipping into savings’ to spend that much more. And declining capacity utilization is one measure of slack for the Fed to consider:

Industrial Production
er-12-16-5
Highlights
November was another weak month for the industrial economy, in part reflecting unusually warm temperatures that are driving down utility output. Industrial production came in at the Econoday low forecast, down a very sharp 0.6 percent in November. This is the biggest drop in 3-1/2 years. Utility output fell a monthly 4.3 percent after falling 2.8 percent in October. Mining, reflecting low commodity prices and contraction in energy extraction, has also been week, down 1.1 percent for a third straight decline.

This brings us to the most important component, manufacturing where October’s 0.3 percent bounce higher (revised downward from 0.4 percent) now unfortunately looks like an outlier. Manufacturing production came in unchanged in November reflecting weakness in motor vehicles, down 1.0 percent in the month, and also a dip back for construction supplies which fell 0.2 percent after a weather-related surge of 2.3 percent in October. One positive is a slight snapback for business equipment which, after declines in the two prior months, rose 0.2 percent.

All the weakness is pulling down capacity utilization, to 77.0 percent in November for a heavy 5 tenths dip. Utilization is running more than 3 percentage points below its long-term average. Mining utilization is now under 80 percent, down 1.1 points in the month to 79.4 percent. Utility utilization fell 3.4 points in the month to 74.5 percent with manufacturing utilization down 1 tenth to 76.2 percent. Excess capacity, though not cited as a major factor behind the lack of inflation in the economy, does hold down the cost of goods.

Year-on-year rates confirm the weakness, down 1.2 percent overall with utilities down 7.6 percent and mining down 8.2 percent. Manufacturing is in the plus column but not by much at plus 0.9 percent.

Weather factors are skewing utility output but otherwise, readings are fundamentally soft and reflect the downturn in global demand made more severe for U.S. producers by strength in the dollar.

er-12-16-4
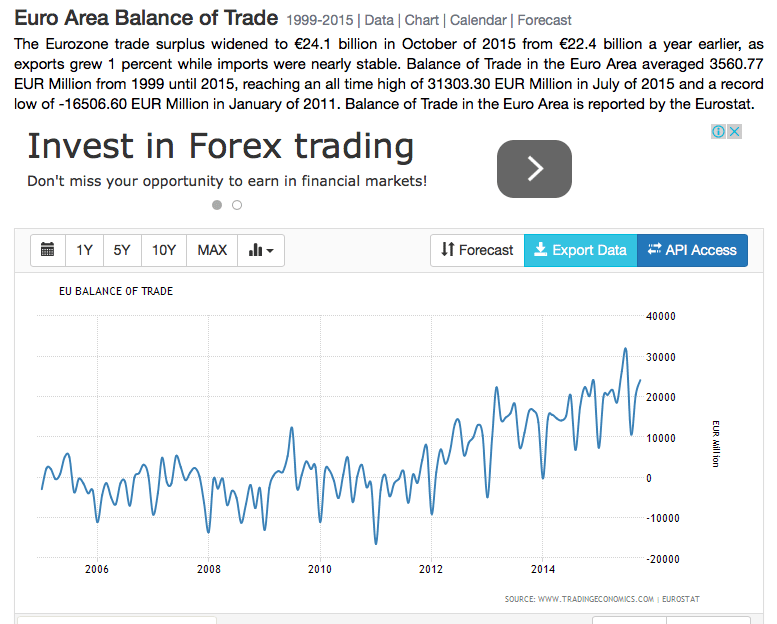
Euro area surplus high and continues to trend higher.

This is super strong currency stuff:
er-12-16-3
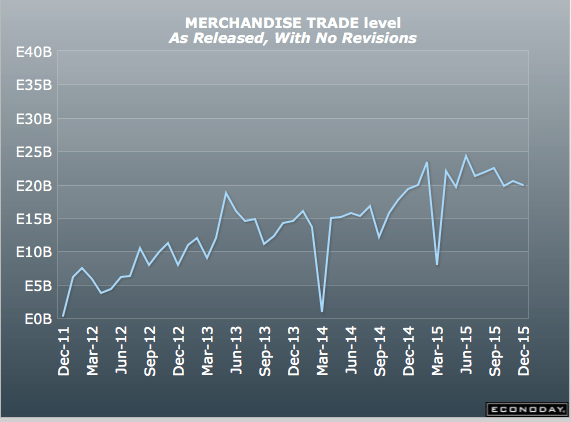
Different aggregate than the above, same message. And note exports growing with a weak global economy:

European Union : Merchandise Trade
er-12-16-2
Highlights
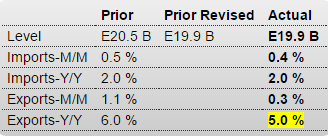
The seasonally adjusted trade balance returned a E19.9 billion surplus in October, matching the downwardly revised outturn in September.

The stability of the headline reflected a 0.3 percent monthly increase in exports and a 0.4 percent gain in imports. Exports stood at their highest level since July and were 5.0 percent above their year-ago level. Imports also recorded a 3-month peak and now show a yearly increase of 2.0 percent.

The October black ink was 3.1 percent below the average level in the third quarter when net exports subtracted 0.2 percentage points from quarterly GDP growth. Lower oil prices are helping to bias down nominal imports but the weakness of the euro should help to ensure a stronger performance from the real external trade sector moving through 2016.

er-12-16-1

Labor market conditions index, Euro and yen charts, Fed discussion

This is the Fed’s own index and it’s on the very weak side:

Labor Market Conditions Index
er-12-7-1
Highlights
Friday’s employment report, led by a 211,000 rise in non-farm payrolls, was solid but didn’t give the labor market conditions index much of a boost, coming in at only plus 0.5 vs expectations for plus 1.7. The October index, however, was revised 6 tenths higher to plus 2.2 reflecting in part the upward revision to that month’s nonfarm payroll growth which now stands at a very impressive 298,000. After dipping in the spring, this indicator, despite November’s soft outcome, is now on a seven-month winning streak.

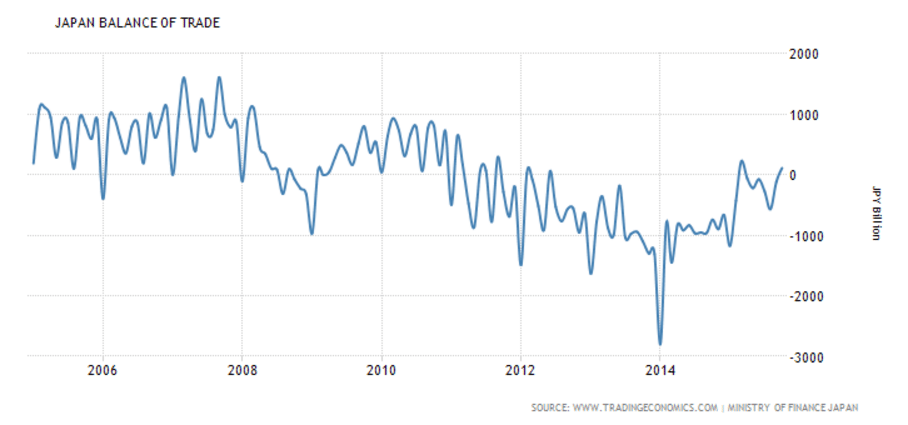
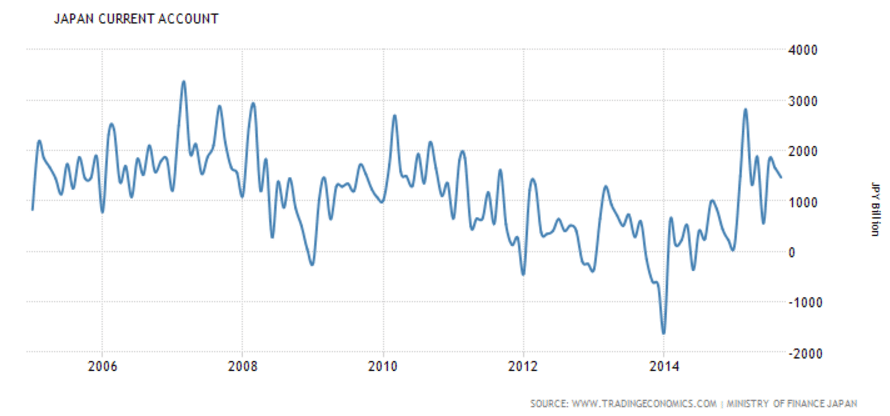
Do you really want to bet against a currency with this kind of trade balance (surplus) and teetering on deflation? Looking like the yen fundamentals used to look when it was the strongest currency in the world, before the tsunami closed the nukes and the surplus turned to deficit? ;)
er-12-7-2
er-12-7-3
er-12-7-4

er-12-7-5
Fed comment:

The Fed uses models that use oil futures as indicators of the future price of oil, so they are currently forecasting a rise in oil prices and therefore a rise in inflation,vwhich feeds into their decision regarding interest rate policy.

Unfortunately, the FOMC doesn’t seem to understand the difference between the analysis of perishable vs non perishable commodities, and therefore they don’t recognize the higher oil futures prices express the cost of storage, rather than an indicator of future spot prices.