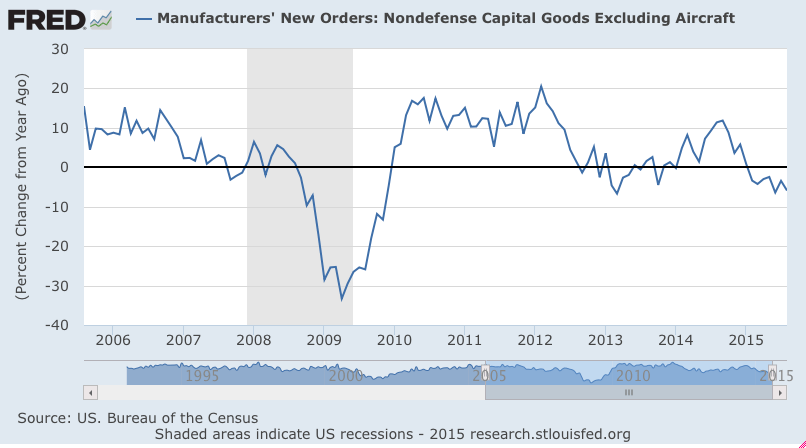
More evidence the capital spending contraction is not over:
CEO Confidence Goes From Bad to Worse
Dec 1 (Fox Business) — CEO confidence in the U.S. economy is dwindling. The Business Roundtable CEO Economic Outlook Index for the 4Q, which looks out six months, fell to the lowest level in three years
For third consecutive quarter, U.S. CEOs cautious on economy
Dec 1 (Reuters) — The Business Roundtable CEO Economic Outlook Index fell 6.6 points to 67.5 in the fourth quarter. The long-term average for the index is 80.1 points. Of the 140 CEOs surveyed, 60 percent said they expected sales to increase over the next six months, down from 63 percent during the previous quarter. The proportion of CEOs who said they expected their capital spending to decrease over the next six months rose to 27 percent from 20 percent in the third quarter. CEOs said that regulation was the top cost pressure facing their business, followed by labor and health care costs.
For the first six months of 2016, CEO expectations for sales decreased by 3.2 points and their plans for capital expenditures decreased by 16.7 points. Hiring plans were essentially unchanged from last quarter when they declined by nearly 8 points.
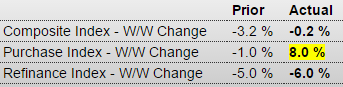
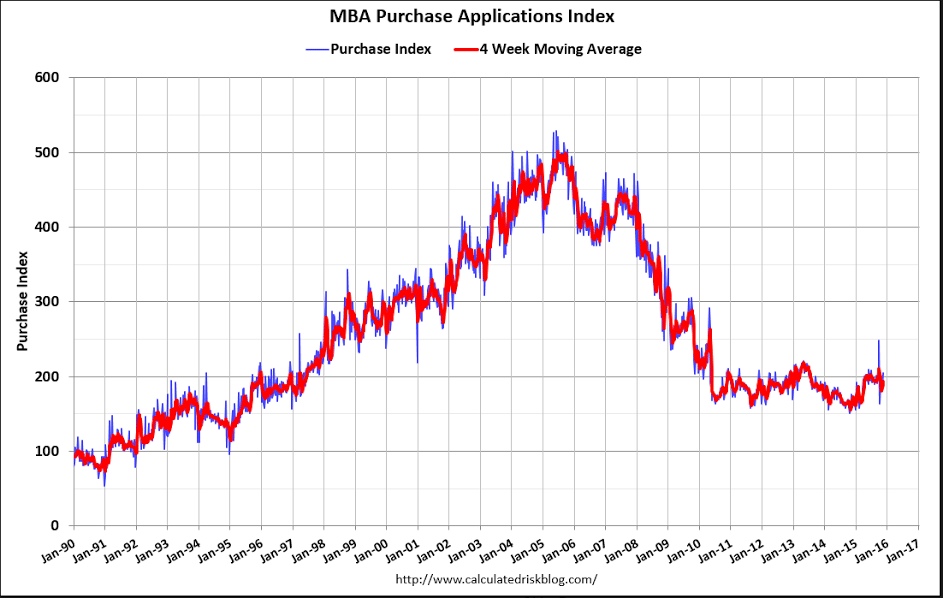
Nice to see purchase apps up but the 4 week moving average remains depressed:
MBA Mortgage Applications
Highlights
Purchase applications are moving sharply higher, up 8.0 percent in the November 27 week that, after a pause in the November 20 week, follows a 12.0 percent surge in the November 13 week. Year-on-year, purchase applications are up an eye-popping 30 percent in strength that points to much needed acceleration for underlying home sales. The rise in mortgage rates has triggered the move, encouraging buyers to step up and lock in rates before they move even higher. In contrast, demand for refinancing is easing, down 6.0 percent in the latest week. Rates edged lower in the week with the average for 30-year fixed mortgages ($417,000 or less) down 2 basis points to 4.12 percent.
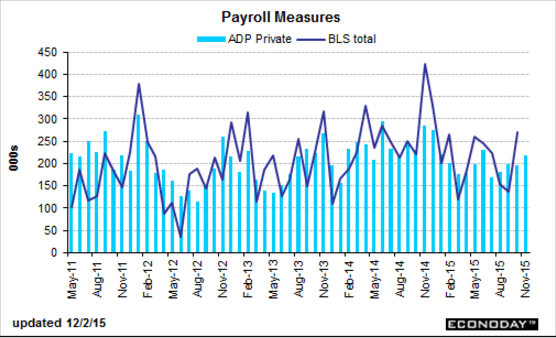
The ADP number is a forecast for Friday’s Non Farm Payroll numbers, based partially on their own payroll data. We’ll see Friday how accurate it is this time:
ADP Employment Report
Highlights
ADP is calling for strength in Friday’s employment report, at a higher-than-expected gain of 217,000 for government payrolls in November. Month-to-month, this report is not always an accurate indicator for the government’s data, forecasting a much lower reading than what turned out for October and a much higher reading than what turned out for September. But ADP’s trend has been accurate, that is steady payroll growth near 200,000 — and today’s report points to strength that would be slightly above trend.
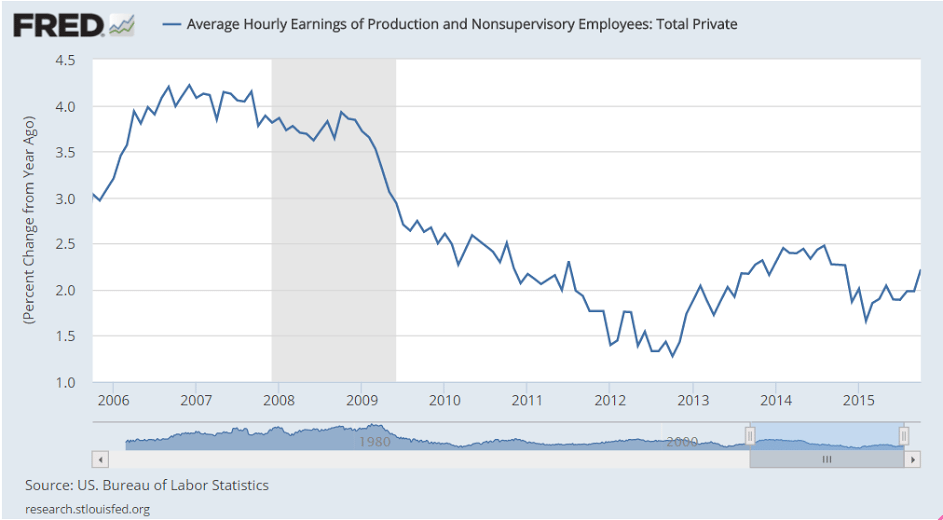
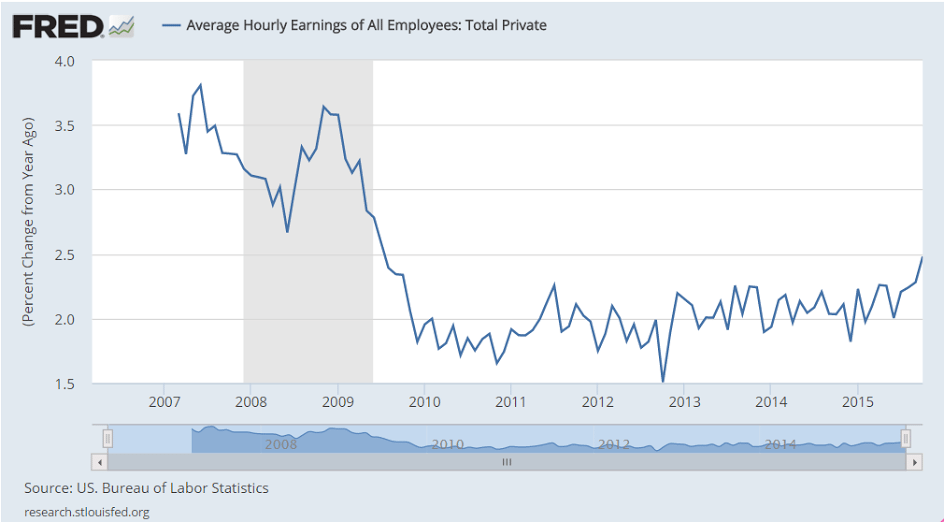
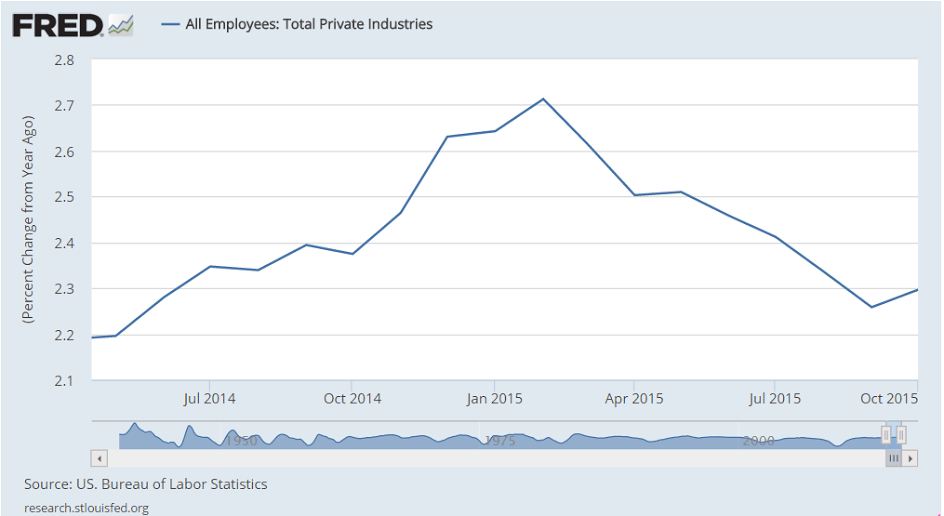
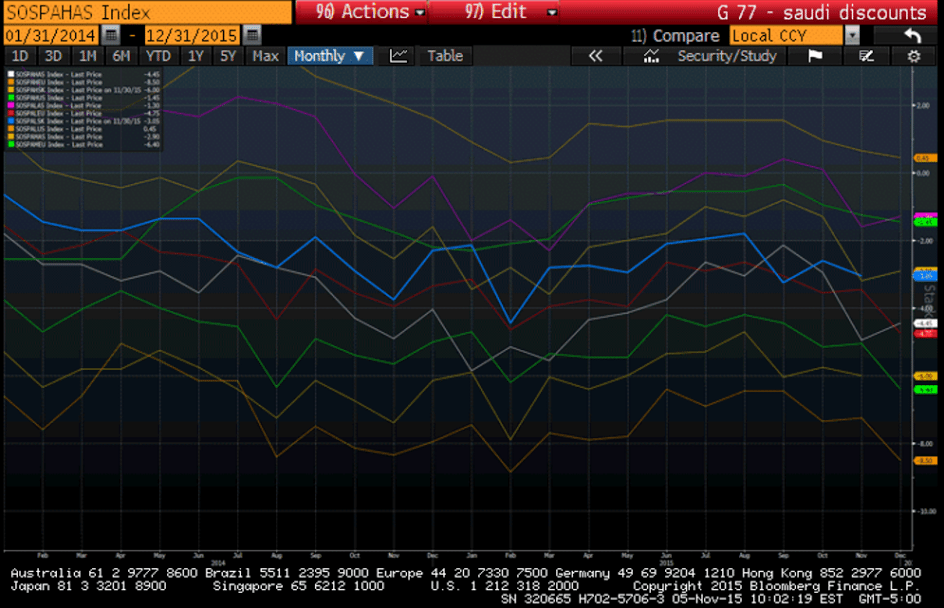
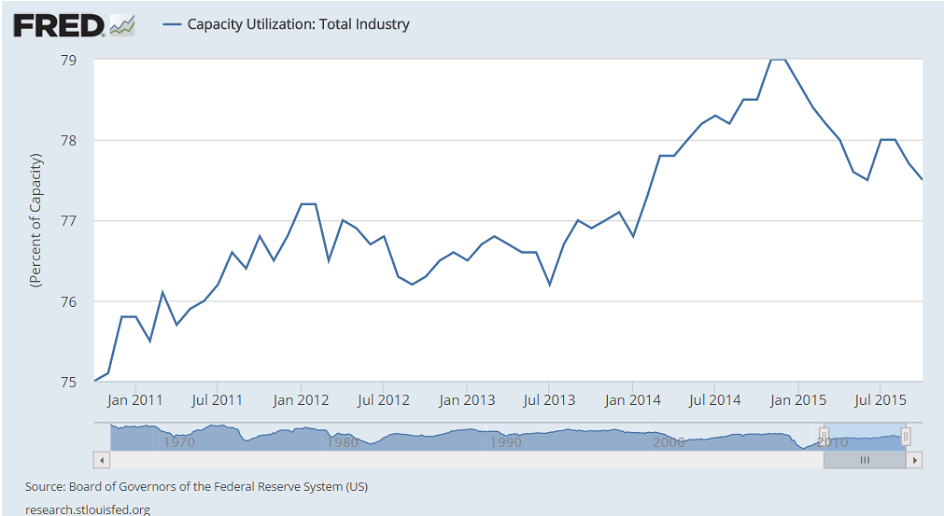
And seems to me what’s keeping unit labor costs up is low capacity utilization, as previously reported, and not wage increases. At some point business adjust with either fewer employees or higher output:
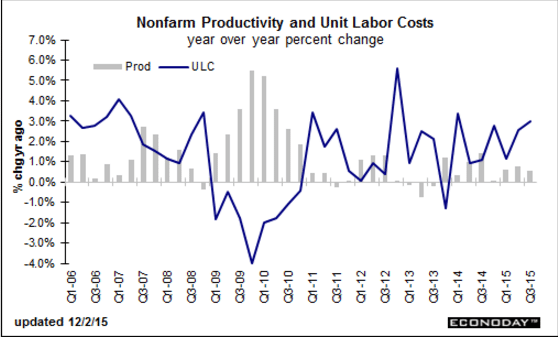
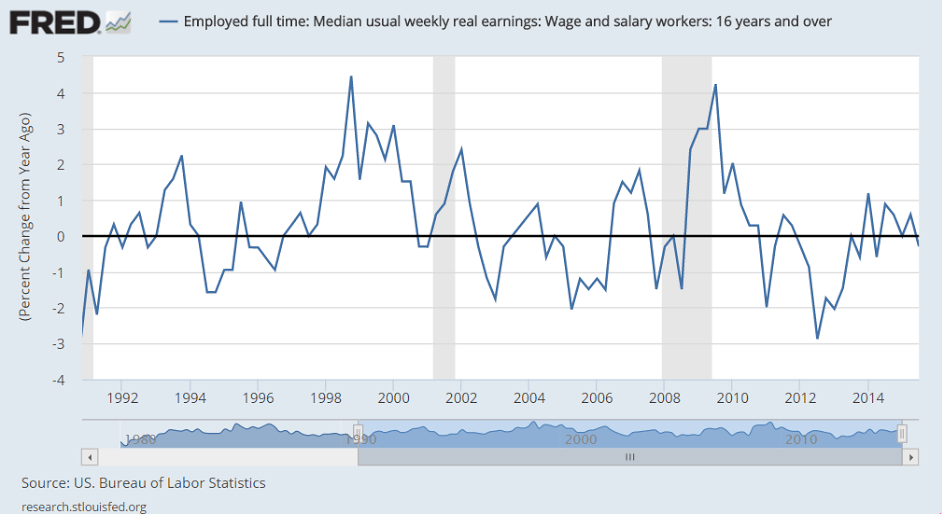
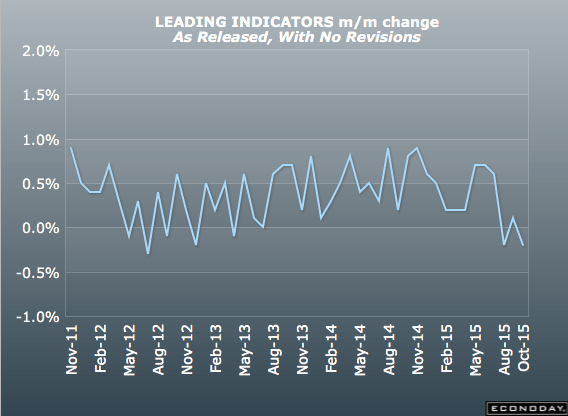
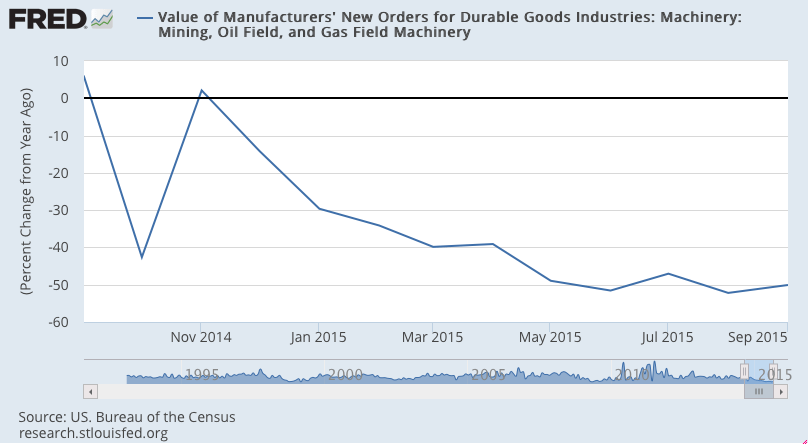
Note that this also peaked when oil related capital expenditures collapsed a year ago:
In fact it was about a year ago when oil prices fell below costs of production, triggering cuts in capital expenditures. At the time the oil price drop was universally deemed an ‘unambiguous positive’ for the US economy. I wrote that it looked to me like an unambiguous negative, listing my reasons why it would not support consumption or investment, but would instead induce a general economic deceleration with a high probability of negative growth, particularly after subsequent revisions of data.
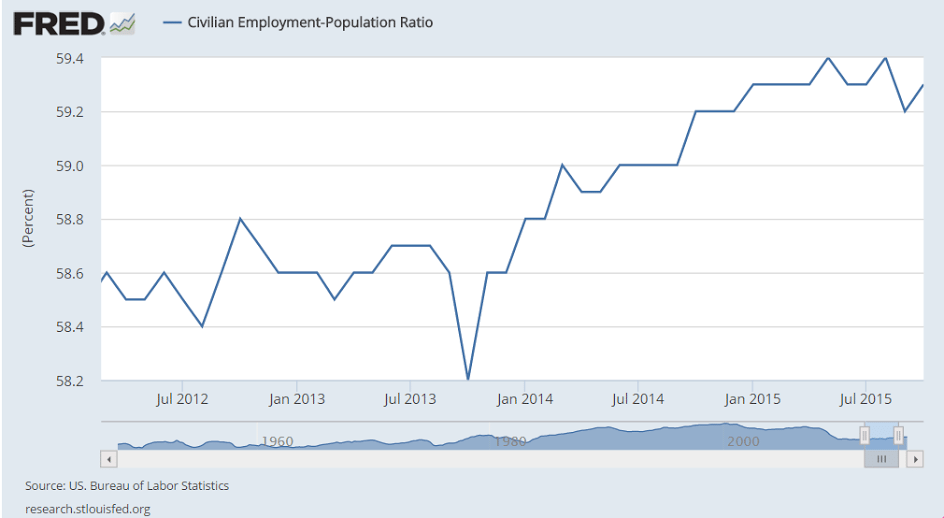
So let’s look at a few 1 year charts to isolate what’s happened:
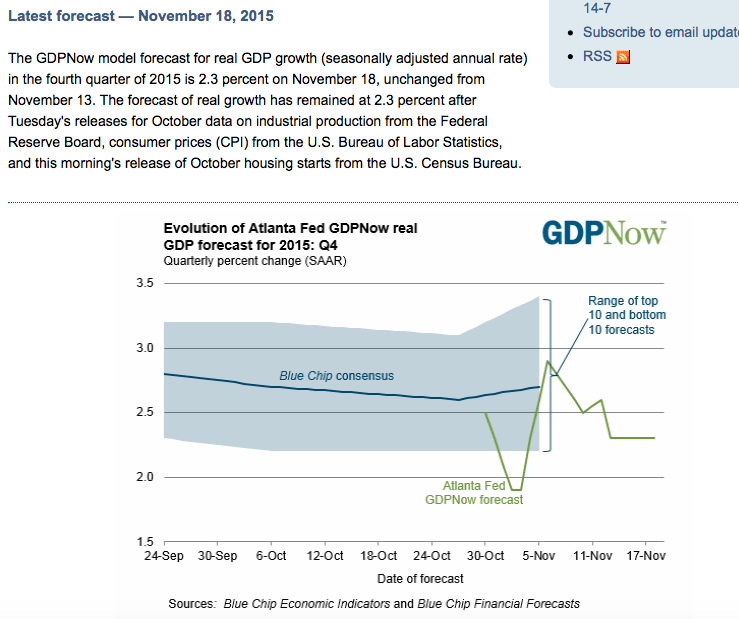
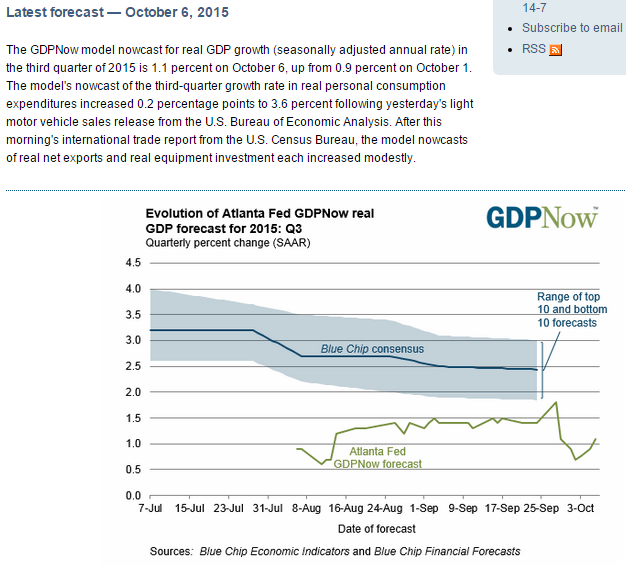
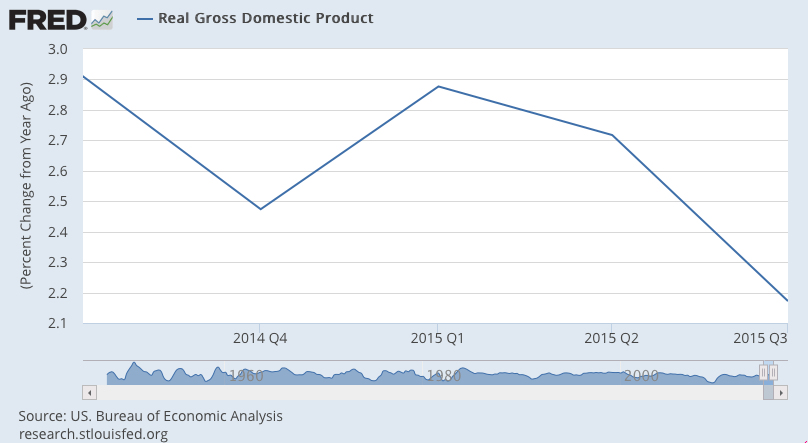
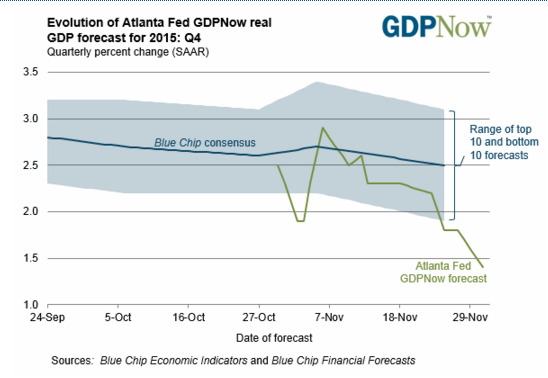
The Fed was looking for 3%+ as ‘monetary policy kicked in’ and oil prices helped consumption.
And Q4 is now looking even worse:
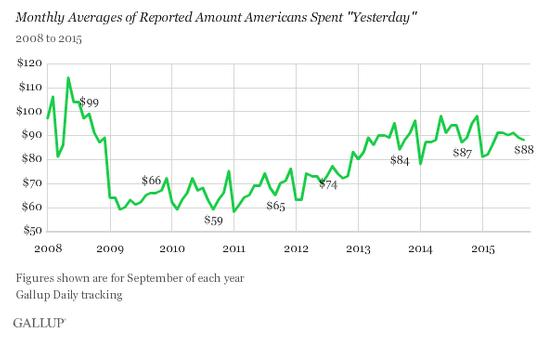
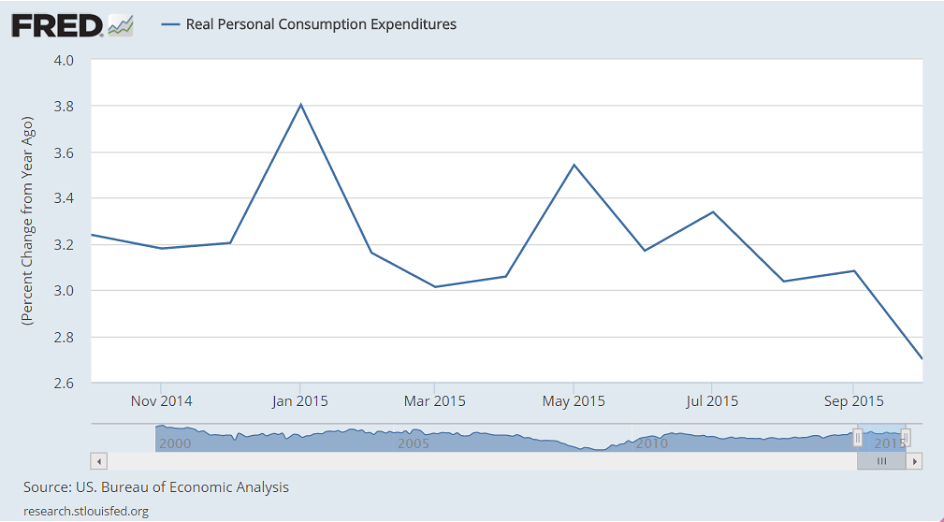
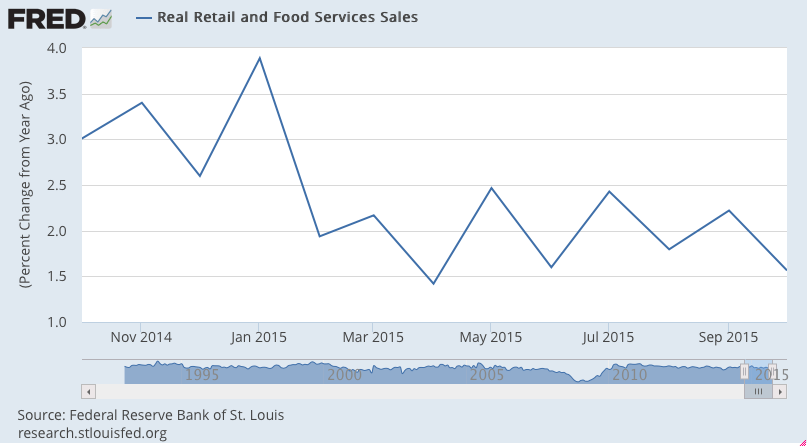
Consumption has decelerated:
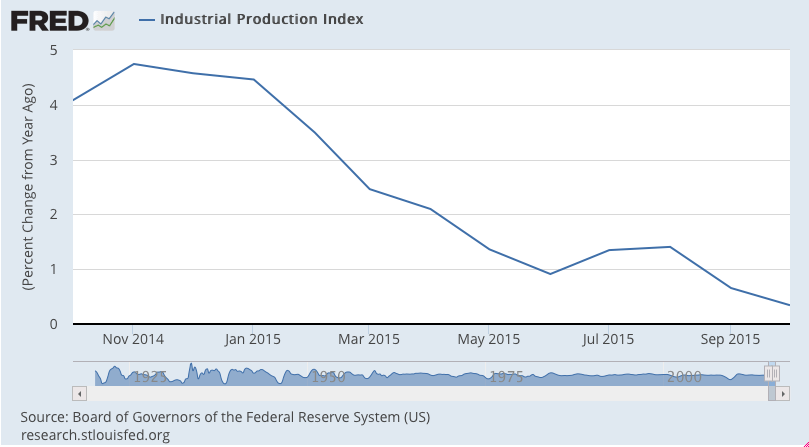
Industrial production not so good:
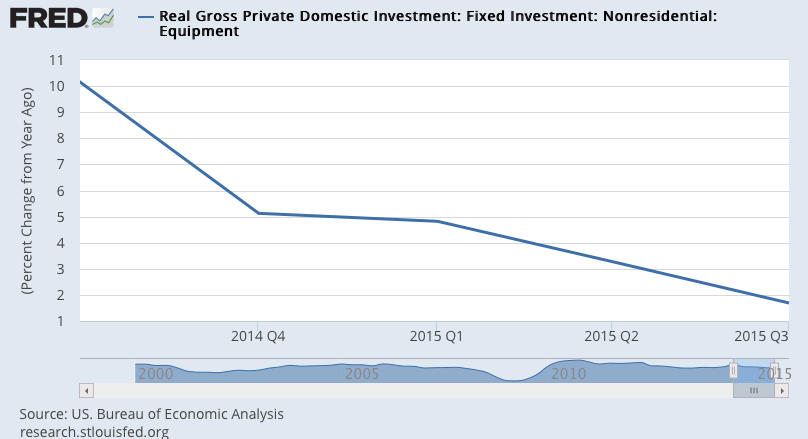
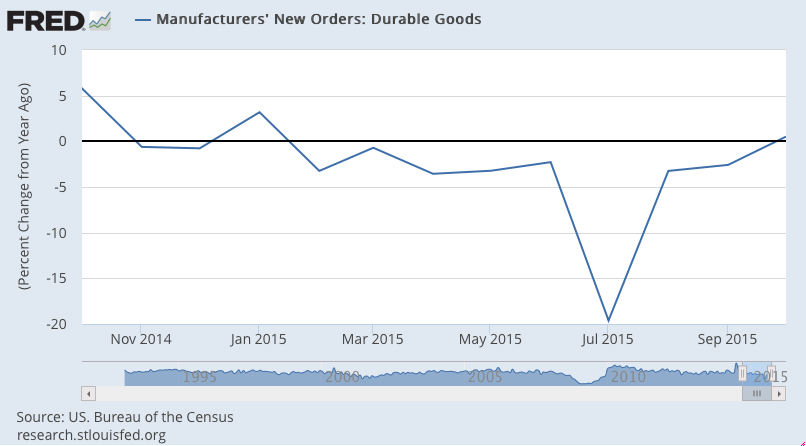
Nor investment:
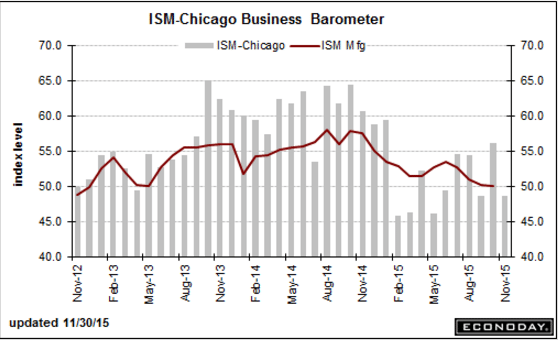
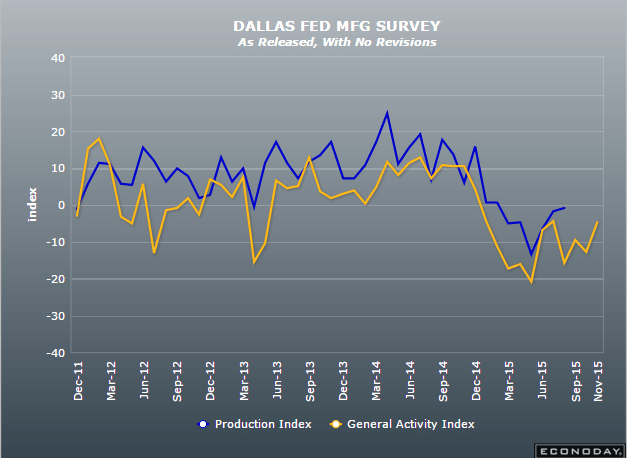
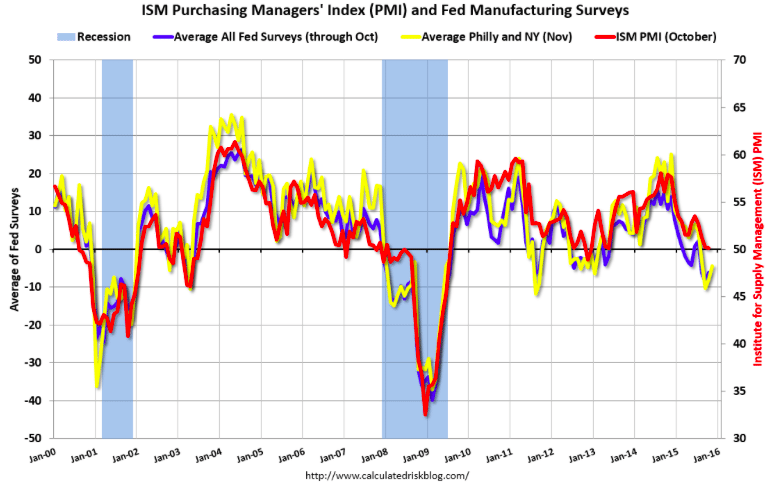
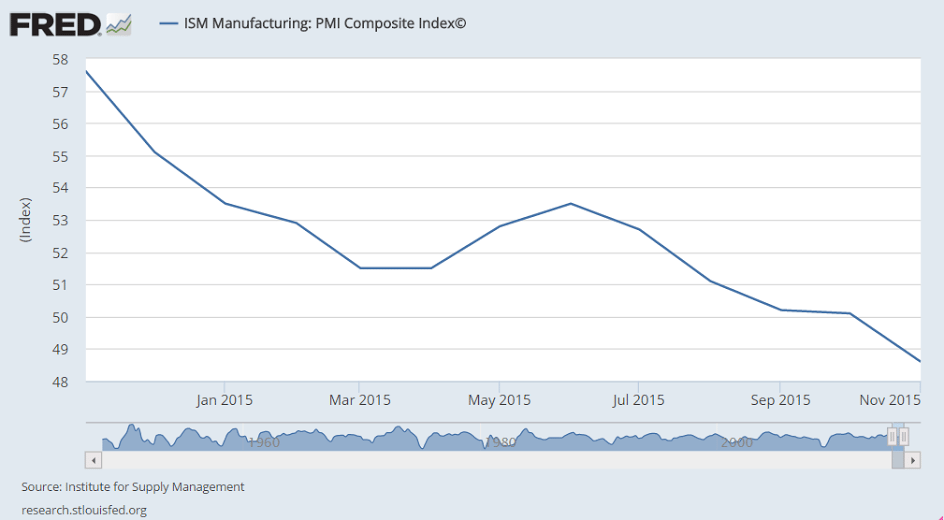
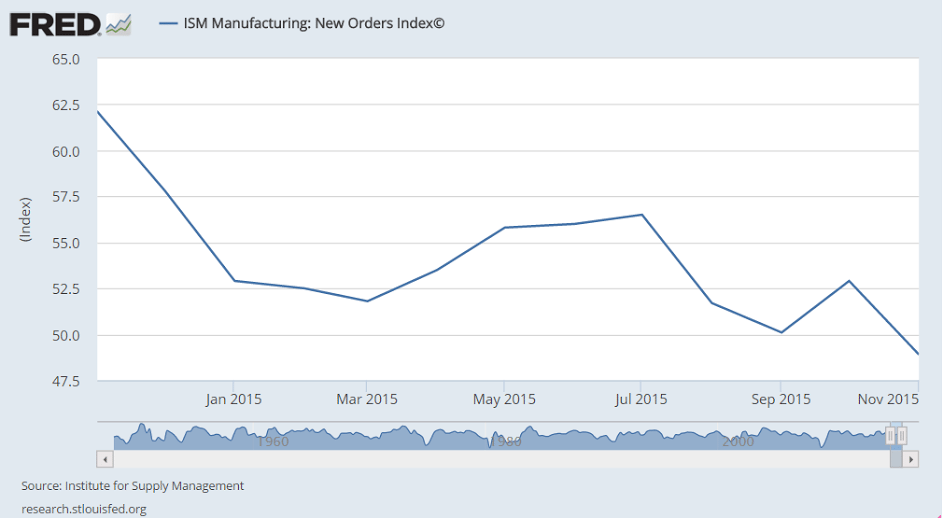
Or manufacturing:
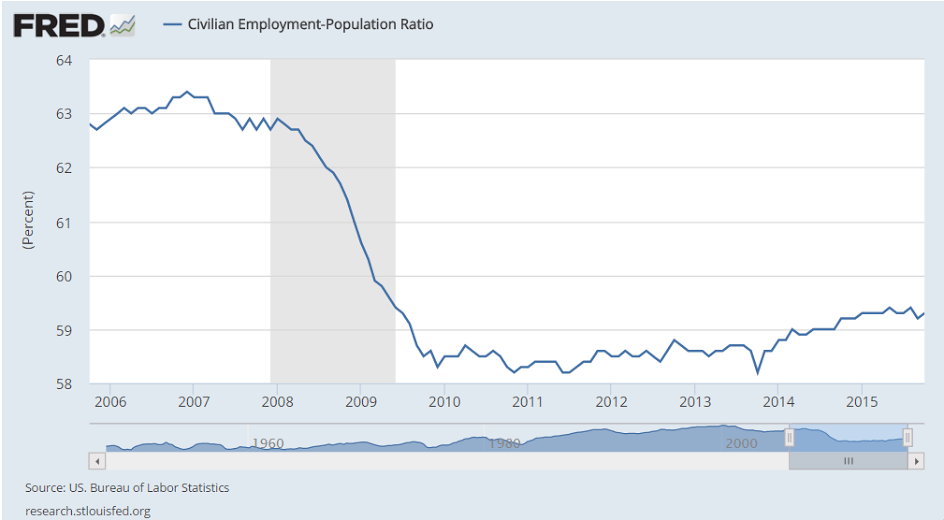
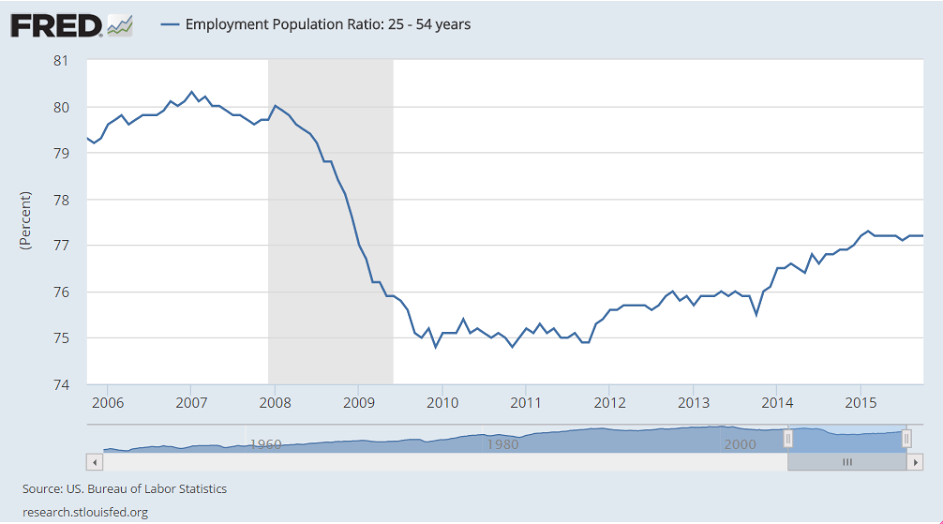
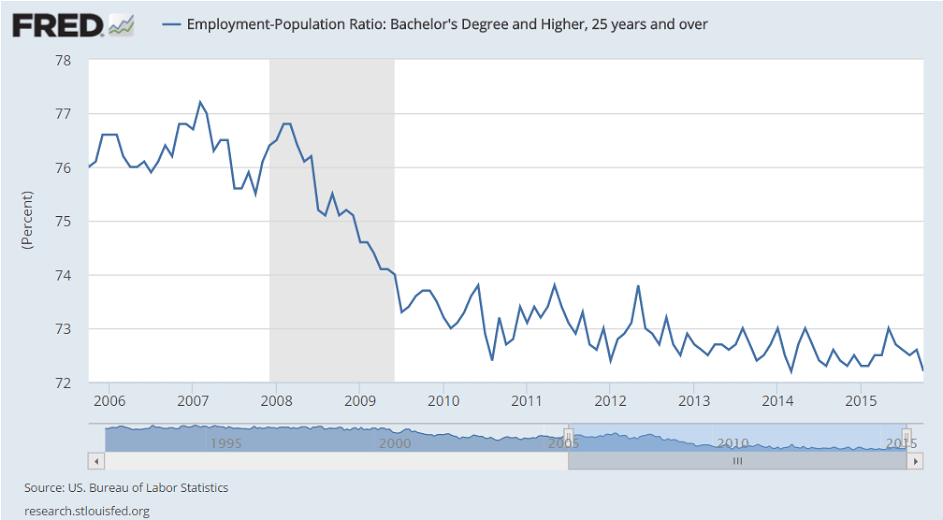
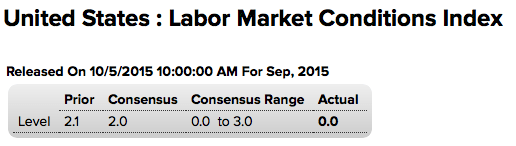
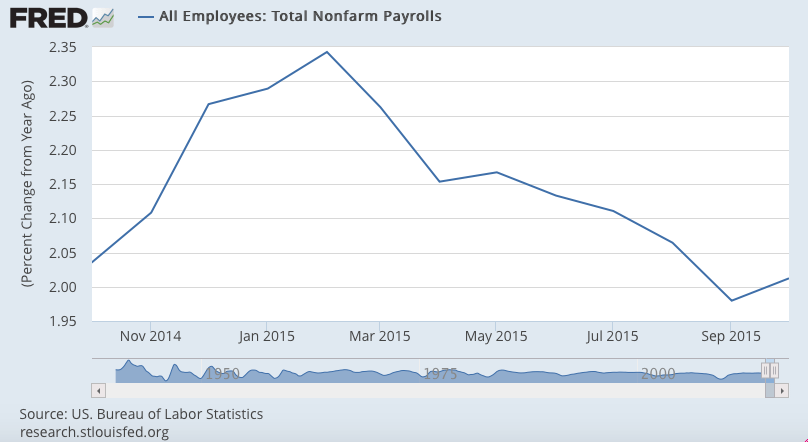
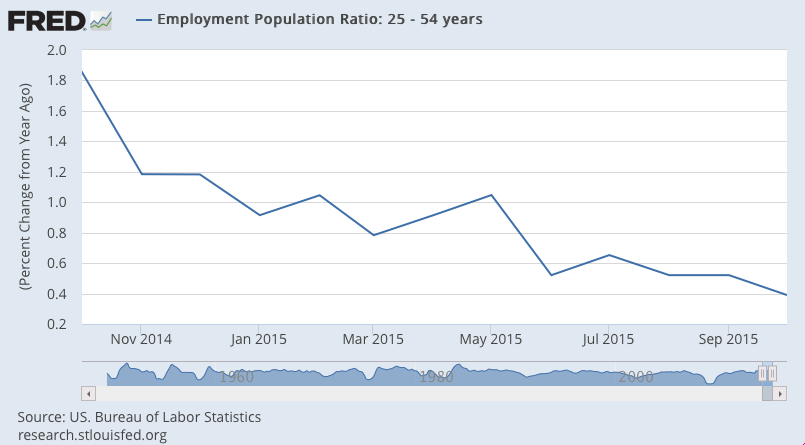
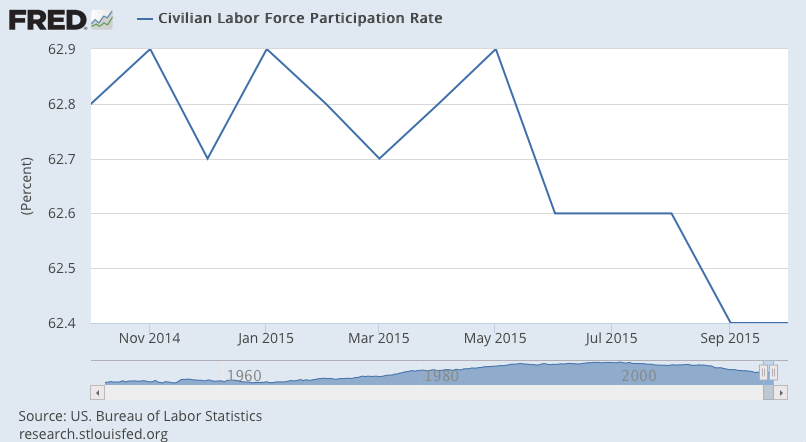
How about employment?
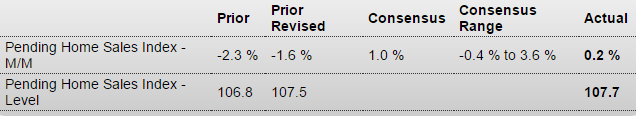
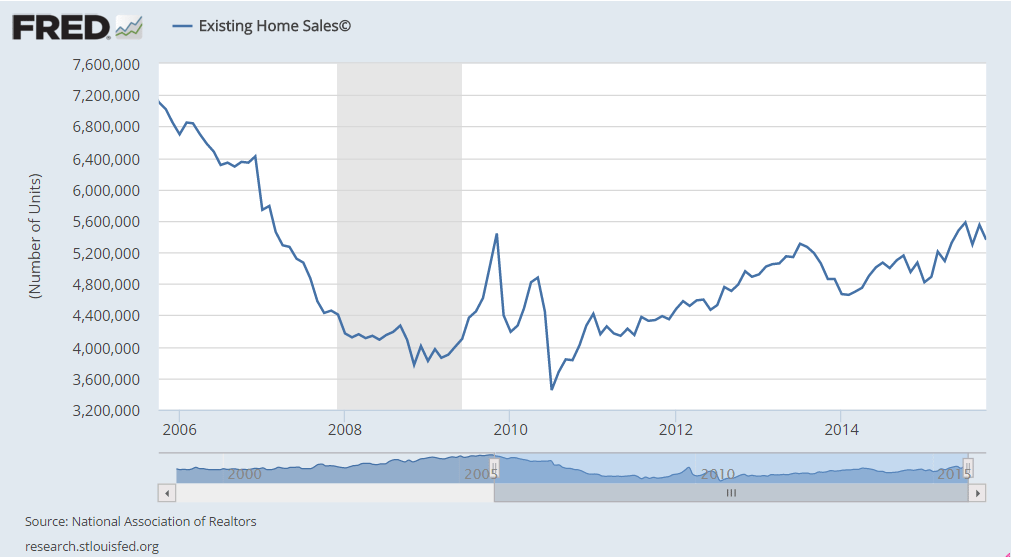
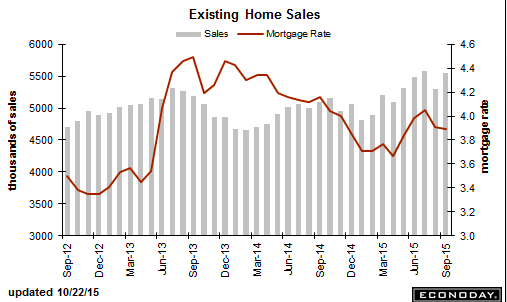
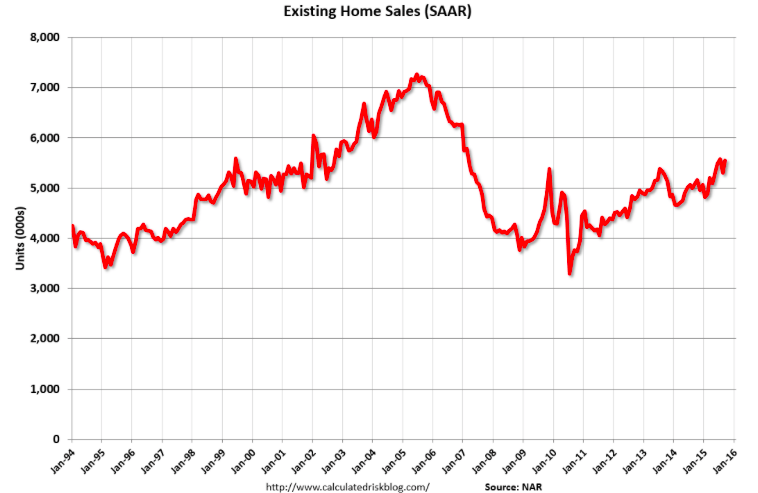
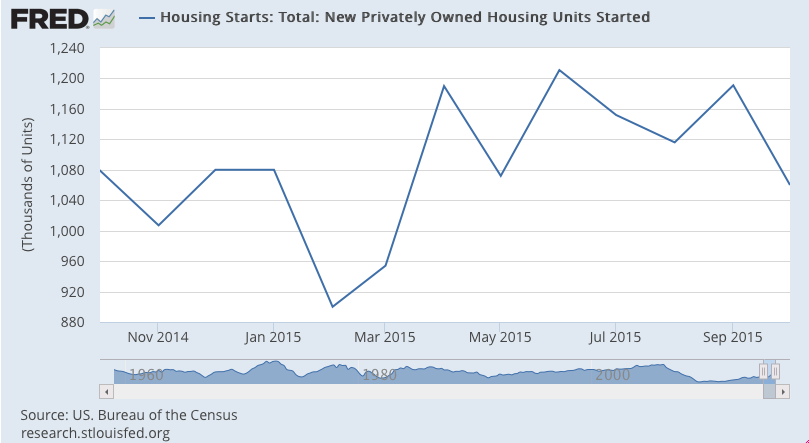
Housing starts are back to where they started from, with a mini surge related to the NY tax bread the expired in June:
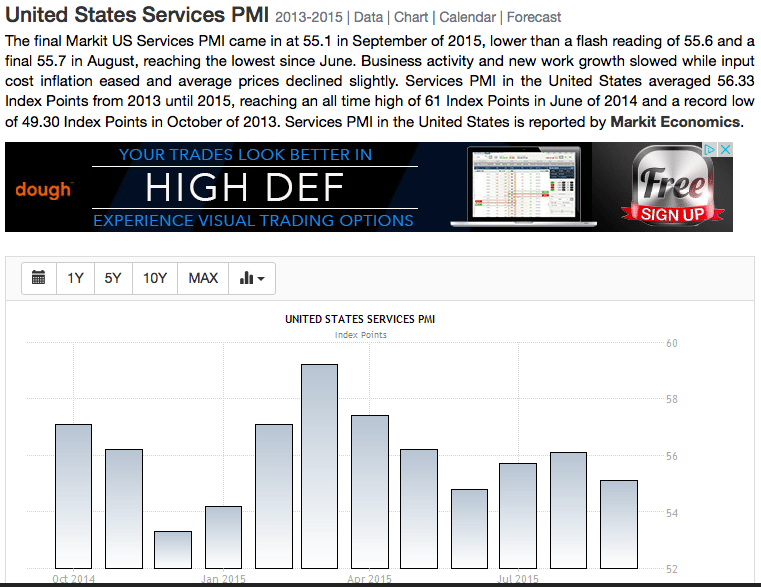
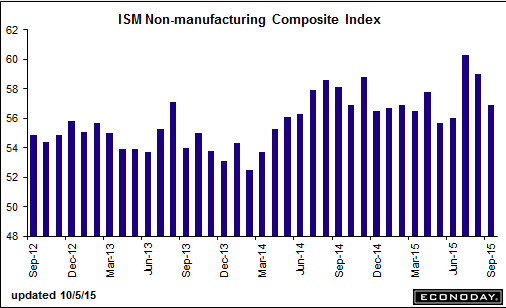
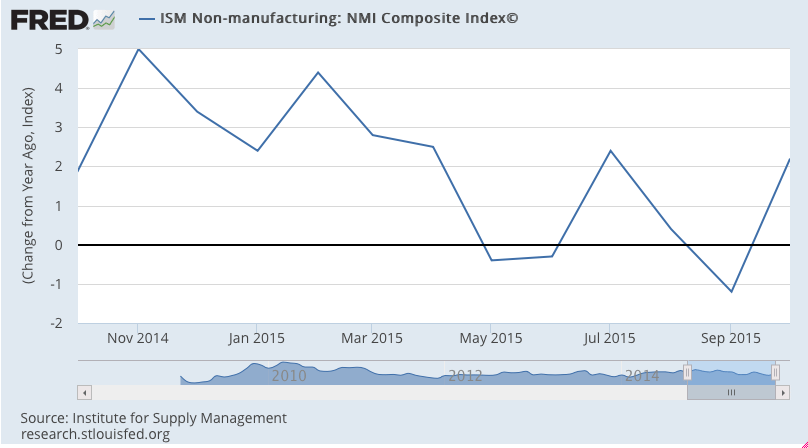
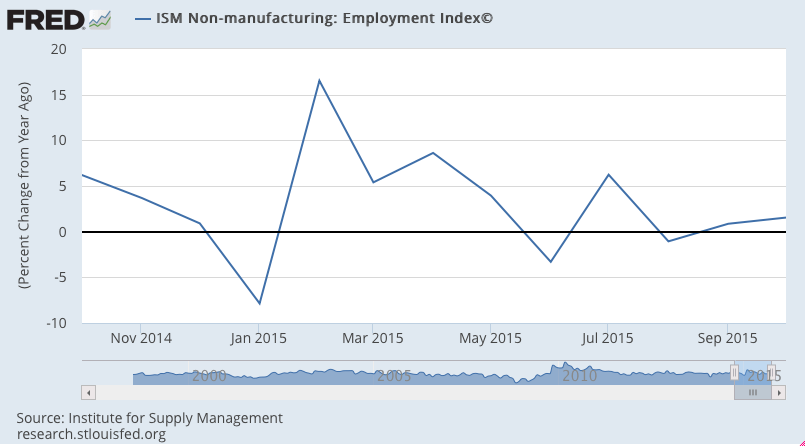
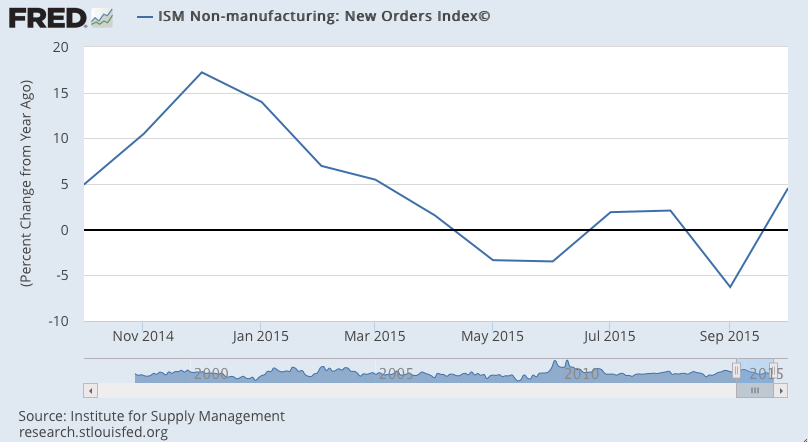
Non manufacturing slower to react, but sagging as well:
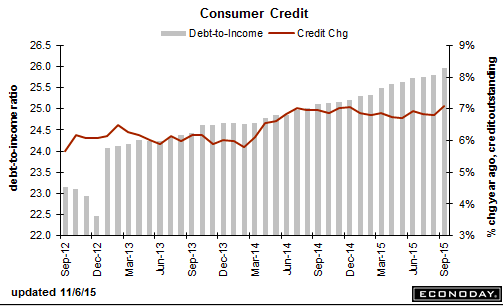
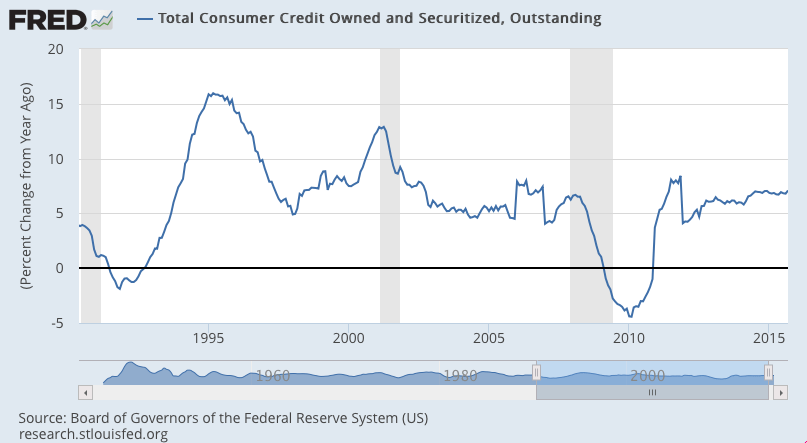
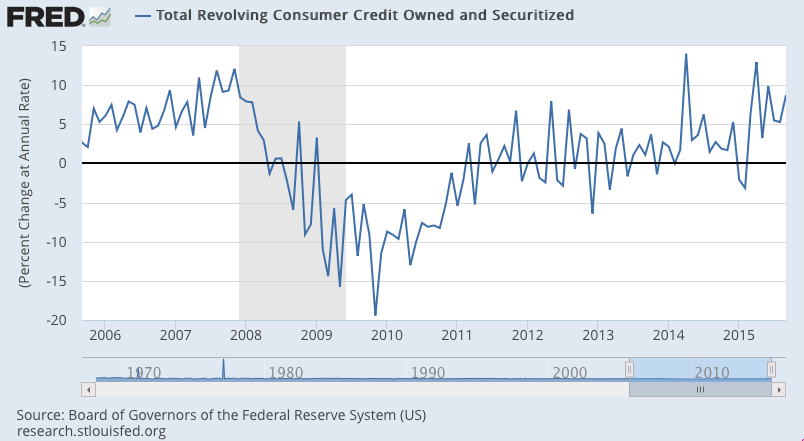
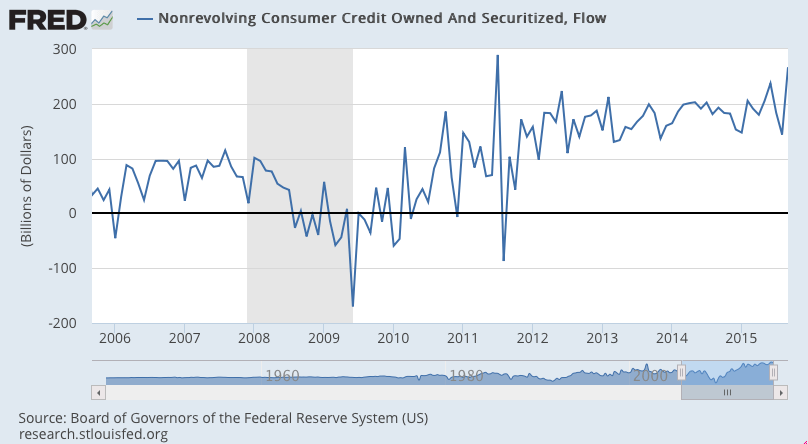
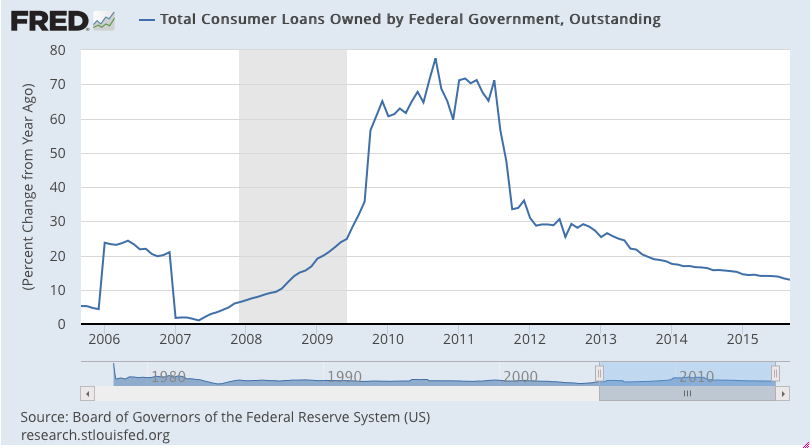
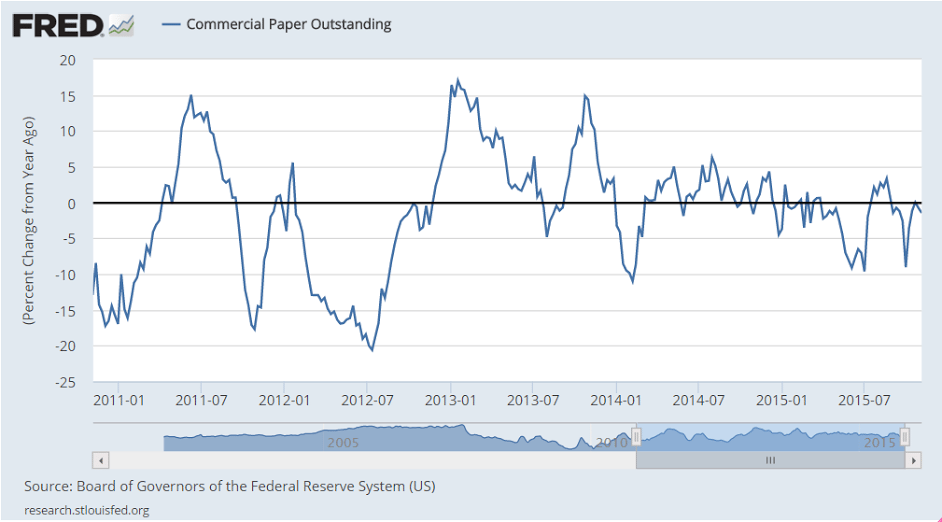
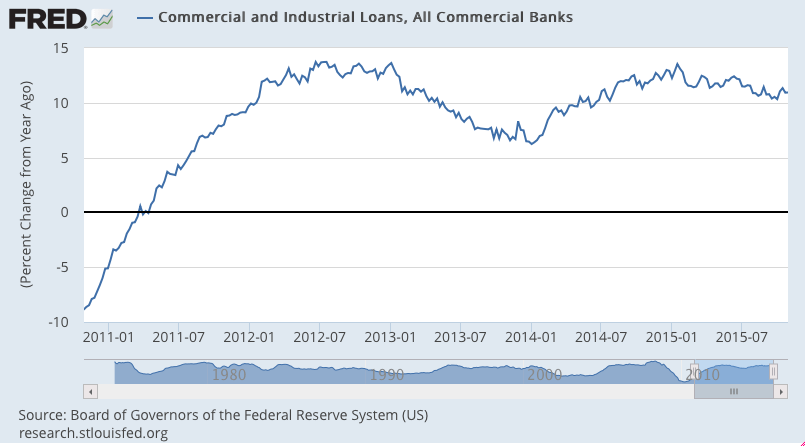
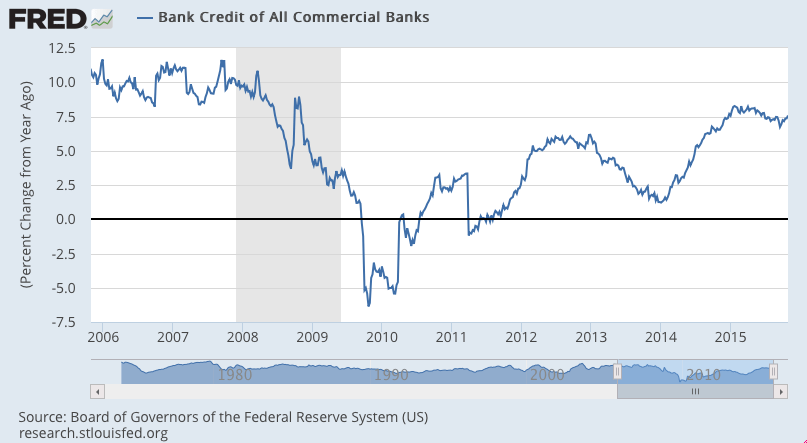
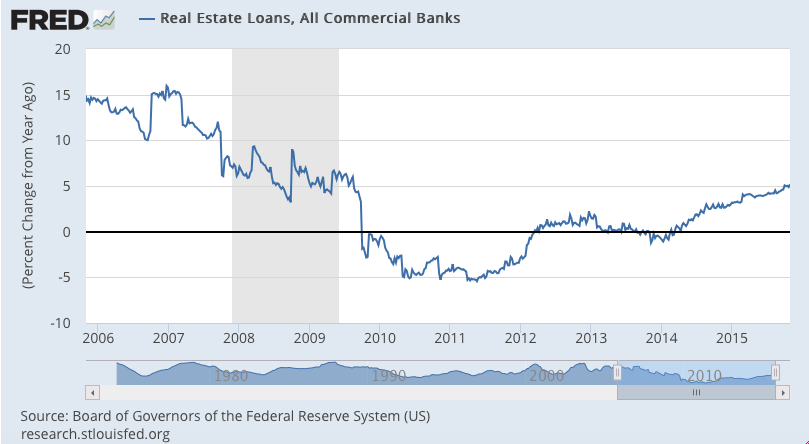
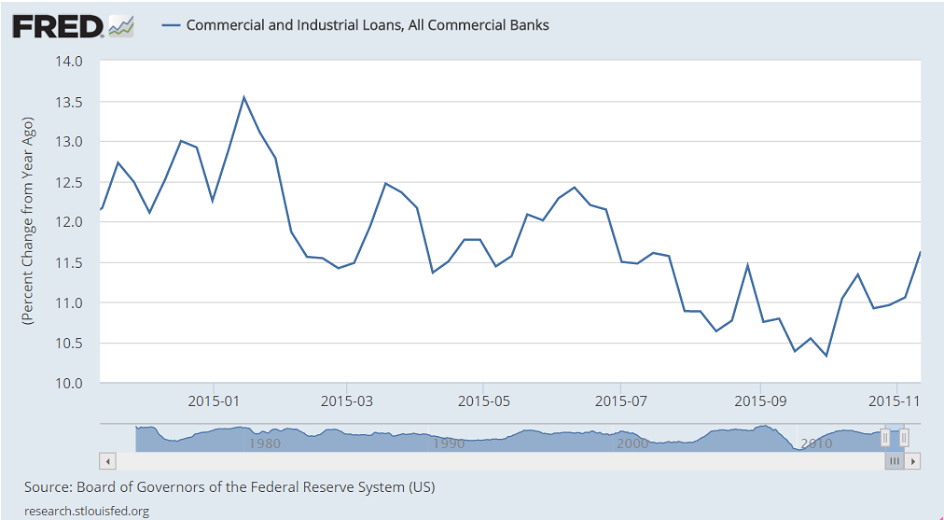
And credit aggregate growth has slowed as well:
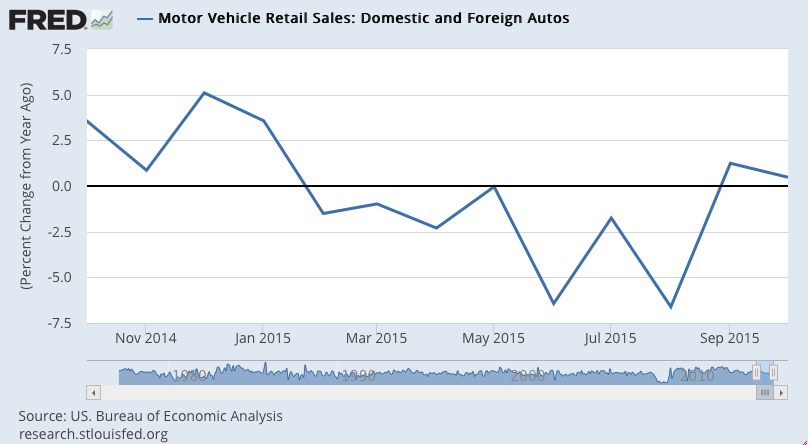
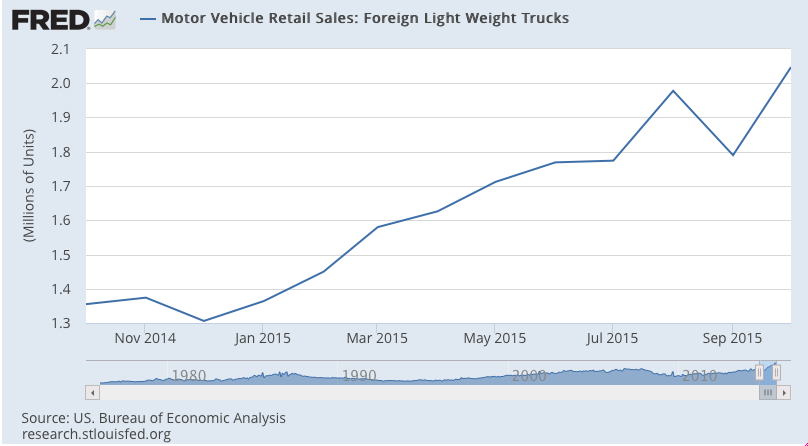
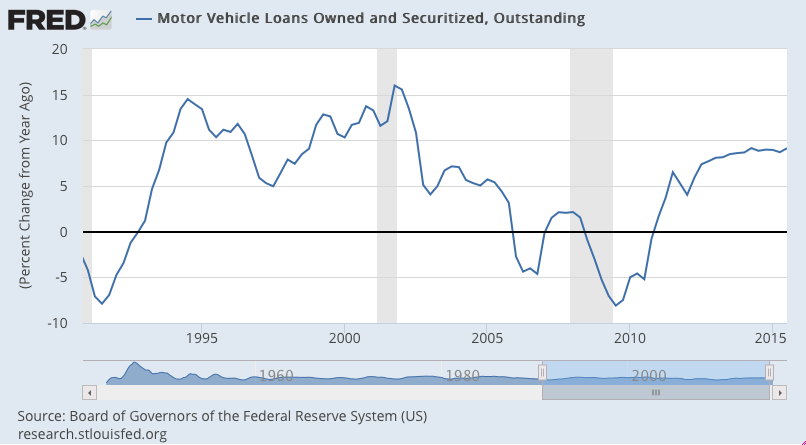
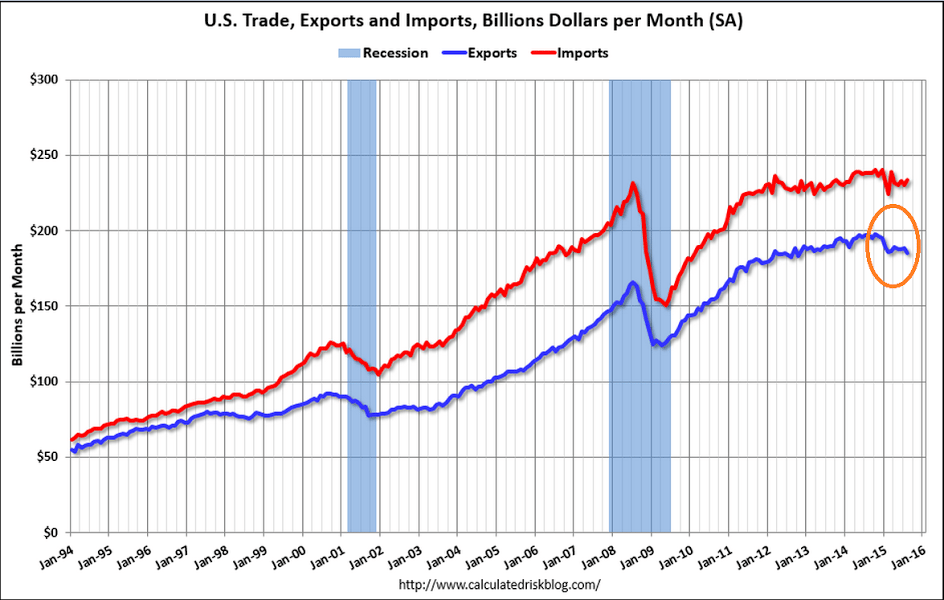
Autos have been the ‘bright spot’ but turns out the growth has been from imports: