Full size image

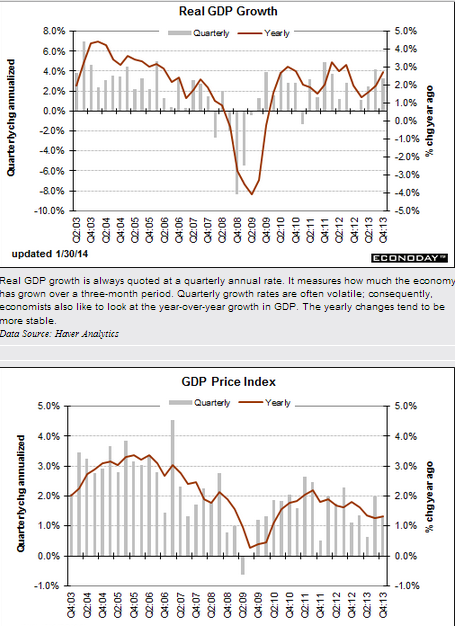
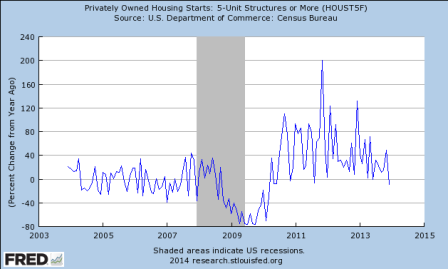
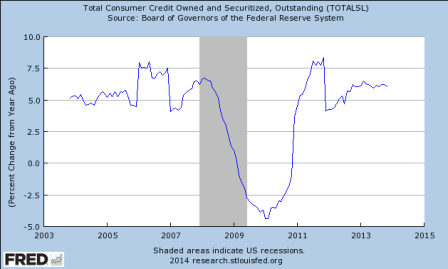
Still tame (with a hint of moving up some) particularly in comparison to the last cycle which was considered relatively tame:
Personal Consumption had a nice spike up in November:
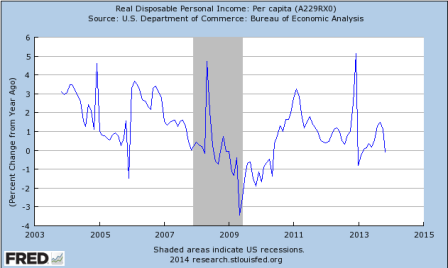
But without the income to sustain it? (Ignore the latest yoy data point ‘dip’ as it’s from the spike a year ago. Just look at the last few monthly data points)
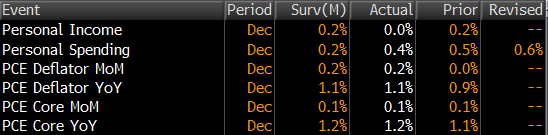
Highlights
Personal income was flat in December while spending was up. Income sluggishness may have been weather related. Personal income was unchanged after rising 0.2 percent in November. Markets expected a 0.2 percent rise. The wages & salaries component posted flat in December, following a 0.5 percent boost the month before.
Personal spending, however, was moderately strong, rising 0.4 percent after a 0.6 percent boost in November. Spending was led by a 1.5 percent jump in nondurables with services gaining 0.4 percent. Durables declined 1.8 percent after a 1.8 percent increase the month before.
The rise in personal consumption was not just price related. Real spending increased 0.2 percent in December after an increase of 0.6 percent in November.
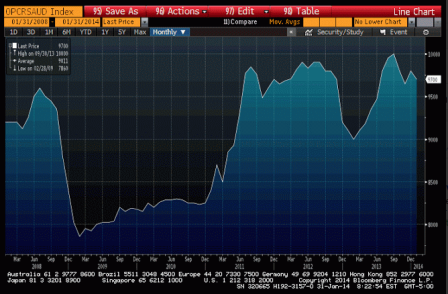
Meanwhile, Saudi oil output, which indicates the net demand for global crude, keeps them in the sweet spot as swing producer/price setter:
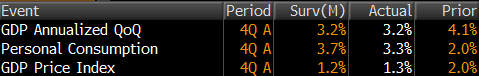
Highlights
The economy ended the year on a moderately positive note, rising an annualized 3.2 percent in the advance estimate for the fourth quarter. This followed a 4.1 percent boost in the third quarter. The consensus expected a 3.0 percent rise in the fourth quarter.
But demand was not as strong. Final sales of domestic demand gained 2.8 percent after a 2.5 percent boost in the third quarter. Final sales to domestic purchasers slowed to 1.4 percent in the fourth quarter after a 2.3 percent increase the prior quarter. The softening was largely due to a drop in government purchases. A positive was improvement in consumer spending.
Inflation is soft with the GDP price index rising only 1.3 percent after a 2.0 percent increase in the third quarter. The core price index eased to 1.7 percent, following a 1.9 rise in the third quarter.

Highlights
A surprise 19,000 rise in initial jobless to a much higher-than-expected 348,000, together with a rising trend for continuing claims, are not pointing to much improvement for the labor market, at least for January. But a plus in the data is the 4-week average for initial claims, up only slightly to 333,000 which is more than 20,000 below the month-ago trend.
Another plus is a 16,000 dip in continuing claims to 2.991 million in data for the January 18 week. The 4-week average, however, is up sharply, 43,000 higher to 2.970 million which is the highest reading since August. The unemployment rate for insured workers, which had been as low as 2.1 percent in November, is at 2.3 percent for a 3rd straight week.
There are no special factors at play in today’s report though the latest initial claims are for the shortened Martin Luther King week which raises the risk of adjustment volatility. The Fed yesterday cited improvement underway in the labor market but its hard to find convincing proof in this report.
FLASH- Fed to taper another $10 billion
Maybe they are concerned about all the interest income they are removing from the economy?
;)
General comments:
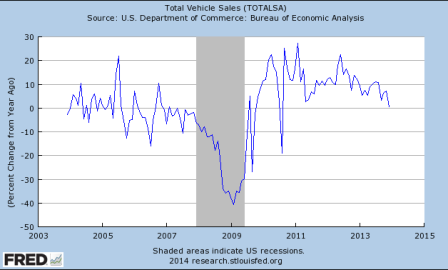
For GDP to grow at 3% all the pieces have to ‘average’ 3% growth
And if anything is growing at a slower pace than last year, something else has to grow at a faster pace or GDP growth slows.
So the growth rate of car sales has slowed and is expected to slow further this year:
How about housing?

Pending home sales year over year change:
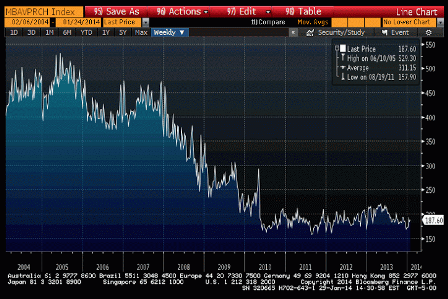
New mortgage applications to purchase homes:
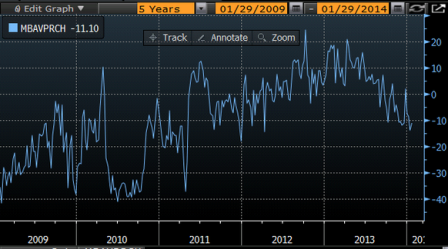
Purchase apps year over year:
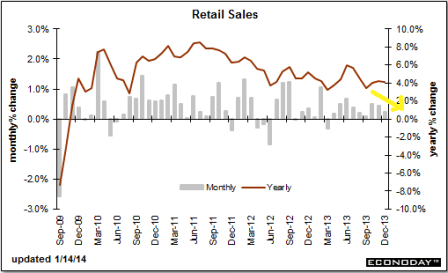
Retail sales growth has been generally slowing and has yet to show signs of increasing:
How about orders for durable goods?
Is the income growth there to support higher levels of spending?
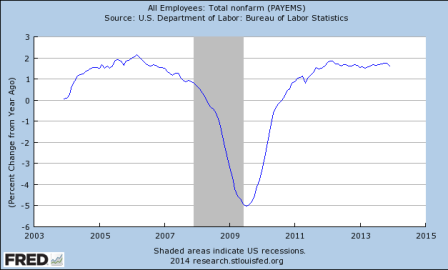
Is the growth rate of employment increasing?
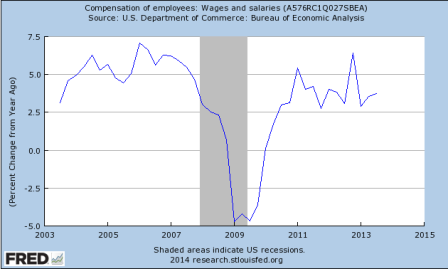
Compensation?
Maybe consumers are somehow borrowing to spend at a higher rate?
How about the foreign sector?
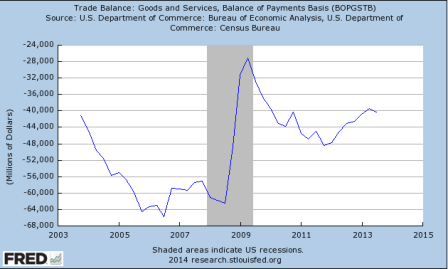
Well, it was helping, but we need the rate of change to increase to have more of an impact than last year. And with GDP around $17 trillion, last year’s rate of increase has to be exceed by about $7 billion/mo to add an additional .5 to GDP. And the substantial currency depreciation of the EM’s isn’t going to help any.
Just saying, something big needs to start growing a lot just to keep GDP growth positive?
So what happened to growth?
Private sector spending (including non residents) in excess of income may no longer be keeping up with the reduction in the federal govt’s spending in excess of its income (deficit spending spending)?
Maybe the federal deficit is too low for current credit and financial conditions?
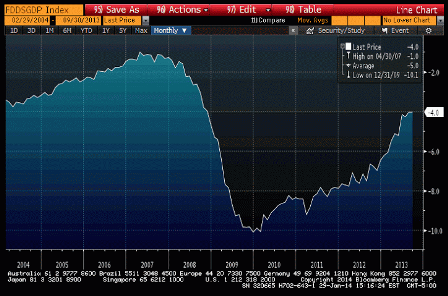
Deficit as a % of GDP through Sept 13. It’s even lower currently:
What a good economy should look like
Warren Mosler, from a talk in Chianciano, Italy, on January 11, 2014 entitled Oltre L’Euro: La Sinistra. La Crisi. L’Alternativa.
What a good economy should look like
I just want to say a quick word about what a good economy is because it’s been so long since we’ve had a good economy. You’ve got to be at least as old as I am to remember it. In a good economy business competes for people. There is a shortage of people to work for business. Everybody wants to hire you. They’ll train you, whatever it takes. They hire students before they get out of school. You can change jobs if you want to because other companies are always trying to hire you. That’s the way the economy is supposed to be but that’s all turned around. For one reason, which I’ll keep coming back to, the budget deficit is too small. As soon as they started tightening up on budget deficits many years ago, we transformed from a good economy where the people were the most important thing to what I call this ‘crime against humanity’ that we have today……
So what you do is you target full employment, because that’s the kind of economy everybody wants to live in. And the right size deficit is whatever deficit corresponds to full employment…
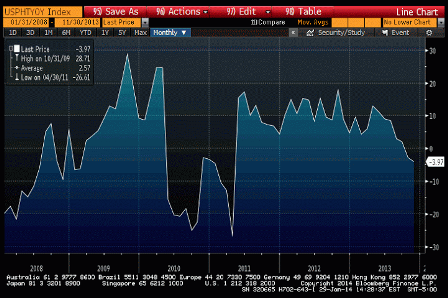
Seems no one is pointing out how this is all looking a lot like ‘catch up’ vs last year’s yen move?
As previously discussed, the proactive yen move from under 80 to over 100 vs the dollar- a 30% or so pay cut for domestic workers in terms of prices of imports- was an internationally deflationary impulse.
It’s called ‘currency wars’ with the exporters pushing hard on their govts to do whatever it takes to keep them ‘competitive’. And all, at least to me, shamelessly thinly disguised as anything but. And, in fact, it’s not ‘wrong’ to call it ‘dollar appreciation’ rather than EM currency depreciation given the deflationary bias of US (and EU) fiscal and monetary (rate cuts/QE reduce interest income for the economy) policy.
This is a highly deflationary force for the US (and EU) via import prices and lost export pricing power, also hurting earnings translations and, in general weakening US domestic demand, as increased domestic oil output doesn’t reduce net imports as much as would otherwise be the case.
And while I’m not saying energy independence is a ‘bad thing’ note that the UK has been largely ‘energy independent’ for quite a while, so there’s obviously more to it.
The optimal policy move for the US is fiscal relaxation- like my proposed FICA suspension- to get us back to full employment and optimize our real terms of trade. (and not to forget the federally funded transition job for anyone willing and able to work to facilitate the transition from unemployment to private sector employment as the economy booms).
But unfortunately Congress is going the other way and making it all that much worse.
Emerging market currencies take a battering
By Katrina Bishop
January 24 (CNBC) — Emerging market currencies continued to take a beating on Friday — with Turkey’s lira hitting a new record low against the dollar yet again — amid growing concerns about the U.S. Federal Reserve’s monetary guidance.
On Friday, the dollar strengthened to 2.3084 against Turkey’s currency. Investors also piled out of the South African rand and Argentina’s peso, and both the Indian rupee and the Indonesian rupiah fell to two-week lows against the dollar. Meanwhile, the Australian dollar fell to $0.8681 – its lowest level in three-and-a-half years.
“The market is in panic mode. We have huge psychological fear that is going to emerging markets, despite a global environment that hasn’t changed that much,” Benoit Anne, head of global emerging market strategy at Societe Generale, told CNBC.
“My bias at this stage — although it’s a bold one — is that this is all about the credibility of the Fed with respect to its forward guidance. This fear that the Fed is going to tighten quicker than expected is translating into emerging markets.”
The U.S. central bank has promised that it will not raise interest rates until unemployment hits 6.5 percent – but some analysts are concerned that rate hikes could come sooner than expected.
U.S. monetary policy has always had a significant on emerging markets, and the Fed’s bond-buying program boosted risk sentiment, causing investors to turn their back on so-called “safe havens” and pile into assets seen as riskier – such as emerging market currencies.
Speculation of Fed tapering in 2013 hit emerging markets hard, with currencies including India, Turkey, Russia and Brazil coming under intense pressure in 2013.
But Anne added these recent moves were likely to be more temporary.
“It’s a matter of weeks rather than the whole year 2014 as a total write off for emerging markets,” he said. “Although it will take the Fed re-establishing its credibility towards forward guidance before we see respite in emerging markets.”
Warren Mosler on the Economy
Main provisions Expiring:
Housing credits- low income credits, deductible mortgage premiums
Energy Efficient Residential construction/appliances
Energy Efficient Commercial buildings/construction
Renewable Energy construction/production credits- notably wind
These may all have caused Q4 jumps in construction etc. Quarterly/monthly data for energy efficient construction and renewable production is not available for comparison, figures are usually collected annually.
Other things that stick out:
Alternative/Renewable fuels credit- Will probably see decrease in production
Research and experimentation credit
Highlights
Sales of existing homes bounced back in December from a very weak November but not by much, at plus 1.0 percent for a slightly lower-than-expected annual rate of 4.87 million units.
The outlook for future sales is not good, at least based on available supply of homes on the market which fell sharply to 4.6 months from 5.1 months in November. Rising prices are another negative for the sales outlook, up 1.3 percent for the median to $198,000. At plus 9.9 percent, the year-on-year rate for the median price contrasts sharply with the year-on-year sales rate of minus 0.6 percent.
I’m not yet saying claims have bottomed, but can’t say they haven’t either
At a lower-than-expected 326,000 in the January 18 week, initial jobless claims, which at year-end were not signaling improvement in the labor market, are now signaling at least some improvement. The Econoday consensus had been looking for 330,000. The 4-week average is down 3,750 to 331,500 which is more than 10,000 lower than the month-ago comparison to offer an indication of strength for the January employment report.
But in a partial offset, continuing claims are not coming down. Continuing claims, which are reported with a 1-week lag, rose 34,000 in the January 11 week to 3.056 million for a second straight reading over 3.0 million. Continuing claims had held below 3.0 million through the second half of last year. The 4-week average is up 31,000 in the week to 2.939 million which is the highest reading since August. The unemployment rate for insured workers, which had been as low as 2.1 percent in November, is steady for a second straight week at 2.3 percent.
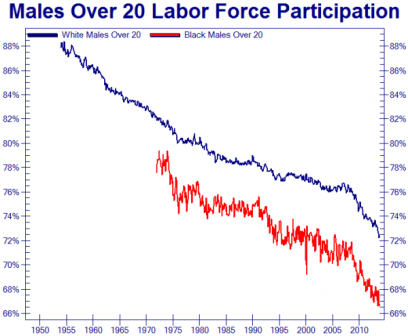
and the next thing they are going to tell us is that black males age more quickly than white males…
they would’t recognize a lack of aggregate demand if it jumped up and put everyone out of work…
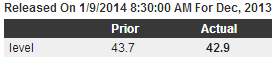
Gallup US Payroll to Population
Highlights
The December U.S. Payroll to Population employment rate (P2P) declined to 42.9 percent from 43.7 percent in November. It is the lowest Gallup has measured since March 2011. Gallup’s P2P metric estimates the percentage of the U.S. adult population aged 18 and older that is employed full time by an employer for at least 30 hours per week. P2P is not seasonally adjusted. From December 2012, the P2P rate is down from 44.4 percent in December 2012 and 43.8 percent in December 2011, but is higher than the 42.4 percent of December 2010.
Unlike Gallup’s P2P rate, which is a percentage of the total U.S. population, traditional employment metrics, such as the unemployment rates Gallup and the U.S. Bureau of Labor Statistics (BLS) report, are a percentage of the workforce. Gallup defines the “workforce” as adults who are working or actively looking for work and available for employment. The U.S. workforce participation rate in December was 65.8 percent, down from November’s 66.9 percent and from 66.8 percent in December 2012.
Without seasonal adjustment, Gallup’s December unemployment rate was 7.4 percent. Gallup’s seasonally adjusted U.S. unemployment rate for December, using an estimate of the government’s likely adjustment factor, is 7.6 percent, down from 8.6 percent in November. Gallup calculates this rate by applying the adjustment factor the government used for the same month in the previous year, which in December 2012 was an increase of 0.2 percentage points. The exact adjustment the government uses for December 2013 will not be known until Friday’s BLS release. The government’s unemployment estimates are relatively stable from month to month; Gallup’s measure of unemployment tends to exhibit more monthly fluctuation.
Definition
Gallup’s Payroll to Population, underemployment, and unemployment metrics are based a series of questions that Gallup asks daily of a nationally representative sample of 1,000 adults, aged 18 and older. Results are reported daily and monthly, based on approximately 29,000 interviews, including approximately 18,000 in the workforce. Daily results reflect 30-day rolling averages.
When the 4 week average falls, like it did a few months ago, it’s meaningful and the best real time high frequency indicator of employment.
When it rises it isn’t (just saying):
Highlights
Initial jobless claims fell 15,000 in the January 4 holiday week to 330,000, which is 1,000 below the Econoday consensus. But in an offset, the prior week is now revised 6,000 higher to 345,000. Though the 4-week average is down a sharp 9,750 to 349,000, it is still trending nearly 20,000 higher than the month-ago comparison.
Continuing claims, reported with a 1-week lag, are also trending higher, up 50,000 in the December 28 week to 2.865 million. The 4-week average of 2.872 million is more than 75,000 higher than the month-ago comparison. The unemployment rate for insured workers, which held at a recovery low of 2.1 percent through most of November, is at 2.2 percent for a 4th straight week.
Led by yesterday’s ADP estimate, most indications on the job market improved sharply in December but not jobless claims. Yet claims this time of year are notoriously hard to read, the result of shortened weeks and exaggerated effects from seasonal adjustments.