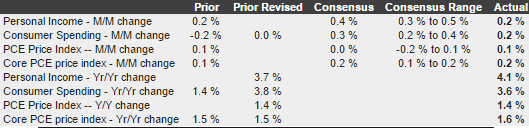
Remember, this is their forecast for Friday, not hard data from their subscribers:
ADP Employment Report

Highlights
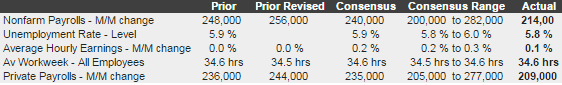
ADP’s estimate for private payroll growth for November is 208,000 vs the Econoday consensus for 225,000 and against a revised 233,000 for October. The corresponding Econoday consensus for Friday’s jobs report from the government is 225,000 vs October’s 209,000.
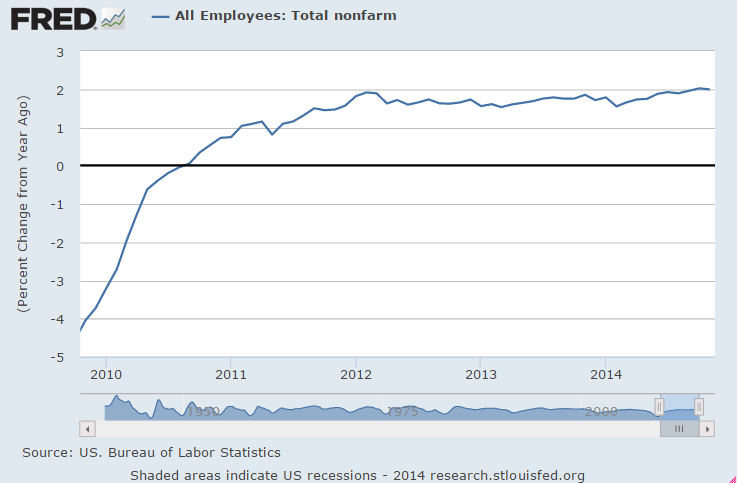
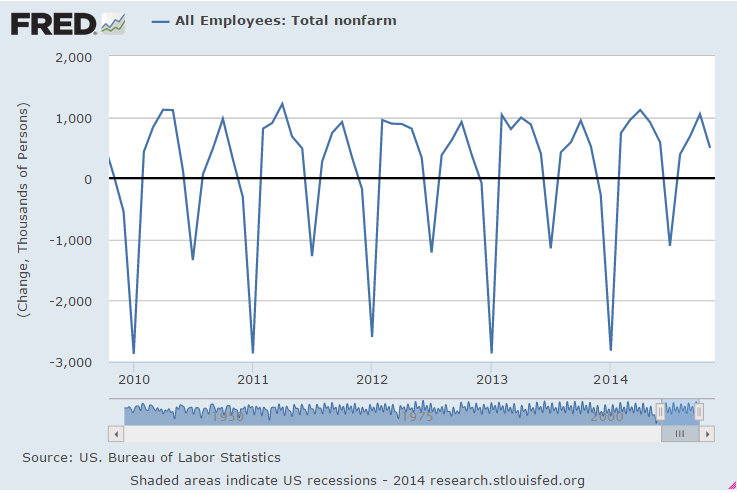
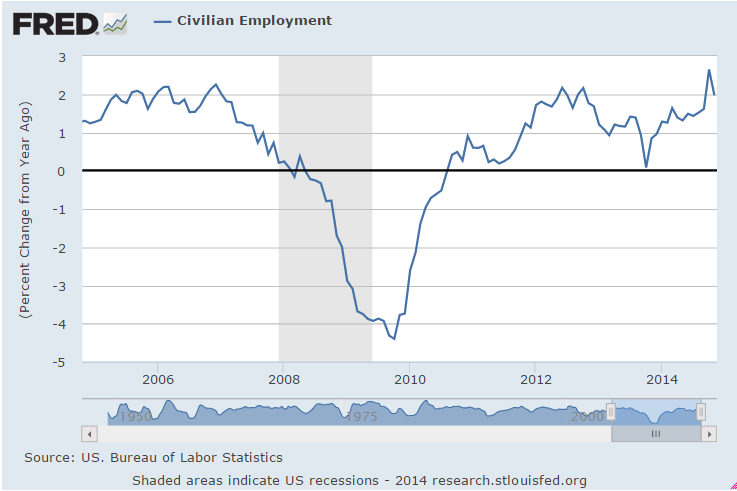
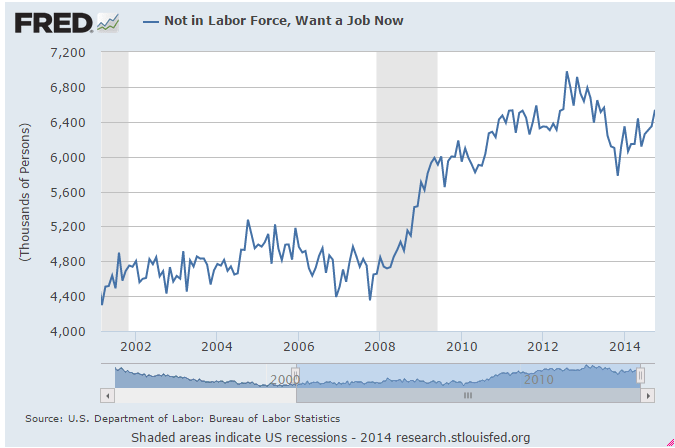
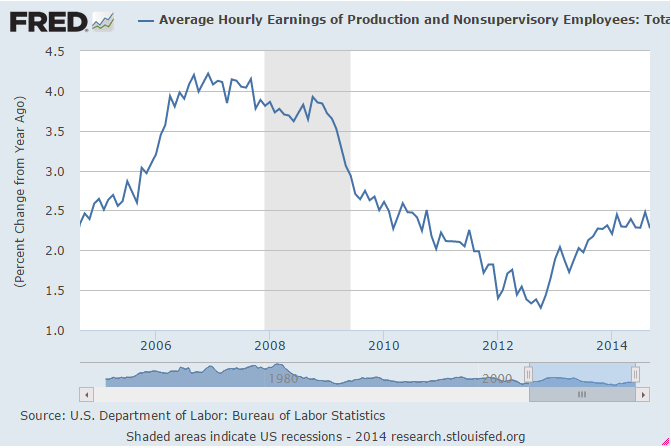
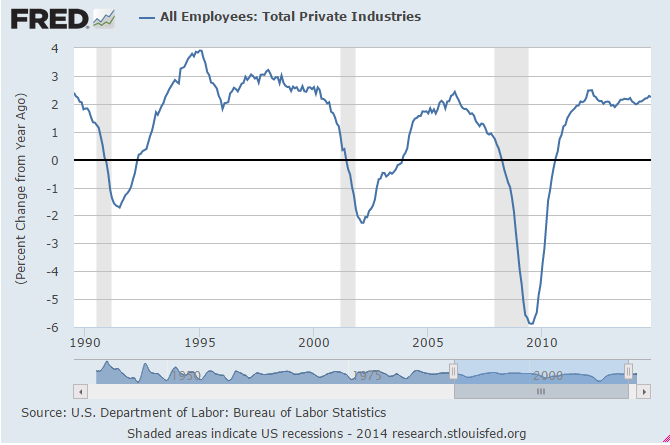
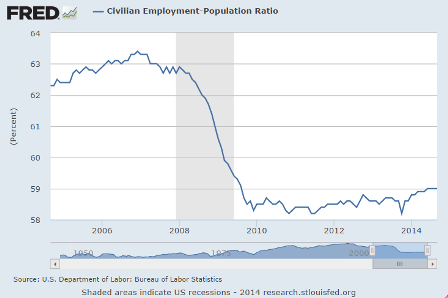
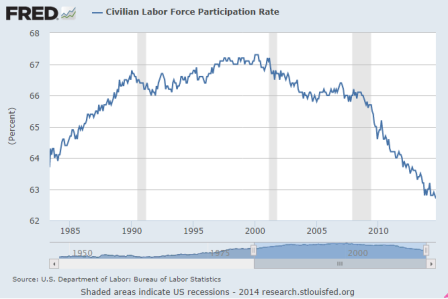
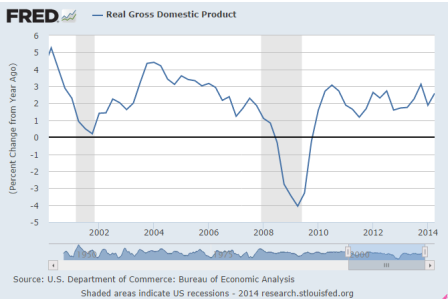
Both ADP and the BLS data have shown new jobs working their way lower after peaking earlier in the year after dipping for the cold winter and at the same time absorbing some of the 1.2 million who lost benefits at year end and subsequently took menial jobs:
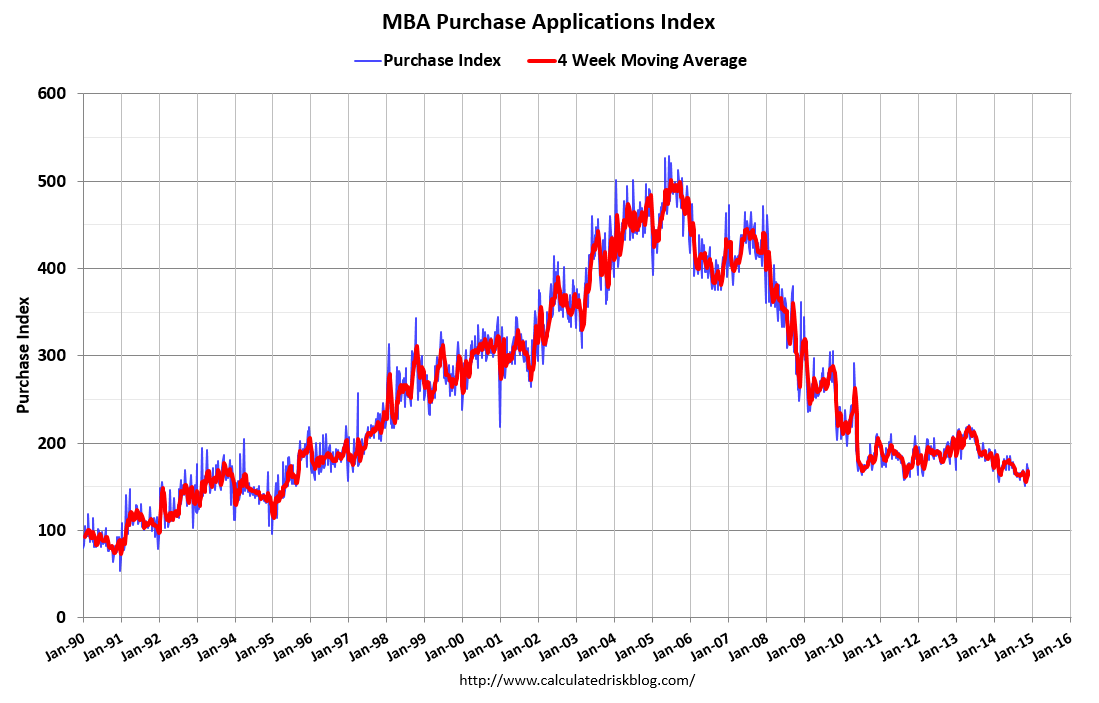
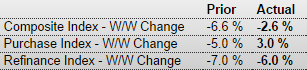
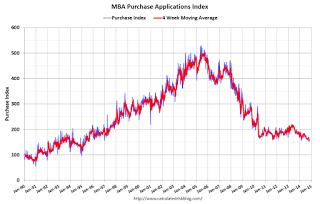
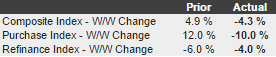
Mtg purchase apps still down year over year and moving sideways at best:
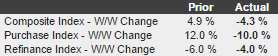
MBA Purchase Applications
Highlights
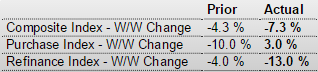
The purchase index snapped back in the holiday shortened November 28 week, rising 3.0 percent after falling 10.0 percent in the prior week. The gain helped the year-on-year reading which improved to minus 4.0 percent from minus 10.0 percent. The refinance index, however, continues its long run in negative trend, down a steep 13.0 percent for a sixth straight decline. Rates were mostly lower in the week with the average 30-year mortgage for conforming loans ($417,000 or less) down 7 basis points in the week to 4.08 percent.
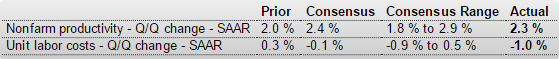
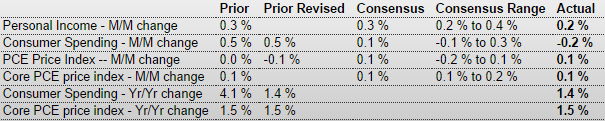
The decline in unit labor costs might be of interest to the Fed:
Productivity and Costs
Highlights
Nonfarm productivity growth for the third quarter was revised up to an annualized 2.3 percent from the first estimate of 2.0 percent and following a 2.9 percent boost in the second quarter. Unit labor costs were revised down notably to minus 1.0 percent from a first estimate of up 0.3 percent after falling an annualized 3.7 percent in the second quarter.
Output growth slowed to 4.9 percent in the third quarter, following a 5.5 percent jump the prior quarter. Compensation growth in the third quarter was up 1.3 percent annualized after a dip of 0.9 percent the previous period.
Year-on-year, productivity was up 1.0 percent in the third quarter, down from 1.3 percent in the second quarter. Year-ago unit labor costs were up 1.2 percent, compared to up 0.7 percent in the second quarter.
The latest productivity report points to positive company profits and mild gains in consumer income.
Good news on the ISM survey, though the employment index fell:
ISM Non-Mfg Index

Highlights
ISM’s non-manufacturing sample reports very solid conditions, at a composite 59.3 in November vs 57.1 in October. Aside from August’s 59.6, November is a recovery high going back more than 9 years. New orders are very strong, up 2.3 points in the month to 61.4 with backlog orders up 4.0 points to 55.5 in a reading last matched in April 2011. Strength in orders is keeping up business activity which rose 4.4 points to a very strong 64.4. Employment remains solid but did slow 2.9 points from October’s near record of 59.6. Deliveries slowed noticeably, which is another sign of strength, while inventories rose. Pressures on input prices rose a bit to 54.4 which, however, is still benign for this reading. A look at industries shows the retail sector at top, which of course is very good news going into the holidays, and construction right behind which is also very good news. This report points to solid year-end acceleration for the economy.
Meanwhile, the oil drilling slowdown might be on the high side of expectations:
By Kristin Hays
Dec 2 (Reuters) — Plunging oil prices sparked a drop of almost 40 percent in new well permits issued across the United States in November, in a sudden pause in the growth of the U.S. shale oil and gas boom that started around 2007.
Data provided exclusively to Reuters on Tuesday by industry data firm Drilling Info Inc showed 4,520 new well permits were approved last month, down from 7,227 in October.
The pullback was a “very quick response” to U.S. crude prices, which settled on Tuesday at $66.88 CLc1, said Allen Gilmer, chief executive officer of Drilling Info.
New permits, which indicate what drilling rigs will be doing 60-90 days in the future, showed steep declines for the first time this year across the top three U.S. onshore fields: the Permian Basin and Eagle Ford in Texas and North Dakota’s Bakken shale.
The Permian Basin in West Texas and New Mexico showed a 38 percent decline in new oil and gas well permits last month, while the Eagle Ford and Bakken permit counts fell 28 percent and 29 percent, respectively, the data showed.


