Trade, factory orders, rail traffic, Japan PMI

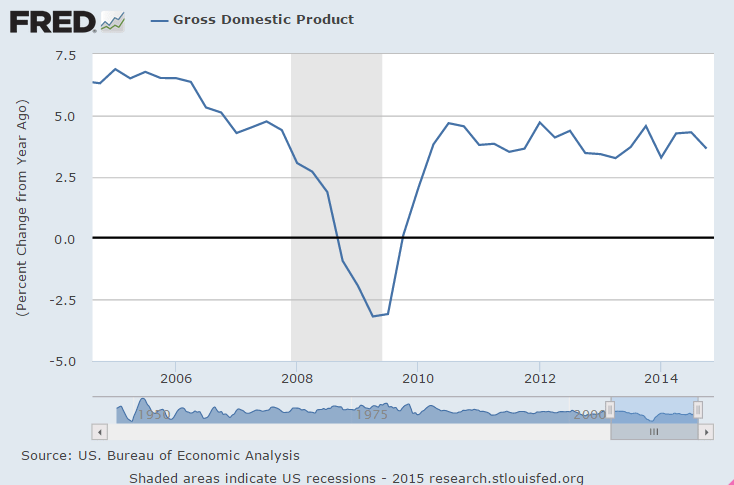
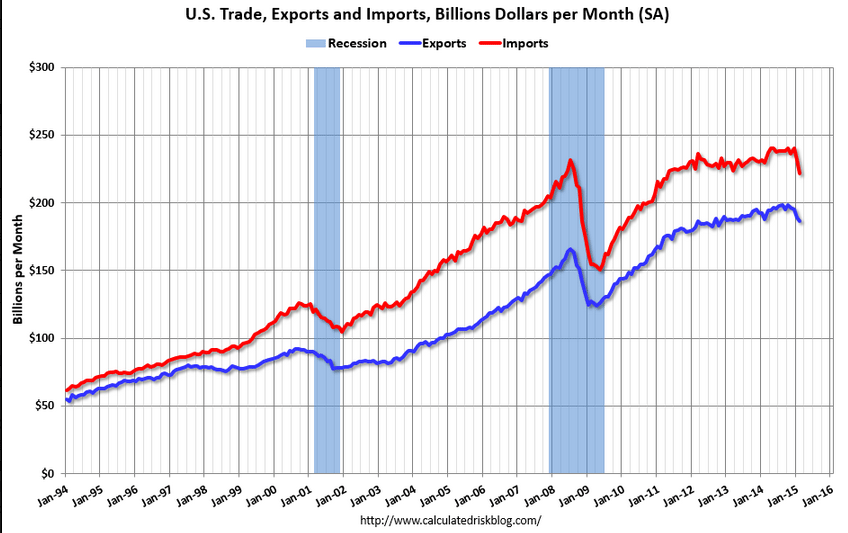
Imports and exports both down.

Note the last two time this happened in any magnitude sort of match up to the last two recessions:

us-trade-exp-imp
us-trade-def

February 2015 Trade Data Shows a Mixed Picture of the Economy

By Steven Hansen

Written by Steven Hansen

A quick recap to the trade data released today shows a mixed picture. The unadjusted value of export three month rolling averages accelerating month-over-month, while imports decelerated. Many care about the trade balance (which was better than last month and well above expectations), but trade balance simply has little correlation to economic activity. Likely much of the soft data is due to the West Coast ports labor issues.
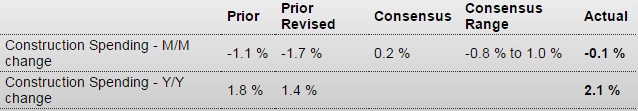
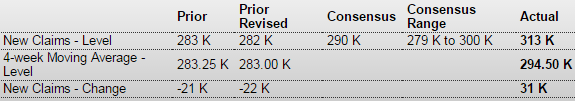
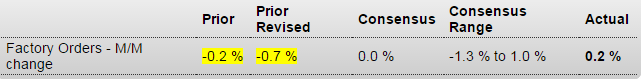
Factory Orders
factory-orders-feb-table
After 6 straight declines, factory orders finally moved to the plus column, up 0.2 percent in a February gain, however, that is tied largely to an upward price swing for petroleum and coal products. Another mitigating factor is a sharp downward revision to January orders, to minus 0.7 percent from minus 0.2 percent.

Durable goods show broad weakness with orders down 1.4 percent in data initially posted last week. Most readings show significant declines and underscore this morning’s export dip in the international trade report and the Fed’s concerns over weak export markets and the negative effects of the strong dollar. Core capital goods are down 1.1 percent in the month for a 6th straight decline in a reading that points to a lack of business confidence and business investment.

Total shipments bounced back 0.7 percent in February but follow a 2.3 percent plunge in January and which holds down factory contribution to first-quarter GDP. A clear negative is a 3rd straight decline for unfilled orders, down 0.5 percent for what is now the weakest string since way back in the recession days of late 2009. A lack of unfilled orders will not encourage manufacturers to add to their workforces. One positive is inventories which are less heavy, up only 0.1 percent and bringing down the inventory-to-shipments ratio to 1.35 from January’s recovery high of 1.36.

The main positive in today’s report is the non-durables component where a 1.8 percent gain ends 7 straight declines, declines all tied to oil-price effects. But the weakness in durables, tied to foreign demand, is becoming a significant negative for the economic outlook.
factory-orders-feb-graph

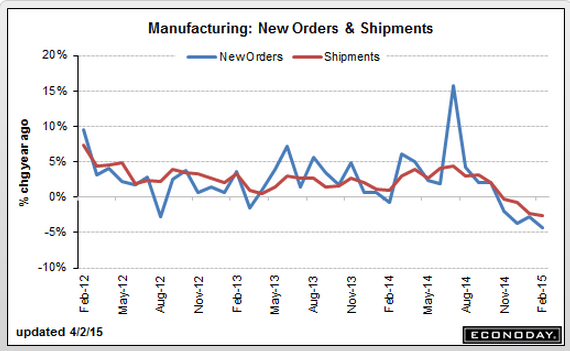
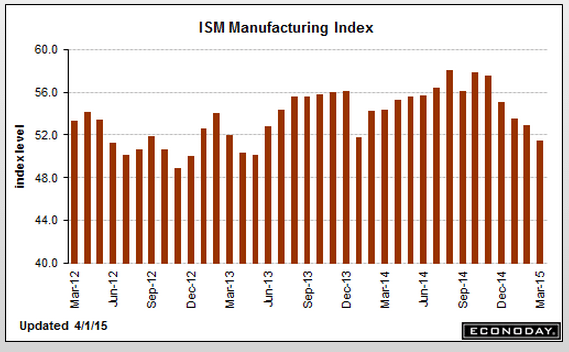
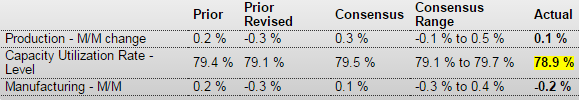
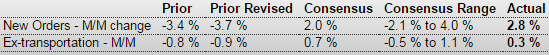
February 2015 Manufacturing Mixed. Rolling Averages Remain in Contraction.

By Steven Hansen

US Census says manufacturing new orders improved. Our analysis agrees – and even the headline year-over-year growth declined from last month. The data has been soft for a half a year. Consider that this data is noisy – and the rolling averages (which include transport) remain in contraction territory. Unfilled orders are shrinking (year-over-year). Transport was soft this month.

Rail Week Ending 28 March 2015: Month Ends with Contraction Year-over-Year

Econintersect — Week 12 of 2015 shows same week total rail traffic (from same week one year ago) again declined according to the Association of American Railroads (AAR) traffic data. Intermodal traffic, which accounts for half of movements, is now strongly growing year-over-year – but weekly railcar counts remain in contraction. Rail traffic is surprisingly weak.

jn-pmi-mar
Highlights
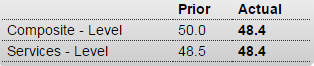
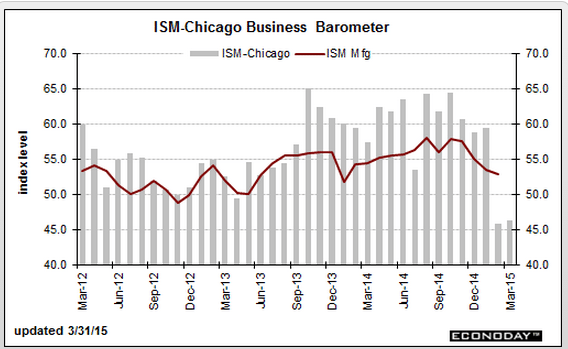
The March business activity index reading was below the crucial 50 no change mark for a second consecutive month, signaling deterioration of the service sector. The reading was 48.4. New orders stagnated with service providers continuing to reduce their staffing numbers albeit at a slight pace. Meanwhile, cost pressures were evident, as purchasing costs increased and at a faster rate than the previous month. Although only moderate, the rate of contraction was faster than the average since the higher sales tax was implemented in April 2014.

Panelists mentioned a slowdown in sales volumes and a fall in contracts leading to the latest decline in activity. Meanwhile, latest data highlighted a weaker improvement of output in the Japanese manufacturing sector. The composite output index posted at 48.4, indicating a slight contraction in overall activity.

Car sales, mortgage purchase apps, ADP jobs, ISM manufacturing, construction spending

U.S. Light Vehicle Sales increase to 17.05 million annual rate in March

By Bill McBride

​U.S. auto sales hit a speed bump in March

April 1 — DETROIT – U.S. car buyers tapped the brakes in March, a sign of a long-expected slowdown in the blistering pace of sales.

March sales were expected to be flat compared with last March. Car-buying site TrueCar.com predicted total U.S. sales of 1.5 million vehicles in March, down less than 1 percent from a year ago. It was the first monthly decline since September 2013.

But not every company saw declines. Hyundai’s U.S. sales jumped 12 percent over last March after a big boost in incentives. Subaru’s sales were up 10 percent. Toyota’s (TM) sales were up 5 percent, and FCA (FCAU) — the parent of Chrysler and Fiat — said its sales rose 2 percent.

However, those gains were offset by lower sales at other major automakers. General Motors’ (GM) sales fell 2 percent, and Ford (F) and Nissan (NSANY) both saw 3 percent declines. Honda’s (HMC) sales were down 5 percent. Volkswagen’s (VLKAY) sales plummeted 18 percent.

For the most part, March didn’t see the kind of big increases the industry has gotten used to. U.S. auto sales were up 14 percent in January, for example, and 5 percent in February.

Mtg purchase apps up 8% vs last year, though still very low absolute level.
We’ll see if it’s a case of cash buyers being replaced or net new purchases
as sales reports surface:

MBA Mortgage Applications
mba-3-27-table
Highlights
Signs of life are suddenly appearing across a host of housing data including mortgage activity which is up sharply for a second straight week. Purchase applications rose 6.0 percent in the March 27 week with refinancing up 4.0 percent. Rates are low with the average 30-year mortgage for conforming loans ($417,000 or less) down 1 basis point in the week to an average 3.89 percent.
mba-3-27-graph

The chart looks like tomorrows jobs report is overdue to converge:

ADP Employment Report
adp-march-table
Highlights
ADP’s data are very soft, at 189,000 in March vs the Econoday consensus of 230,000 and vs a consensus of 240,000 for private payroll growth in Friday’s employment report. And ADP’s data for February tracked much lower than the government’s data, at a revised 214,000 vs 288,000 for the government. ADP doesn’t always track well with the government’s data but today’s data, which are unusually soft relative to expectations, will nevertheless weigh on expectations for Friday’s employment report.
adp-march-graph

This chart is also retreat, and note the weakness in exports:

ISM Mfg Index
ism-mfg-march-table
Highlights
Weak exports are pulling down ISM’s manufacturing sample whose index fell 1.4 points to 51.5. This is below what was a soft consensus forecast of 52.5 and is the lowest reading since May 2013.

New orders fell 7 tenths to 51.8 for its lowest reading since April 2013. New export orders are in contraction for a 3rd straight month, down 1.0 point to 47.5 for their lowest reading since November 2012.

There was no net hiring in ISM’s sample during March with the employment index at 50.0 which is the lowest reading since May 2013. Prices paid, at 39.0, remains in contraction for a 5th straight month.

This report points to another month of trouble for government data on manufacturing, a sector that, due to weak foreign demand, appears to be pulling down the nation’s growth.
ism-mfg-march-graph

Construction Spending
construction-spending-feb-table
Highlights
Construction spending unexpectedly dipped 0.1 percent in February after falling 1.7 percent in January. Market expectations were for a 0.2 percent increase.

February’s decrease was led by public outlays which dropped 0.8 percent. Private nonresidential construction spending rebounded 0.5 percent. Private residential spending slipped 0.2 percent.

On a year-ago basis, total outlays were up 2.1 percent in February compared to 1.4 percent in January.
construction-spending-feb-graph

Redbook retail sales, Case-Shiller HPI, Chicago PMI, Consumer Confidence, small business borrowing

Growth still depressed, even vs last year’s winter weakness:

redbook-3-31

Same here:

S&P Case-Shiller HPI
sp-jan-table
Highlights
Home prices are firming as the Case-Shiller composite-20 index rose 0.9 percent in January following a 0.9 percent gain in December and a 0.8 percent rise in November. This is the strongest streak for this report since late 2013. Year-on-year, however, prices are still on the soft side, up only 4.6 in January and only fractionally higher than the prior two months.
sp-jan-graph

Bad here too:

Chicago PMI
chicago-pmi-mar
Highlights
Companies sampled in the Chicago PMI report continue to report a lull in activity, at a sub-50 March index of 46.3 following 45.8 in February. On a quarterly basis, the index averaged only 50.5 in the first quarter, down steeply from 61.3 in the fourth quarter for the weakest reading since the third quarter of 2009. Respondents are citing bad weather and fallout from the West Coast port slowdown as temporary negatives, and they see orders picking up during the second quarter. Though the Chicago report, which covers both the manufacturing and non-manufacturing sectors, is often volatile, the last two months of sub-50 readings do confirm other indications of first-quarter weakness for the nation’s economy as a whole. The Dow is moving to opening lows following today’s report.
ism-chicago-graph

Consumer confidence is up even as retail sales growth plummets:

consumer-conf-mar

U.S. small-business borrowing slips in February, up on year: PayNet

By Elvina Nawaguna

March 31 (Reuters) — The Thomson Reuters/PayNet Small Business Lending Index fell to 119.2 last month from 122.4 in January. Still, the index was up 7 percent from February 2014. The index gauges borrowing by firms with $1 million or less in outstanding debt. An increase of 1 percent to 2 percent indicates businesses are borrowing to replace worn out assets, PayNet founder and President Bill Phelan said. Higher readings signal that firms are investing more to increase their production of goods and services. Small businesses account for nearly half of US GDP.

trade anecdotes, CPI, FHFA House Price Index, New home sales, Richmond Fed, PMI

It’s the net exports, paid for by non residents selling their currency to buy euro to spend, that drives up the euro until the net exports cease and trade goes negative. And with the rigidities/J curve/etc. the move up could be extreme, with the ECB unable to dampen it due to ideological restrictions on fx purchases.

German private sector output increases at strongest rate in eight months

March 24 (Markit) — German private sector output increases at strongest rate in eight months () Germany Composite Output Index at 55.3 (53.8 in February), Services Activity Index at 55.3 (54.7 in February), Manufacturing PMI at 52.4 (51.1 in February), and Manufacturing Output Index at 55.4 (52.2 in February). Survey participants noted that a positive economic environment combined with strengthening demand from both domestic and foreign markets accounted for much of the rise in new orders. Manufacturers reported the sharpest rise in new export business for eight months in March. Panel members partly attributed this to a weaker euro.

And the market of consequence for net exports is the US, where non petro imports continue their strong growth, with the strong dollar demand from portfolio shifting and speculators likewise having driven it to current levels that give the euro zone a cost advantage:

Italian-made version of iconic Jeep goes on sale in US

By Joseph Szczesny

March 23 (AFP) — US off-roaders seeking to rev up the four-wheel drive of a Jeep might soon find out that their American icon is made in Italy.

In a sign of what comes with the takeover of Chrysler by Italian giant Fiat, US auto dealers have begun selling the Italian-made Jeep Renegade.

Brisk exports a plus, but consumption key to full-blown recovery

March 24 (Nikkei) — Brisk exports a plus, but consumption key to full-blown recovery (Nikkei) “Production and exports are picking up,” State Minister for Economic and Fiscal Policy Akira Amari told a press conference. The index for transport equipment — including automobiles — rose 4% on the month, helped by increased shipments to the U.S. and Europe. The index for electronic parts and devices climbed 1.7% amid brisk exports to Asia. The ministry projects that the index for production machinery will drop 0.3% in February and 7.3% in March, and that the index for transport equipment will fall 1.6% and 0.5%.

As expected, still below Fed’s targets:

Consumer Price Index
cpi-feb-table
cpi-feb-graph

Less than expected and looks to still be softening to me:

FHFA House Price Index
fhfa-jan-table
Highlights
House prices continue to rise in January but at a slower pace. FHFA house prices advanced 0.3 percent, following a gain of 0.7 percent in December. Analysts projected a 0.5 percent gain for January. The year-ago rate came in at 5.1 percent, compared to 5.4 percent in December.

Regionally, six Census regions reported gains in January while three declined.
fhfa-jan-graph

Better than expected, and only slightly suspect, and still severely depressed vs prior cycles even as the population has grown:

New Home Sales
new-home-sles-feb-table
Highlights
In a positive jolt out of the housing sector, new home sales picked up sharply in February to a 539,000 annual rate. Adding to the good news is a big upward revision to January, to 500,000 from 481,000. These are the first two 500,000 readings going all the way back to April and May of 2008.

The gain drew down what was already thin supply on the market, to 4.7 months at the current sales rate vs 5.1 and 5.3 months in the prior two reports. The current reading is the lowest since June 2013 and will undoubtedly encourage builders to expand construction. The lack of supply, however, did not lift prices where the median fell a sharp 4.8 percent in the month to $275,500. Sellers, in fact, seem to be giving price concessions with the year-on-year price up only 2.6 percent.

Looking at sales by region shows a big surge in the Northeast where, however, sales levels compared to other regions are very low. Sales in the Midwest, which is also a small region for new home sales, fell sharply in the month as they did in the West, a large region for sales that represents 23 percent of all sales. Sales, however, were very strong in the South, a region that makes up a whopping 59 percent of all sales and where sales are back to where they were in February 2008.
new-home-sales-feb-gaph

Lower than expected and not good:

Richmond Fed Manufacturing Index
richmond-fed-mar
Highlights
March has not been a good month for the Richmond manufacturing sector where the index fell into contraction, to minus 8 vs zero in February. Order readings, both for new orders and backlogs, are down substantially as are shipments and the workweek. Hiring, however, remains respectable, at least for now. Price readings show only the most marginal pressure.

The early signals from the regional manufacturing reports (that is this report together with last week’s Philly Fed and Empire State reports) are all showing weakness in orders, a trend also highlighted by this morning’s PMI flash where weakness in export orders is specifically cited. Just last week, the FOMC underscored weak exports as a major factor holding back economic growth.

PMI Manufacturing Index Flash
pmi-flash-mar
Highlights
The manufacturing sector has gotten off to slow start this year but may have picked up slightly in March, based at least on the PMI flash which is at 55.3, a 5-month high and vs 55.1 in final February and 54.3 in mid-month February. New orders are also at a 5-month high as rising domestic sales offset declining export sales and weak sales out of the oil sector. Output is at a 6-month high and employment at a 4-month high. Input costs are down for a 3rd straight month and output prices are rising at their slowest pace in 3-1/2 years.

The decline in export sales is of special note in this report which cites concerns among respondents that the dollar’s strength against the euro is hurting demand. Last week’s FOMC statement pointed to weak exports as a major factor holding down growth. This report in general has been running noticeably hotter than hard data from the government which have been no better than flat, if that, and which would correspond to a roughly 50 level for the PMI.

Empire State survey, housing market index, Industrial Production

More weakness today, and in sync with my narrative about the lower price of oil
being an unambiguous negative for the US economy:

Empire State Mfg Survey
empire-table-mar
Highlights
General conditions so far in March, at an index of 6.90, remain modestly favorable in the New York State manufacturing sector but order data have been very soft both this quarter and going back to the fourth quarter. New orders are in contraction in the March report, at minus 2.39 which is the second negative reading of the last 6 months, a stretch where this reading has averaged a pitiful plus 2.24. Backlog orders, which are always weak in this report, have been in severe contraction, at minus 13.40 in the March report for a 6-month average of minus 10.75.

Weak orders are not a plus for employment though the March employment index did accelerate substantially, to 18.56 vs 10.11 in February for the best reading since May last year. Yet how long this can hold is in doubt especially given the slowing the last 2 months in the general 6-month outlook. The outlook did rise more than 5 points to 30.72 but the last 2 readings are the weakest since second quarter 2013.

Shipments in March are in the positive column, at 7.93, but are down more than 6 points from February. Shipments were in the high teens and low 20s through much of the second and third quarters last year but, in line with the sagging in orders, have since tailed off to a 6-month average of 7.91. Input costs remain soft as are prices of finished goods which, however, are slightly higher in the latest report.

The Empire State report is the first of the March indicators for the manufacturing sector, to be followed Thursday by the Philly Fed. In general, the manufacturing sector has been misfiring slightly this year, as seen in today’s report. Later this morning at 9:15 a.m. ET, the Federal Reserve will post the industrial production report for February.
empire-v-philly-mar

Housing Market Index
nahb-mar
Highlights
The lack of first-time buyers is an increasing negative for the new home market, evident in the housing market index for March where growth slowed 2 points to an 8-month low of 53. The traffic component of the index again shows particular weakness, down 2 points to 37 which is a 9-month low and directly reflects the lack of first-time buyers.

The other 2 components of the report remain well over 50, at 58 for current sales, which however is down 3 points from February for a 5-month low, and are unchanged for future sales at 59.

Regional composite data show the Midwest out in front at 61 for a striking 13 point surge in the month followed by the largest region, the South which is down 2 points to 54. The West, which is also a very important region for new homes, shows an 11-point decline to 53 with the Northeast, which is by far the least important market for new homes, down 7 points to 39.

Industrial Production
ip=feb
Highlights
The manufacturing sector continues to struggle. Industrial production for February edged up 0.1 percent after declining 0.3 percent in January. Market expectations were for a 0.3 percent gain for February.

Manufacturing dipped 0.2 percent in February after falling 0.3 percent the month before. This was the third consecutive decline for this component. Notably, manufacturing was revised down for January from plus 0.2 percent to minus 0.3 percent. The manufacturing drop for February was worse than analysts’ forecast for a 0.1 percent rise.

The production of durable goods moved down 0.6 percent, with widespread losses among its components, and the production of nondurable goods moved up 0.2 percent. The motor vehicles and parts industry posted a loss of 3.0 percent, the largest decrease among durable goods manufacturers; most other industries moved down more than 0.5 percent. Only the aerospace and miscellaneous transportation equipment industry recorded a significant increase in production, advancing 1.2 percent. Among the major nondurable goods industries, gains in the indexes for textile and product mills, for petroleum and coal products, and for chemicals more than offset losses elsewhere. The production of other manufacturing industries (publishing and logging) moved up 0.5 percent.

Mining dropped 2.5 percent in February after a 1.3 percent decrease the prior month. Utilities surged 7.3 percent after gaining 1.0 percent in January.

Overall capacity utilization slipped to 78.9 percent from 79.1 percent in January.

Softer manufacturing may increase debate at this week’s Fed FOMC meeting on guidance.
ip-feb-graph

GDP, Pending home sales, Chicago ISM, Consumer Sentiment

No ‘surge’ happening and Q1 GDP at risk as well from collapse of oil and gas investment:

GDP Growth Slows to 2.2% in 4Q, revised lower but still better than expected

Latest figures indicate breakout pace of growth in the second and third quarters was unsustainable. The latest figures indicate the breakout 5% pace in the third quarter and 4.6% in the second quarter were unsustainable. For 2014 as a whole, GDP expanded 2.4%, slightly better than the average 2.2% growth of 2010-2013. By comparison, the economy grew an average 3.4% a year during the 1990s. Real personal consumption expenditures increased 4.2% in the 4Q, compared with an increase of 3.2% in the 3Q.

2-27-1
2-27-2
This is nominal GDP (not inflation adjusted):
2-27-3

NAR: Pending Home Sales Rise in January to Highest Level in 18 Months, climbed 1.7% to 104.2 in January from an upwardly revised 102.5 in December and is now 8.4% above January 2014 (96.1). Improved buyer demand at the beginning of 2015 pushed pending home sales in January to their highest level since August 2013. All major regions except for the Midwest saw gains in activity in January. NAR chief economist, says “Contract activity is convincingly up compared to a year ago despite comparable inventory levels,” he said. “The difference this year is the positive factors supporting stronger sales, such as slightly improving credit conditions, more jobs and slower price growth.” “All indications point to modest sales gains as we head into the spring buying season,” “However, the pace will greatly depend on how much upward pressure the impact of low inventory will have on home prices. Appreciation anywhere near double-digits isn’t healthy or sustainable in the current economic environment.” Total existing-homes sales in 2015 are forecast to be around 5.26 million, an increase of 6.4% from 2014. The national median existing-home price for all of this year is expected to increase near 5%. In 2014, existing-home sales declined 2.9% and prices rose 5.7%.

Looks to me like a dip and a recovery before and then after mtg rules were altered in Jan.

With the ‘average’ still near 0:
2-27-4

ISM Chicago Business Barometer At 5½-Year Low, Down 13.6 Points to 45.8 in February.

Production, New Orders, Backlogs Suffer Double Digit Declines.

LA port strike being blamed for some of the decline:
2-27-5

U of M Consumer Sentiment fell to 95,4 in February (final) from 98.1 in January.

Consumer optimism was affected by lower gas prices and an unusually harsh winter. The small overall decline from January still left consumer confidence at the highest levels in eight years

This is one man one vote, not one $ one vote:
2-27-6

Case-Shiller, Consumer confidence, Richmond Fed, pmi services

S&P Case-Shiller HPI
cs-dec
Highlights
Sales of existing homes may be slow but price traction is appearing, at least it did in December as Case-Shiller’s adjusted 20-city index shows a sharp month-on-month gain of 0.9 percent. This is the strongest monthly gain since March last year. Year-on-year growth, which had been slowing from the low double digits this time last year, is now leveling, at plus 4.5 percent vs November’s 4.3 percent which is the first gain for this reading since way back in November 2013.

Consumer Confidence
cc-feb
cc-feb-graph
Richmond Fed Manufacturing Index
richmond-feb
Recent History Of This Indicator
The Richmond Fed manufacturing index slipped 1 point in January to plus 6. Growth in new orders, at 4, was steady but moderate while the draw in backlog orders picked up, to minus 9 from minus 5. Production, fed by the working down in backlogs, actually accelerated 5 points in the month to plus 10 but this pace can’t be sustained unless new orders pick up.

PMI Services Flash
pmi-services-feb
Highlights
A strong rebound in new work helped give a boost to Markit’s US service sector sample where the index rose to a 4-month high of 57.0. This compares with 54.2 in final January at 54.0 in the January flash.

Hiring is up this month in the sample as are backlogs. The outlook, however, is at a 4-month low, echoing similar weakness in last week’s Empire State and Philly Fed reports out of the manufacturing sector. Price readings remain low but did edge higher from January.

RT interview, UK inflation, retail sales mystery, Greece, Italian trade surplus

Greece must threaten Grexit to get best outcome from Troika

Edward talks to Warren Mosler, chairman of Consulier Engineering on why the EU’s approach to the Greek debt crisis has failed to lift the Greek …

So for decades the BOJ has tried to create inflation and failed, for 7 years the Fed has tried and failed, the ECB has tried and failed, etc. etc. etc. Maybe it’s not so easy for a CB to create inflation? Or impossible…;)

UK inflation hits lowest level since records began

Abe hopes BOJ keeps stimulus to meet inflation goal, upbeat on economy

Feb 16 (Reuters) — Abe hopes BOJ keeps stimulus to meet inflation goal, upbeat on economy (Reuters) Japanese Prime Minister Shinzo Abe said on Monday praised the BOJ’s aggressive stimulus program for helping revive the economy and wipe out the public’s “sticky deflationary mindset.” “I hope the BOJ continues to steadily proceed with bold monetary easing to achieve 2 percent inflation,”

No consideration that the lower prices in the first instance only shift income from sellers of oil to buyers of oil:

Even excluding gas, retail spending was flat last month after ticking down 0.2% in December. The retail restraint is somewhat surprising given that the average household is expected to save hundreds of dollars this year on gas that averaged $2.23 a gallonon Thursday, down from $3.32 a year ago, according to the AAA.

Greece demands a credible growth package:

“No more loans — not until we have a credible plan for growing the economy in order to repay those loans, help the middle class get back on its feet and address the hideous humanitarian crisis.” YV

Italy : Merchandise Trade
it-trade
Highlights
The seasonally adjusted trade balance returned a sizeable E5.1 billion surplus in December following a slightly larger revised E3.8 billion excess in November.

December’s sharp improvement was mainly attributable to a 2.6 percent monthly bounce in exports, their fourth increase in the last five months, which easily more than reversed a 1.1 percent mid-quarter drop. Outside of durable consumer goods all of the major sectors saw solid monthly gains and total exports were up 6.3 percent from their level in December 2013.

However, weak domestic demand and lower oil costs were also once again a factor in the expansion of the black ink. Hence, imports were down 1.6 percent versus December (minus 0.5 percent ex-energy), their third straight month of decline. Compared with a year ago, purchases from overseas were off 1.3 percent.

Having hit a low of E-4.1 billion in March 2011 the turnaround in the Italian trade balance has been sharp and quite steady. Net exports probably provided a useful boost to economic growth last quarter and look likely to play a key role in any sustained upswing in 2015.

Consumer comfort, business inventories

Bloomberg Consumer Comfort Index
inventories-dec
Highlights
According to Bloomberg, consumer confidence declined for a second straight week, interrupting a four-month surge as Americans’ perceptions of their finances and the economy waned.

Business Inventories
bberg-consumer-comfort
Highlights
A mismatch between inventories and sales is appearing in what could be a negative for production and employment. Business inventories rose only 0.1 percent in December but business sales fell a very sharp 0.9 percent for a 3rd straight decline. The inventory-to-sales ratio jumped 2 notches to 1.33 which is the heaviest reading since July 2009.

All 3 components show builds relative to sales especially retailers where inventories of apparel and building materials look heavy. Inventories of autos also look heavy — especially given this morning’s contraction in the auto component of the January retail sales report.