Fed’s Beige Book

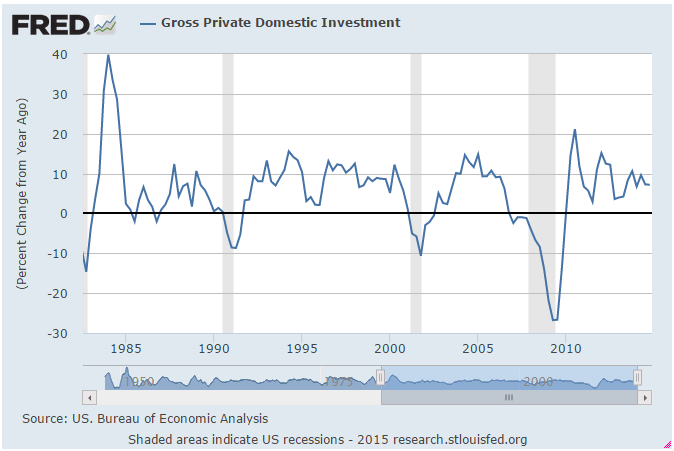
The sharp reduction in oil capex that was driving the economy has predictably shown up first in the oil states like Texas, Oklahoma, North Dakota, etc. Just as these states led on the way up, they are leading on the way down as well, with that weakness working its way to the other regions as the US continues to suffer from a general lack of aggregate demand. Though to a lesser degree, this is similar to the sub prime episode, where that housing expansion led the recovery, driving down the Federal deficit via the automatic fiscal stabilizers (tax revenues and transfer payments) as private sector deficit spending increased and did the heaving lifting. Then when that private sector deficit spending came to an end, sales and jobs collapsed, as the recession unfolded. Same for the .com era expansion and the S and L driven expansion prior to that, etc. Once the deficit spending falls short of the demand leakages the cycle ends.

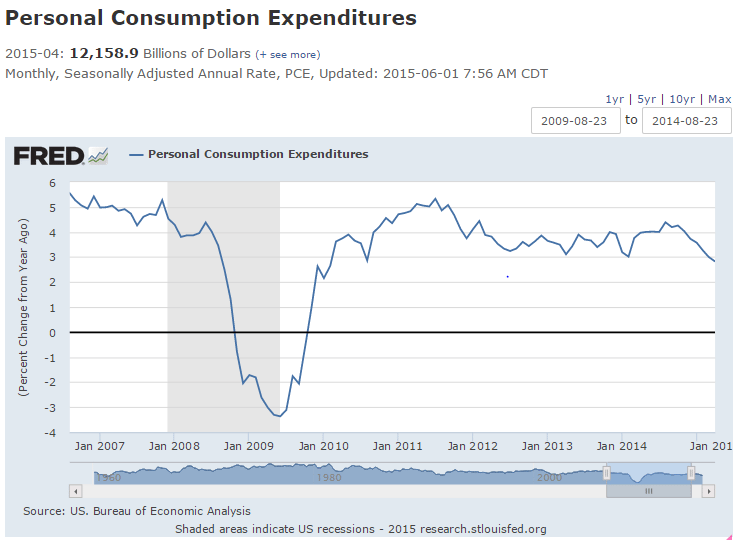
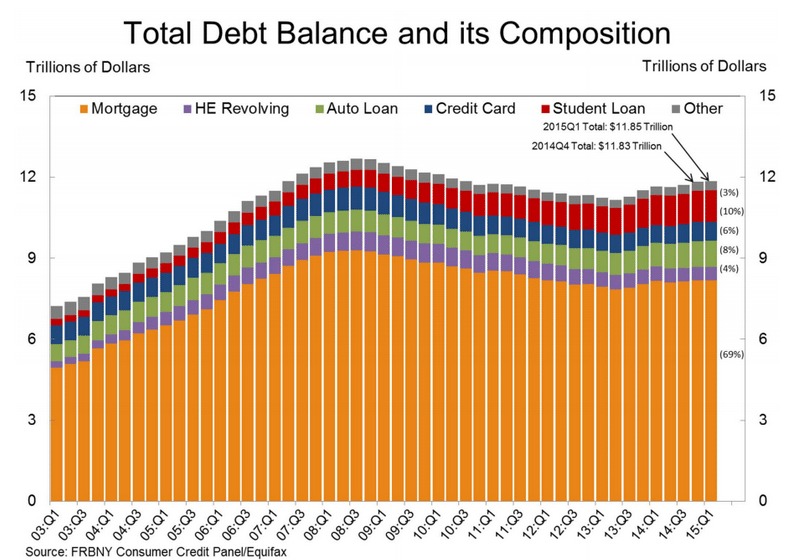
Yes, debt levels are low enough for a consumer debt led rebound, but the private sector tends to be pro cyclical, and we see this happen only on the way up, pro cyclically, and not counter cyclically to rescue a slowdown already in progress.

Also, seems much like they did a few years ago, the Fed has engineered a spike in mortgage rates just as housing was beginning to show some signs of life, though admittedly not much. Traditionally housing has been the source of private sector deficit spending- borrowing to buy houses- but seems this time it isn’t going to happen. Nor are a few car loans going to move the needle, and in any case overall consumer spending growth seems to be fading.

Beige Book

Highlights
The second to last risk for a June rate hike has passed as the Beige Book, prepared by the Fed for its June 16-17 policy meeting, downgrades the strength of the economy slightly. Four of the Fed’s 12 districts are reporting slowing growth from the prior Beige Book, especially Dallas which is being hit hard by the energy sector.

Nevertheless, total employment is up slightly as are wages, but only slightly. Retail sales are also up as are residential and commercial construction. Manufacturing is described as steady with the exception, again, of Dallas and also Kansas City. The service sector is described as growing.

The pace of the nation’s economy is somewhere between moderate and modest with no signs of over heating. The only chance left now for a rate hike at the June meeting is Friday’s employment report which would not only have to show huge gains for May but also major upward revisions for April. The economy is not getting the big second-quarter boost that the hawks expected.

er-6-3-15

macro update

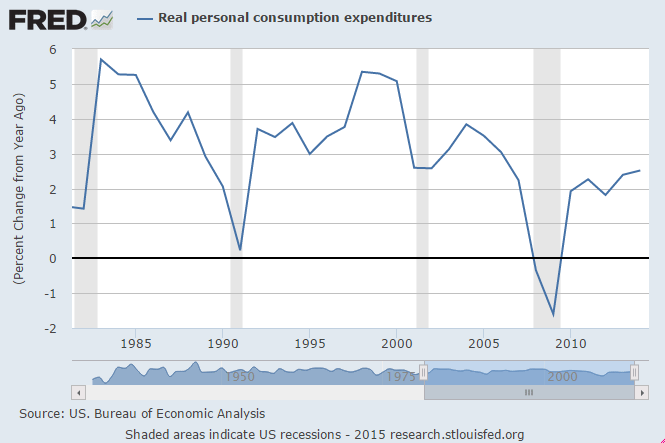
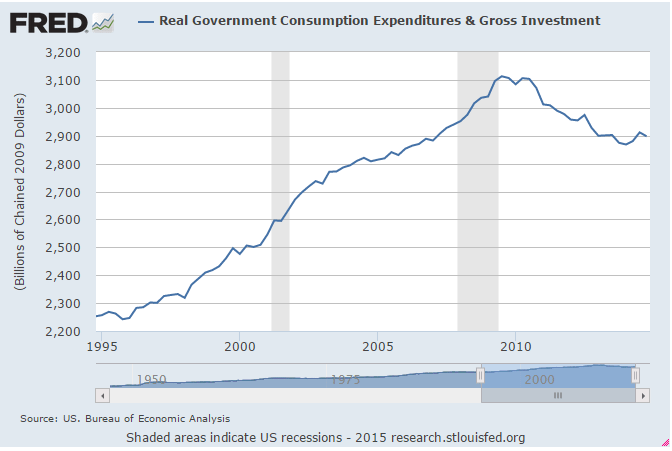
At the beginning of 2013 the US let the FICA tax reduction and some of the Bush tax cuts expire and then in April the sequesters kicked totally some $250 billion of proactive deficit reduction. This cut 2013 growth from what might have been 4% to just over half that, peaking in Q3 and then declining to negative growth in Q1, due to the extremely cold winter. Forecasts were for higher growth in 2014 as the ‘fiscal headwinds’ subsided. GDP did resume after the weather improved, though not enough for 2014 to look much different from 2013. And with the fall in the price of oil in Q4 2014, forecasts for Q1 2015 were raised to about 4% based on the ‘boost to consumers’ from the lower oil prices. Instead, Q1 GDP was -.7%. The winter was on the cold side and the consumer had been saving instead of spending the savings from lower gas prices. And the forecasts for Q2 were for about 4% growth based on a bounce back and consumers now spending their gas savings. Most recently Q2 forecasts have been reduced with the release of Q2 data.

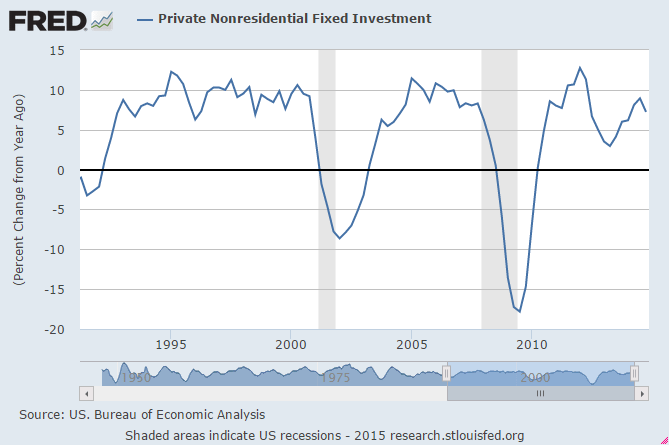
My narrative is that we learned the extent of capex chasing $90 in Q4 after the price fell in half. It seemed to me then that it had been that capex that kept 2013 growth as high as it was and was responsible for the bounce from Q1 2014 as well as the continued positive growth during 2014 up to the time the price of oil dropped and the high priced oil related capex came to a sudden end.

By identity if any agent spend less than his income another must have spent more than his income or the output would not have been sold. So for 2012 the output was sold with govt deficit spending where it had been, and when it was cut by some $250 billion in 2013 some other agent had to increase it’s ‘deficit spending’ (which can be via new debt or via depleting savings) or the output would have been reduced by that amount. Turns out the increase in oil capex was maybe $150 billion for 2013 and again in 2014, best I can tell, and this was sufficient to keep the modest growth going while it lasted. And when it ended in Q4 that spending (plus multipliers) ended as well, as evidenced by the sudden decline in GDP growth. And so far the Q2 numbers don’t look like they’ve increased much, if any, since Q1. And to do so will take an increase in ‘borrowing to spend’ that I can’t detect. Of course, I missed the surge in oil capex last year, so there could be something this year I’m missing as well.

When oil prices dropped I pointed out three things-

1. Income saved by buyers of oil equaled income lost by sellers, so the benefit to total spending was likely to be small and could be negative, depending on propensities to save and to spend on imports. And yes, some of the sellers of oil were ‘non residents’, but that was likely to reduce US exports, and cuts in global capex could reduce US exports as well.

2. Lost capex was a direct loss of GDP, plus multipliers, both domestically and globally.

3. Deflation in general is highly problematic for lenders, and tends to reduce private sector credit expansion in general.

To me this meant the drop in oil prices was an unambiguous negative. And in the face of universal expectations (including the Fed) that it was a positive, which can be further problematic.

Euro Zone

Forecasts are for modestly improving growth largely due to the weak euro driving exports. However, the euro is down from massive foreign CB selling, probably due to fears of ECB policy and the Greek saga. This technical selling drove the euro down and the euro area 19 member current account surplus up, absorbing the euro the portfolios were selling. Once the portfolio selling subsides- which it will as euro reserves are depleted and short positions reach maximums- the trade flows continue, which then drives the euro up until those trade flows reverse. In other words, the euro appreciates until net exports decline and the anticipated GDP growth fades. And there is nothing the ECB can do to stop it, as rate cuts and QE works only to the extent it frightens portfolio managers into selling, etc.

Also, ironically, a Greek default would fundamentally strengthen the euro as Greek bonds are nothing more than euro balances in the ECB system, and a default is a de facto ‘tax’ that reduces the holdings of euro net financial assets in the economy, making euro that much ‘harder to get’ etc.

NFIB chart, NY Fed debt chart, April tax collections

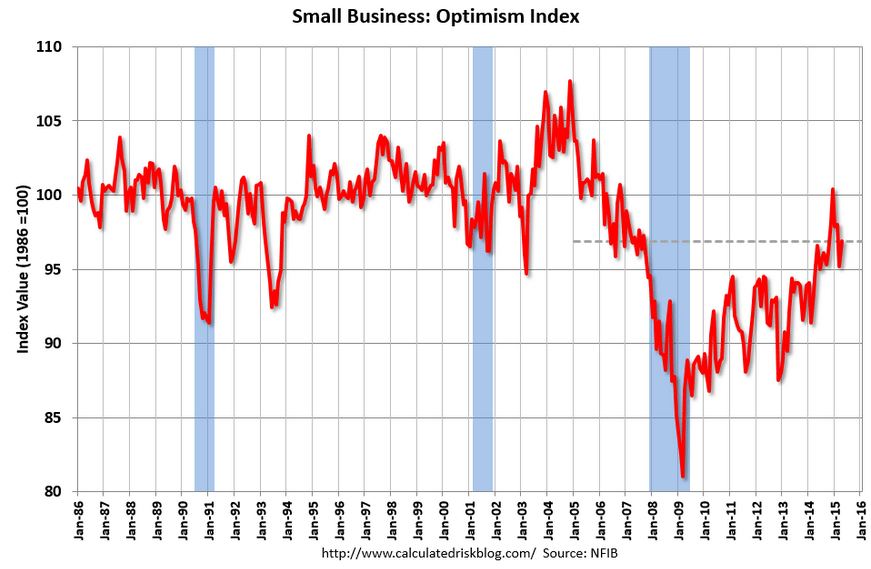
Small increase and still down from year end levels, still very low historically, real sales- what matters most- were down:

er-5-12-5

Small Business Optimism Rises, But Future Sales Cloud Outlook

The Small Business Optimism Index increased 1.7 points from March to 96.9, this in spite of a quarter of virtually no economic growth. Unfortunately, the Index remained below the January reading. Nine of the 10 Index components gained, only real sales expectations were weaker. But this still leaves the Index below its historical average, oscillating between 95 and 98 but never breaking out except for December, when the Index just tipped past 100, only to fall again.

Debt balances not growing:

er-5-12-6

Delinquencies, Foreclosures and Bankruptcies Improve as Household Debt Stays Flat

The Federal Reserve Bank of New York’s Household Debt and Credit Report revealed that aggregate household debt balances were largely flat in the first quarter of 2015. As of the end of March, total household indebtedness was $11.85 trillion, a $24 billion, or 0.2 percent, increase during the first quarter of this year. The report is based on data from the New York Fed’s Consumer Credit Panel, a nationally representative sample drawn from anonymized Equifax credit data.

The slowdown in growth can be attributed to a negligible uptick in mortgage balances, which are the largest component of household debt. Mortgage balances stood at $8.17 trillion in the first quarter. Additionally, balances on home equity lines of credit (HELOC), which were $510 billion at the end of fourth quarter, 2014, were unchanged in the first quarter of this year.

Non-housing debt balances increased by 0.7 percent from the end of last year, largely due to increases in student loans ($32 billion) and auto loans ($13 billion). These gains were partially offset by a $16 billion decline in credit card balances.

I seem to recall something going very wrong after this happened in 2008?

The U.S. budget surplus in April rose to the highest level since 2008 on record revenue as hiring improved during a month when Americans file tax returns.

labor mkt index, ISM services, tax collections, truck sales, lumber

Presumably this means something to the Fed:

Labor Market Conditions Index
labor-market-conditions-mar
Highlights
The Fed’s Board of Governors Research Department’s unofficial report on labor market conditions came in weak for March, dropping to minus 0.3 from plus 2.0 in February. There was no text or detail on the unofficial report but highly likely was weighed down by the March payroll number from the BLS. Odds have gone up for delayed rate hiking by the Fed. The March number was the lowest since minus 2.4 for June 2012. The Fed revises the historical data every month.

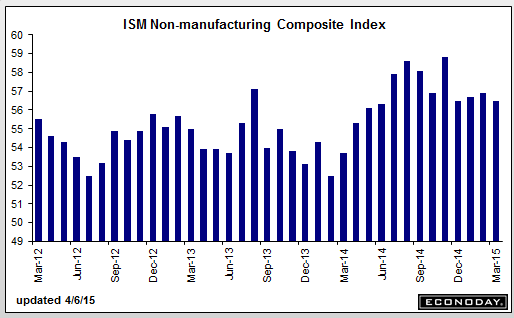
This survey still looks reasonably firm:

ISM Non-Mfg Index
ism-non-man-march
Highlights
The factory sector may be soft right now but not the rest of the economy, based on a very strong PMI services report posted earlier this morning and now the ISM non-manufacturing report where the headline index is at a very healthy 56.5. Strength in new orders, at 57.8, is a key plus in the report as is growth in backlog orders, at 53.5 which is relatively strong for this reading. Employment, at 56.6, is very strong and at a 5-month high.

Breadth of strength is especially encouraging with 14 of 18 industries reporting composite growth in the month led by management services at the top and even including construction which, though the slowest of the 14, is still in the plus column. The 4 industries in the negative column include mining and also education.

Weakness in foreign demand for US goods, the result in part of the strong dollar, is increasing focus on the non-manufacturing economy and the ability of the US consumer to keep up the nation’s economic growth. Right now, with employment trends solid, consumers appear to be doing their share.
ism-non-man-march-graph

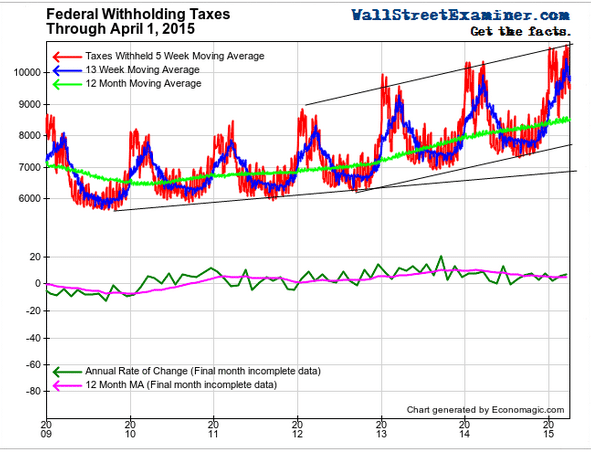
Looks like the govt took a lot of $ out of the economy April 1 indicating taxable income was up:
fed-withholding
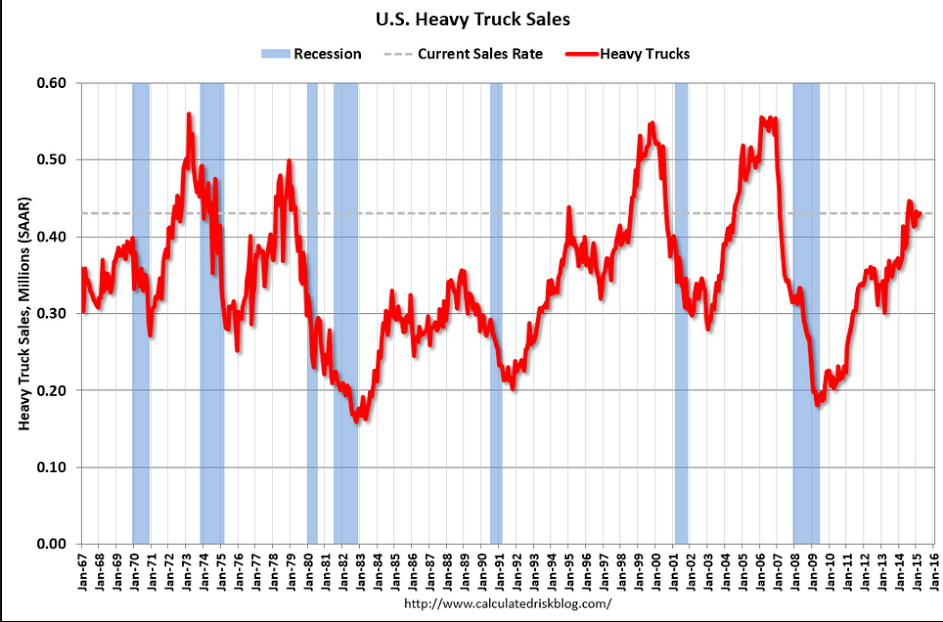
These seem to peak in front of recessions:
us-heavy-trucks-sales
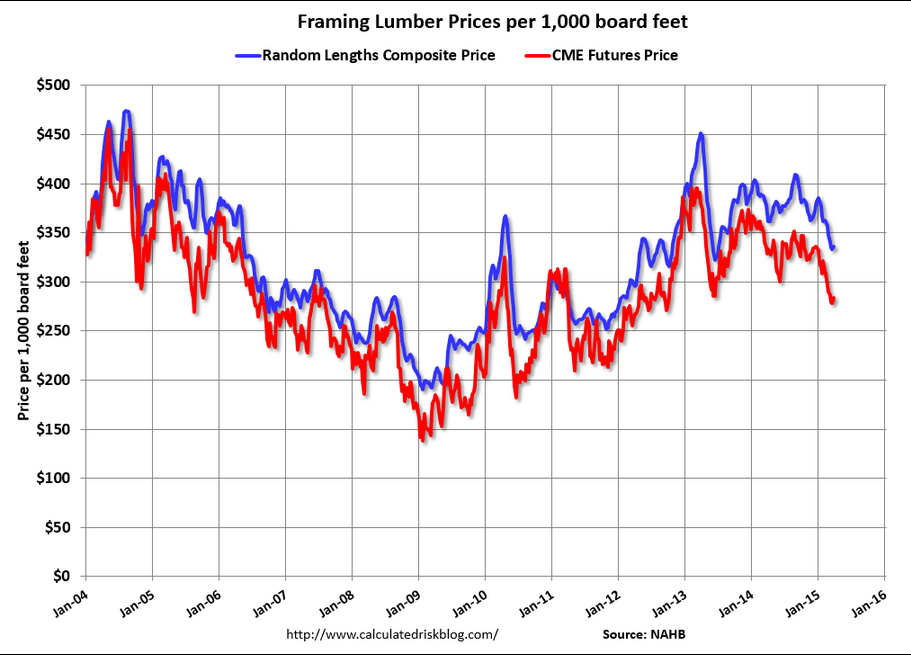
Sort of a housing indicator:
framing-lumber-index

Balanced budget amendment getting closer, consumer credit, Redbook retail sales, JOLTS

the BIG stupid…

Conservative lawmakers weigh bid to call for constitutional convention

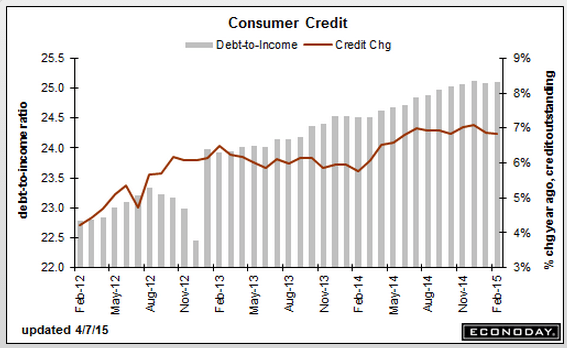
Consumer Credit
consumer-credit-feb-table
Highlights
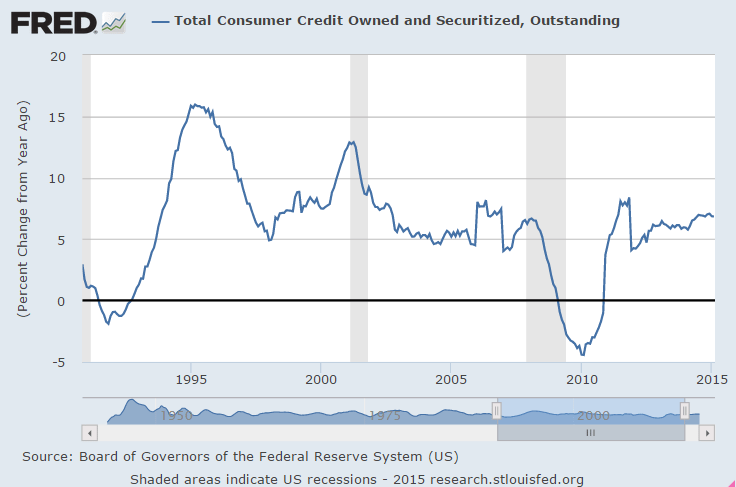
Consumer credit rose a solid looking $15.5 billion in February but a closer look shows an unwanted $3.7 billion decline in revolving credit. This is the 4th decline in 5 months for the revolving component which reflects consumer reluctance to finance purchases with credit-card debt. This reluctance may be a plus for consumer wealth, given the extremely high rates of interest credit-card companies often charge, but it is a definite negative for consumer spending which has been very soft in recent months.

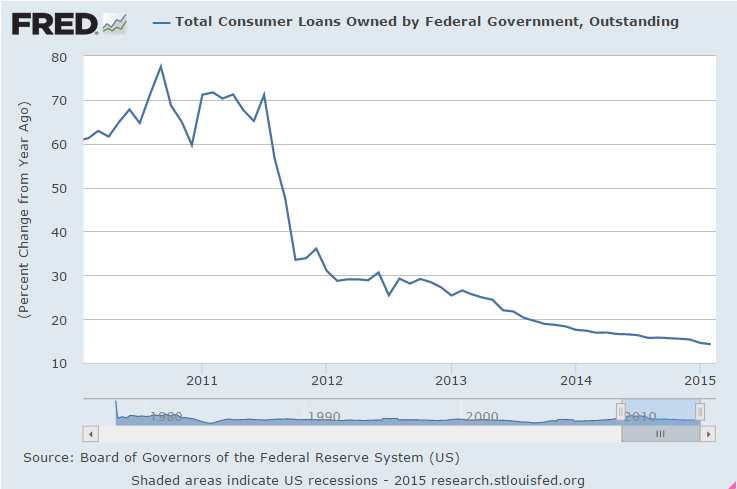
In contrast to revolving credit, non-revolving credit rose $19.2 billion which is the strongest gain since July 2011. The gain does reflect financing for autos but also an item not associated with consumer spending, and that’s the government’s ongoing and heavy acquisition of student loans.

Year over year showing a (modest) decline in growth:

consumer-credit-feb-graph
consumer-credit-feb-graph-2

This is mainly student loans and the growth rate continues to decline:

consumer-credit-feb-graph-3

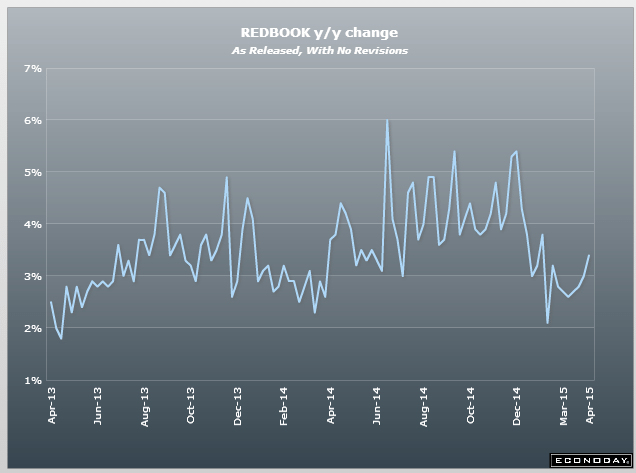
Not much of an Easter boost in retail showing in this chart:

redbook-4-2

This was for Feb and inline with Feb payrolls:

JOLTS
jolts-feb

new from Bernanke

In case there was any doubt…

>   
>   (email exchange)
>   
>   On Mon, Mar 30, 2015 at 11:28 AM, Scott wrote:
>   

New from Bernanke:

Why are interest rates so low?

Bad:
what matters most for the economy is the real, or inflation-adjusted, interest rate (the market, or nominal, interest rate minus the inflation rate). The real interest rate is most relevant for capital investment decisions, for example.

The equilibrium interest rate is the real interest rate consistent with full employment of labor and capital resources, perhaps after some period of adjustment.

Large deficits will tend to increase the equilibrium real rate (again, all else equal), because government borrowing diverts savings away from private investment.

Good:
Contrary to what sometimes seems to be alleged, the Fed cannot somehow withdraw and leave interest rates to be determined by “the markets.”

[the Fed] has no choice but to set the short-term interest rate somewhere.

Credit Check, Fed check

Not much going on this week and not much to concern the Fed?

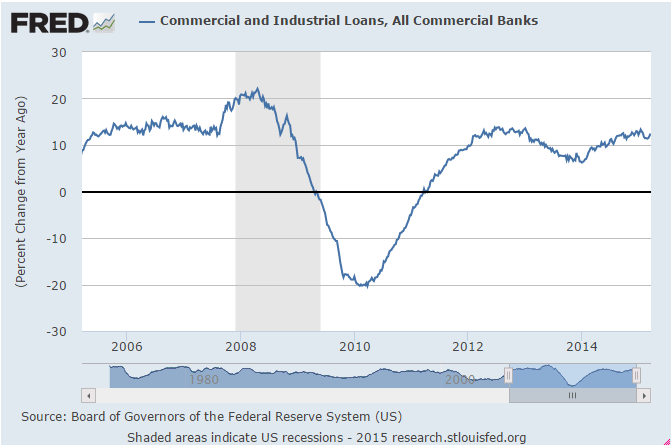
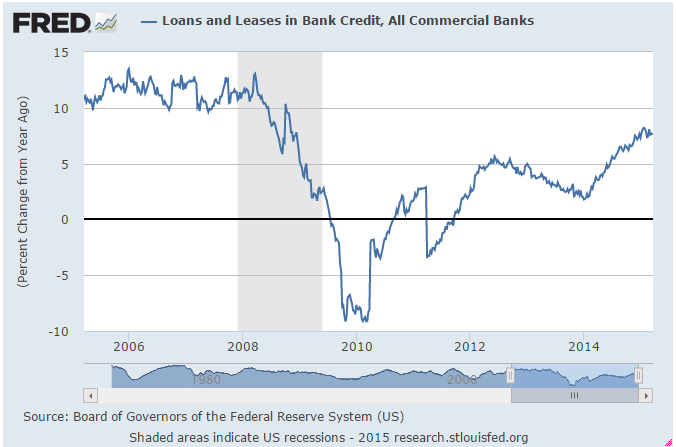
The way they see things, isn’t the point of raising rates to slow credit growth?

Are they thinking 0 rates and QE has caused excessive credit expansion?
;)
cc-fc-1
cc-fc-2
cc-fc-3
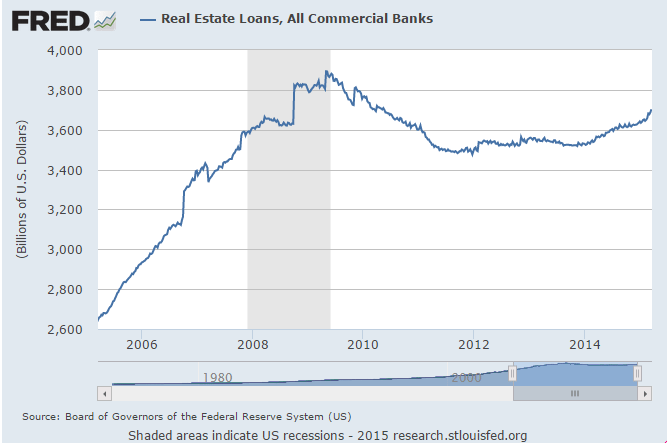
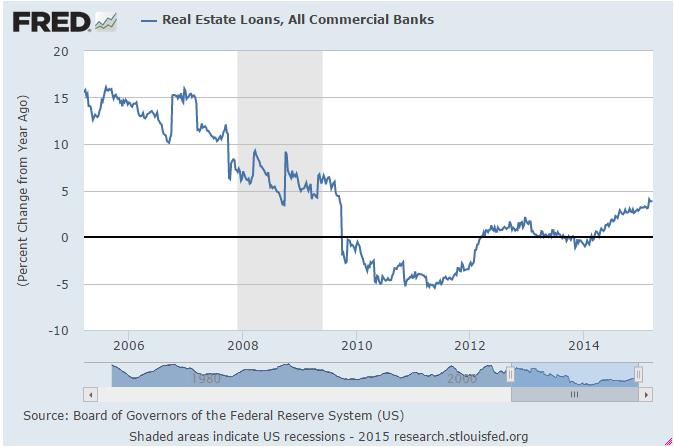
Aha! Real estate related borrowing is picking up a bit- time to slam the brakes on that market!!!??? :(
cc-fc-4
cc-fc-5
Or hike because they think it’s time to slow excessive income growth caused by the low rates?
cc-fc-6
cc-fc-7
Or maybe they think rate hikes will help the dollar that they think is already too strong as our trade deficit grows even as our petroleum bill falls???
cc-fc-8
cc-fc-9
Low rates causing runaway consumer spending???
cc-fc-10
Should have know, 0 rates and QE caused an investment boom!!!??? :(
cc-fc-11
cc-fc-12
Maybe they think they need rate hikes to somehow cool govt spending??? :(
cc-fc-13
Makes me wonder what channels the hawks are watching???

Like Lockart at the Atlanta Fed who’s pushing for rate hikes?
cc-fc-14

mtg purchase apps, architect billings index, oil debt comments, Atlanta Fed GDP forecast

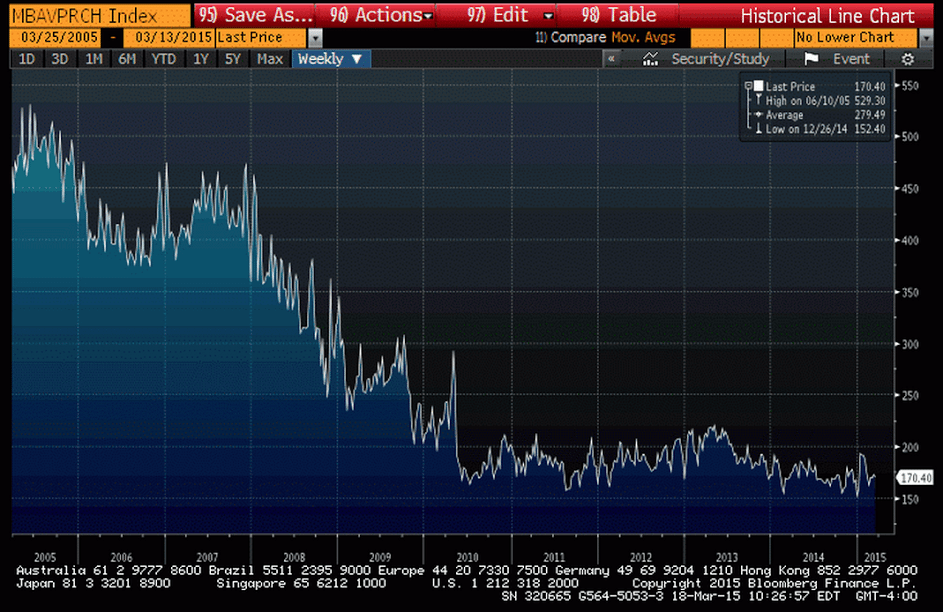
Still no sign of life here:

MBA Mortgage Applications
mba-3-13-table
Highlights
Despite low mortgage rates, demand for mortgage purchase applications continues to be weak, down 2.0 percent in the March 13 week for a year-on-year rate of only plus 1.0 percent. Refinance applications fell 5.0 percent in the week. Rates moved lower in the week with the average 30-year mortgage for conforming loans ($417,000 or less) down 2 basis points to 3.99 percent.
purch-app-index-10yr

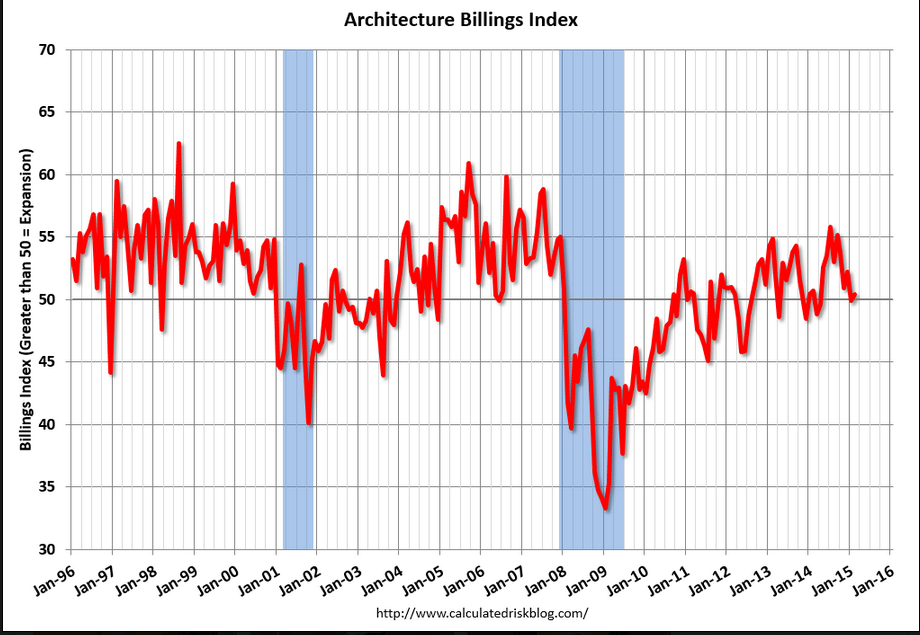
Not looking good here either:

Washington, D.C. – March 18, 2015 – After its first negative score in ten months, the Architecture Billings Index (ABI) showed a nominal increase in design activity in February, and has been positive ten out of the past twelve months. As a leading economic indicator of construction activity, the ABI reflects the approximate nine to twelve month lead time between architecture billings and construction spending. The American Institute of Architects (AIA) reported the February ABI score was 50.4, up slightly from a mark of 49.9 in January. This score reflects a minor increase in design services (any score above 50 indicates an increase in billings). The new projects inquiry index was 56.6, down from a reading of 58.7 the previous month.
abi-feb

More evidence this was the source of credit expansion, now gone, that picked up the slack when taxes were raised and spending cut in 2013. BIS chart on left shows growth of energy sector debt that offset the 2013 tax hikes and spending cuts.

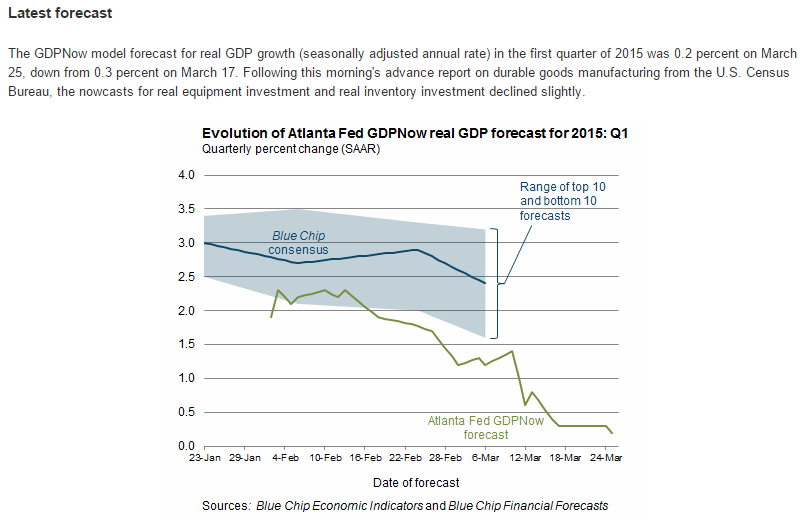
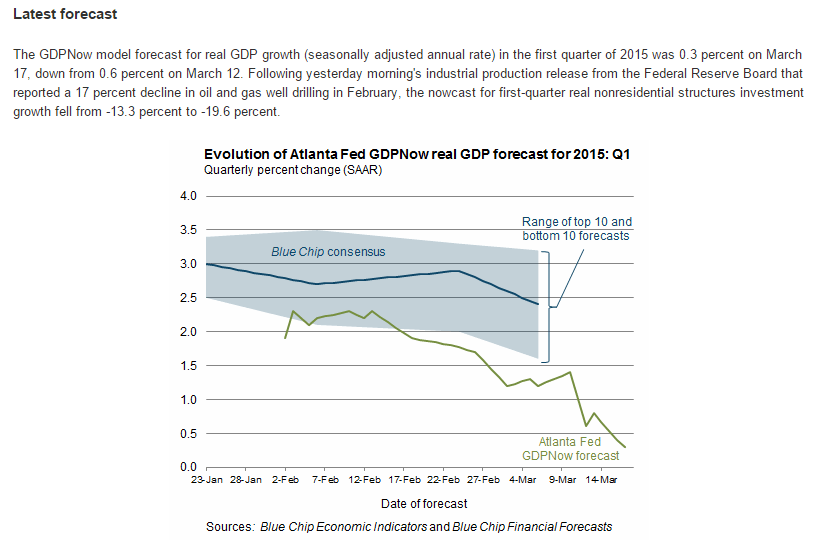
The subsequent cutbacks explains the sudden collapse of US GDP:

Atlanta Fed GDPnow:

atl-qdp-now-3-18

Unless some other agents steps up to spend more than its income GDP growth will not recover, and, as in prior cycles, the ‘automatic fiscal stabilizers’ will do their thing to reduce tax collections and increase transfer payments, thereby increasing the federal deficit in the ensuing slowdown until the deficit gets large enough reverse the downturn and support the next growth cycle.

my comments on comments on the CBO report

STAFF ANALYSIS OF THE CONGRESSIONAL BUDGET OFFICE’S BUDGET AND ECONOMIC OUTLOOK, 2015–2025 “Political differences shouldn’t prevent us from taking bold, decisive action to address America’s dire financial outlook.

Yes, there is an acute shortage of available desired savings as indicated by the slack in the labor market.

Republicans and Democrats agree that being $18 trillion in debt today and facing the prospect of spending more than $800 billion a year on interest payments alone does not lend itself to a prosperous future for our country.

We don’t agree. A prosperous future is not a function of said forecast interest payments.

CBO’s numbers only reinforce this notion.

To the contrary, the inflation forecast and growth forecast together indicate the deficit forecast is far too low-given current institutional structure- to accommodate the nations savings desires, and as a consequence aggregate demand falls short of full employment levels.

The longer we postpone reforms and put off making tough decisions, the deeper the hole we have to climb out of. Let’s not miss the opportunity before us to start down a new path and address our problems head on.”

I agree, the problem of inadequate aggregate demand should be addressed head on, immediately, and decisively with an immediate fiscal expansion- tax cuts and/or spending increases. There is no time to waste as we are sacrificing yet another generation of young Americans on the alter of failed austerity.

– Chairman Mike Enzi “America remains on a financially unsustainable path that threatens the future stability, security, and prosperity of our economy.

The idea of financial sustainability with a non convertible currency, floating exchange rate policy is entirely inapplicable.
What is threatening the future is a deficit that’s far too small to accommodate our savings desires, as evidenced by the low inflation forecast and the low participation rates.

Interest on the debt alone will consume $5.6 trillion of federal spending over the next decade.

This interest is paid routinely by the Fed by simply crediting the appropriate member bank’s reserve account at the Fed.
There are no grandchildren or taxpayers in sight when this routine accounting entry take place.

We have a duty to prevent a clear and present danger, and that means we must take steps now to balance the budget.” – Sen. Jeff Sessions “The new projections released by the CBO should serve as a stark reminder that our country is on an unsustainable economic path. The longer we wait to act, the more difficult it will become to put in place real reforms to control spending and reduce our over $18 trillion national debt.

It is a fact, not theory, that those $18 trillion of net financial assets held by the global economy as ‘savings’ is far less than the desired net savings as evidenced by the unemployment rates and labor participation rates, and an immediate fiscal expansion- lower taxes and/or higher spending- is in order.

This dangerous level of debt remains a drag on the economy and job growth and will only worsen over time if Washington continues to irresponsibly add to the credit card.” – Sen. Mike Crapo “This latest CBO report indicates that we’re headed down an unsustainable path that will put a damper on economic growth and hurt American workers.

Nothing could be further from the truth. When govt cuts taxes and/or increases spending every professional economic forecaster paid to be right increases his GDP estimate and lowers his unemployment forecast.

When a nonpartisan organization like the CBO says that Americans will pay more taxes yet our deficits will rise, something needs to be done.

Yes, we need an immediate tax cut and/or spending increase.

It’s crucial that we get our spending and deficits under control so we can grow our economy and give job creators the certainty they need to expand and hire more workers.” – Sen. Rob Portman “With $18 trillion in debt and the growth of entitlement programs skyrocketing, it is clear the federal government’s current fiscal path is unsustainable. A sluggish economy makes the problem even worse. CBO has warned that this situation could persist if no action is taken.

True! Without an immediate tax cut and/or spending increase the economy will continue to under employ and under pay the American people.

Controlling debt requires making smart choices on spending as well as enacting policies that encourage stronger economic growth.” – Sen. Roger Wicker “I didn’t come to Washington to sit idly by as lawmakers in both parties pretend the deficit is shrinking and that our national debt is not a concern.

True, he came to Washington with no clue as to the functioning of today’s monetary system.

We have a genuine fiscal crisis on our hands. We’re already handing our kids and grandkids a national debt of over $18 trillion and tens of trillions of dollars of unfunded liabilities for entitlement programs. The latest CBO report shows that the deck is stacked to get even worse.

No, in fact their 2% long term inflation forecast is evidence that the built in spending is insufficient to keep the US running at anywhere near full capacity.

We need a sense of urgency to seriously tackle our national debt because of the threat it poses to our economy and national security. As a member of the Budget Committee, I look forward to working with Senate Budget Chairman Mike Enzi and House Budget Chairman Tom Price in the pursuit of a budget that reflects the tough decisions necessary to eliminate wasteful spending, prioritize our resources, and grow the economy.” – Sen. David PerdueSummary CBO projects that the government will collect $3.2 trillion in revenue and spend $3.7 trillion this year, resulting in a deficit of $468 billion in FY 2015 ($15 billion less than recorded in the prior year). Based on current law, CBO projects that the country’s fiscal situation will remain relatively stable for the next few years. After FY 2019, however, CBO projects steadily increasing levels of deficits, debt, and interest payments. By the last year of the budget window, FY 2025, deficits will again surpass the $1 trillion mark, debt held by the public will reach $21.6 trillion, and a single year’s interest payments will total $827 billion.

And the inflation and employment forecasts show that isn’t nearly enough to be adding to savings to support our economy at full employment levels.

According to CBO, federal outlays will total $3.7 trillion in FY 2015, or 20.3 percent of GDP— slightly higher than the 20.1 percent 50-year historical average. Federal outlays are expected to grow to reach $6.1 trillion, or 22.3 percent of GDP by FY 2025, while revenues are expected to remain steady at about 18 percent of GDP. Spending is projected to increase by 2 percentage points of GDP over the budget window. Mandatory spending (primarily Social Security and health care spending) will account for 1.7 percentage points of the increase; net interest costs will contribute another 1.7 percentage points; and discretionary spending will account for a reduction of 1.4 percentage points. CBO projects federal revenues will total $3.2 trillion in FY 2015, or 17.7 percent of GDP—slightly above the 50-year historical average of 17.4 percent. Under current law, total revenues will rise significantly in 2016 to $3.5 billion (18.4 percent of GDP) due mainly to the expiration of business tax provisions that were allowed to lapse at the end of calendar year 2014. After FY 2016, revenue collections will remain steady at approximately 18.1 percent of GDP throughout the duration of the forecast period. In total, over the 10-year budget horizon (FY 2016–2025), CBO expects the federal government will collect $41.7 trillion in revenue. Deficits Over the period FY 2016–2025, annual spending will outpace tax collections by a cumulative total of $7.6 trillion.For the budget year (FY 2016), CBO projects a deficit of $467 billion. Spending will total $3.9 trillion, while revenues total $3.5 trillion. Deficits will begin to climb after FY 2016, reaching $1.1 trillion by FY 2025. Deficits will remain relatively flat at around 2.5 percent of GDP from FY 2015 through FY 2018 (slightly below the 50-year average of 2.7 percent of GDP), then rise steadily to 4 percent of GDP by FY 2025. Debt And Interest CBO projects that debt held by the public will follow a similar path as deficits, remaining relatively stable at about 74 percent of GDP in the near term and then rapidly growing to nearly 79 percent of GDP by FY 2025. In dollar terms, debt held by the public would increase from $13.4 trillion in FY 2015 to $21.6 trillion in FY 2025, a nearly 62 percent increase. CBO notes that while the federal debt increase over the projected window seems modest, it is already high by historical standards—with debt remaining greater relative to GDP than at any other time since the years immediately following World War II.Gross debt, which includes Treasury securities held by federal trust funds, will also continue to rise according to CBO. By the end of FY 2015, CBO projects a gross debt of $18.5 trillion. This number will grow to $27.3 trillion by the end of FY 2025, an increase of 47.7 percent. Gross debt grows less rapidly than public debt because Social Security begins redeeming bonds at a rapid rate toward the end of the projection period.

Yes, and the 2% inflation forecast indicates all of this fall short of providing the savings needed for our economy to sustain full employment.

According to CBO, carrying these high levels of debt has negative consequences for the federal budget and the U.S. economy, including increased government borrowing crowding out private borrowing and leading to increased costs of borrowing for businesses,

That applies only to fixed exchange rate regimes. It is entirely inapplicable to the US with our floating exchange rate policy, as history has clearly demonstrated.

limits to the ability of the government to respond to crises with tax and spending policies,

Any such limit is by political decision, and not an operational constraint with todays floating exchange rate policy.

and increased interest payments.

Yes, which are simply a credit to a member bank account by the Fed.

The federal government is expected to spend $227 billion on interest payments in FY 2015, or about 1.3 percent of GDP. These interest payments will increase to $827 billion (3 percent of GDP) by FY 2025, an increase of 264 percent. These interest costs, a product of continuing to carry such a high debt burden, will put a strain on federal resources and begin to crowd out other priorities.

Interest payments are a matter of the Fed crediting a member bank account. The notion of a strain on federal resources’ is entirely inapplicable. And, in fact, even with those interest payments inflation is forecast at only 2% indicating there is no forecast of excess spending per se.

Enough???