Car sales up

Good news here:

Motor Vehicle Sales
vehicle-sales-table

Highlights
Vehicle sales rose a strong 4.2 percent in November to a 17.2 million unit annual rate which is outside the top end of the Econoday consensus for 17.0 million. Sales of North American-made vehicles proved especially strong, at a 14.0 million rate which is also outside the top-end forecast. Sales of foreign-made vehicles rose to a 3.3 million rate from 3.2 million. Today’s data point to a second straight gain, and an especially strong gain, for the motor vehicle component of the November retail sales report which rose a solid 0.5 percent in October.

dom-vehicle-sales

CEO’s forecast slower growth

This isn’t supposed to be happening…

CEOs: Economic growth will be weak in 2015

By Hailee Lee

Dec 2 (CNBC) — CEOs from major U.S. companies do not expect strong economic growth in 2015.

The Business Roundtable’s fourth-quarter CEO Economic Outlook Index, a composite index of CEO expectations, fell slightly from the third quarter with declines concentrated in capital spending. The index declined to 85.1 for the fourth quarter, compared with 86.4 in the third quarter. A reading of 50 or above indicates economic expansion and below 50, an economic contraction. The long-term forecast is at 80.3.

Gross domestic product in 2015 is expected to grow 2.4 percent, consistent with the CEOs’ 2014 forecast.

Posted in GDP

Crude break evens for drillers, construction spending

If you can buy oil cheaper in the fwd and futures markets why bother to drill for it?
;)

Charts from Citi:
co-be-1

co-be-2

Construction Spending
cs-oct-table
Highlights
Construction outlays rebounded significantly on public outlays and the private residential component. Construction spending jumped 1.1 percent in October after a 0.1 percent dip in September. Market expectations were for a 0.6 percent boost.

October’s increase was led by public outlays which rebounded 2.3 percent after a 1.6 percent fall in September. Private residential spending gained 1.3 percent, following an increase of 0.8 percent the month before.

Private nonresidential construction spending slipped 0.1 percent, following a rise of 0.2 percent in September.

Note that the year over year growth rate is declining, and looks like it isn’t growing as fast this year as last year:

cs-oct

labor force discussion

Note the labor force grew continuously then hit a brick wall with the collapse in aggregate demand in 2008 and has yet to resume it’s prior rate of growth. This has all been attributed to ‘demographics’ by the mainstream:
lf-1

This is the same chart but just for the last year. Note the drop off at the end of 2013 as cold weather hit and subsequent increase through the peak in April when the new jobs report peaked as well.
lf-2

So what’s happened is that most new hires came from ‘new entries’ into the labor force rather than the ‘unemployed’ and unemployment has gone down largely as a function of the growing labor force. The participation rate tells the same story:
lf-3

New jobs peaked in April and have been working their way lower. We’ll see Friday if that continues.
lf-4

Ecri

Because the ECRI forecast a recession a few years ago during a spate of weakness it’s being ignored this time. The difference is, as previously discussed, last time the deficit was running around 9% of GDP, while this time it’s at a recession friendly sub 3% of GDP:

21 November 2014: ECRI’s WLI Improves Marginally But Remains in Contraction

ECRI’s WLI Growth Index improved marginally but has been in negative territory for 6 weeks. This index is forecasting a slight business cycle contraction in 1Q2015. Obviously the markets do not share ECRI’s view the business cycle is taking a downturn.

personal income and consumption charts and comments, and a word on oil

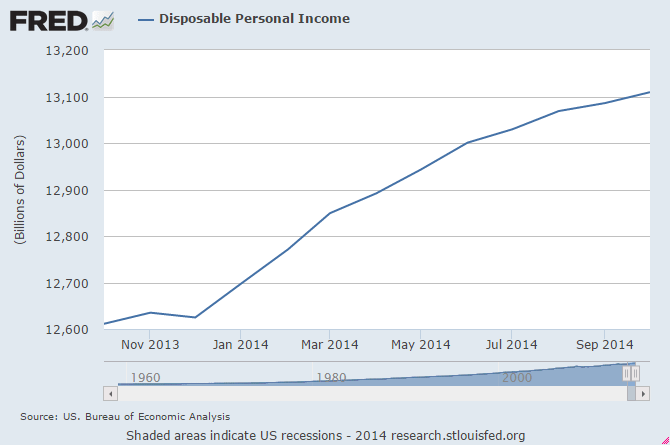
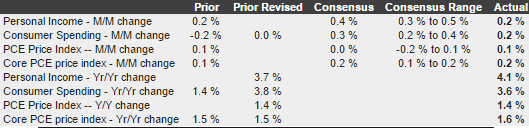
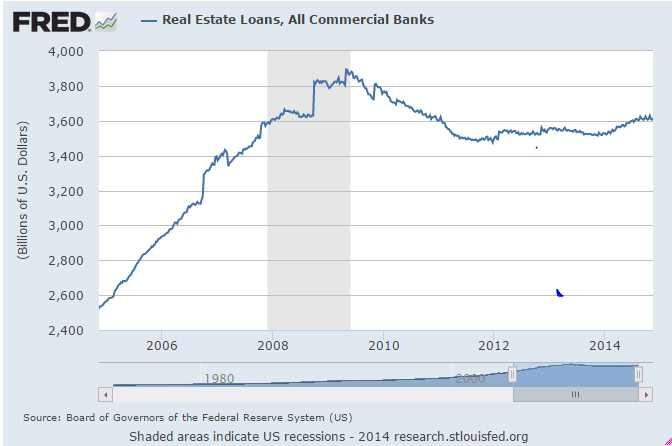
This is after tax personal income not adjusted for inflation. Note that there was anticipation of an acceleration from the first quarter, but now it looks like the growth has slowed and rolled over:

11-28-1

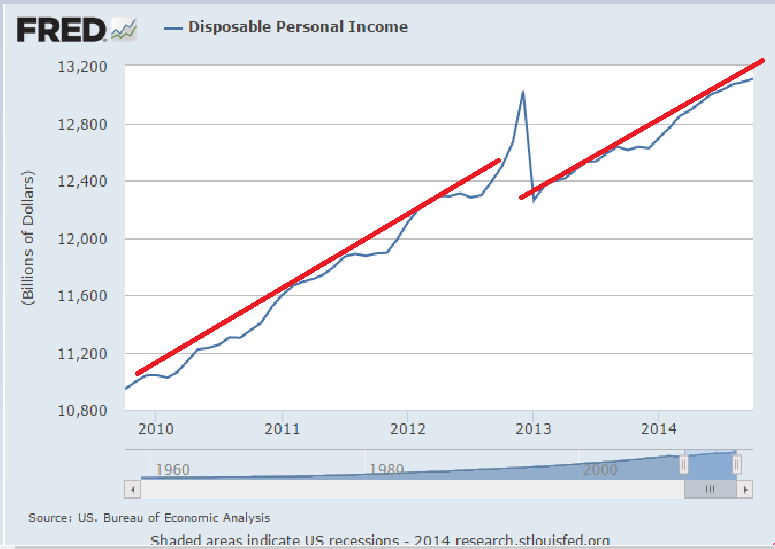
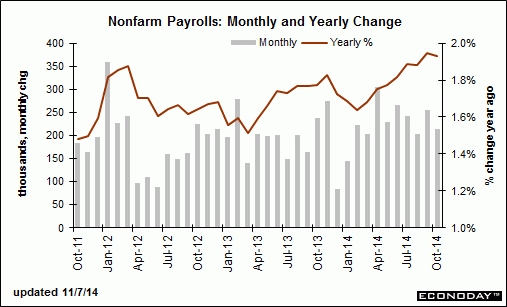
Here you can see how it was growing steadily, then shifted down when my payroll tax holiday expired, sort of resumed growing at the same rate, and now may be falling off, even with what the mainstream call ‘solid’ payroll growth:

11-28-2
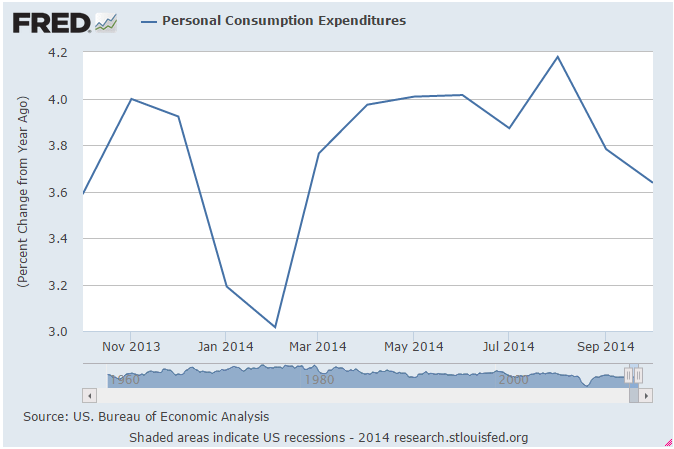
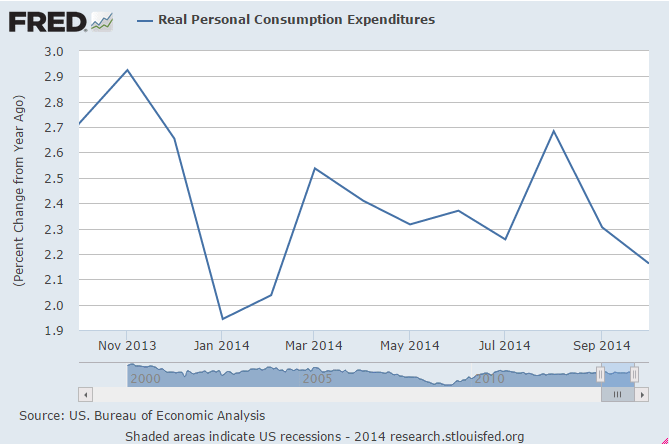
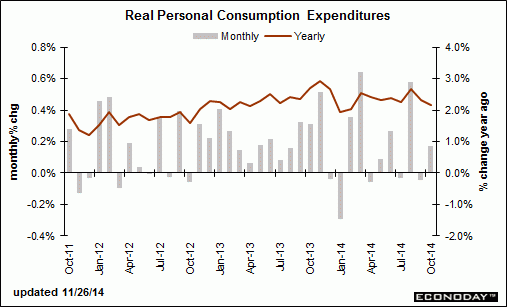
Likewise, there’s been a lid on the growth personal consumption expenditures where the growth rate dipped for the cold winter, recovered, and then fell off some:

11-28-3

11-28-4

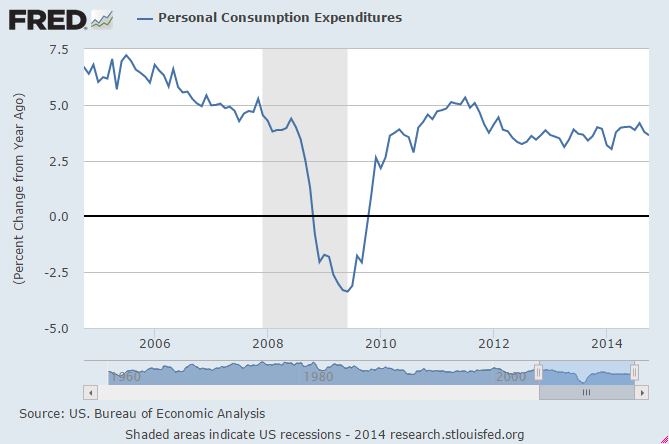
Adjusted for inflation/cpi the pattern is the same:

11-28-5

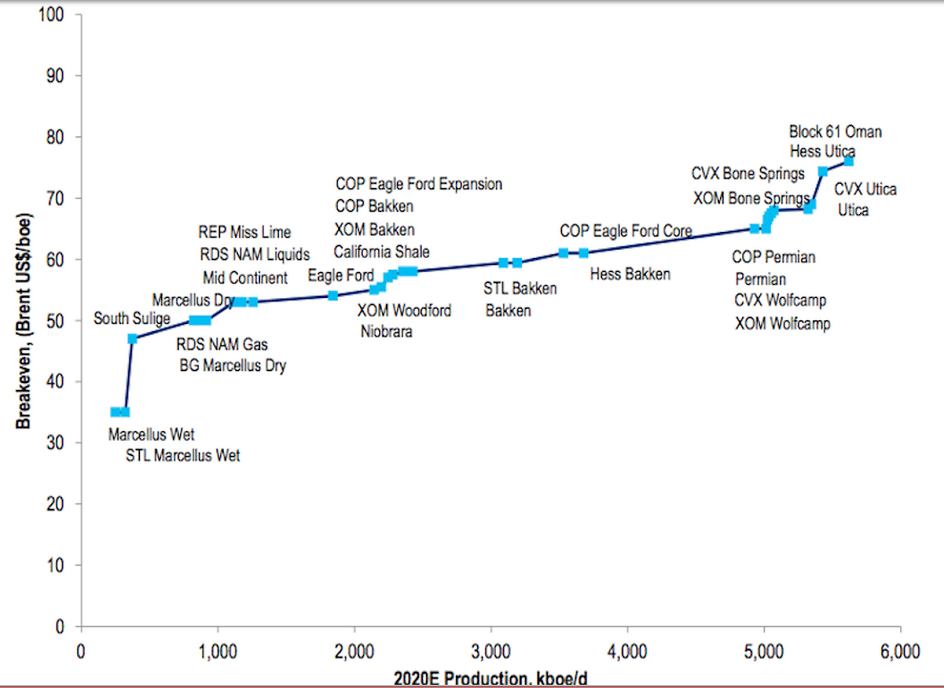
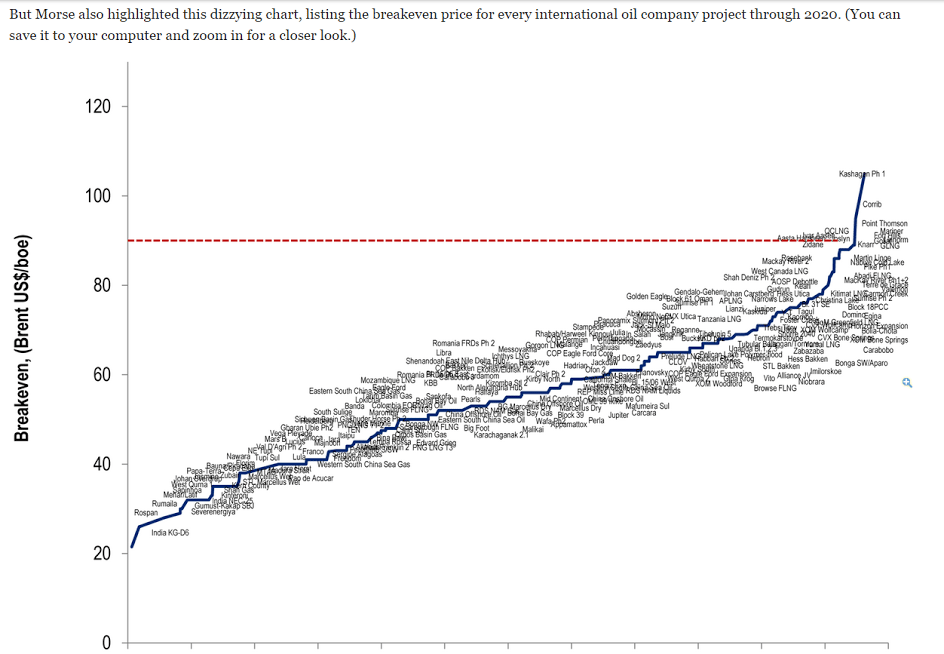
Oil- Not all that much to it.

The Saudis remain price setter as a simple point of logic.

No telling what their price target may be at any time, but they simply set price for their refiners and let them buy all they want at that price. And no one else has the excess capacity to do that.

Possible motives?

Put high priced producers out of business with $trillions of losses to make sure that when the subsequently raise prices to 150(?) new investment in high priced crude will then be considered to risky for anyone to finance?

And/or it’s not illegal for insiders to have gotten short for their personal accounts prior to the price cuts and subsequently covering prior to increasing prices, functionally transferring a bit of wealth from the state to private accounts?

Ramifications for the US:

US consumers helped a bit- about $100 billion/year last I heard?

Capex gets hurt by at least that much?

Trillions in value lost from loans and investments going south?

Thousands of high paying jobs lost in North Dakota, etc. due to reduced capex?

(EU not so much as they don’t invest nearly as much in high priced energy exploration/production?)

Canada, Mexico, Venezuela, Australia etc. economies and related securities/investments toast?

etc.

more seriously worrisome releases today

Chicago PMI
11-26-1
New Home Sales

11-26-2
Pending Home Sales Index

11-26-3
Personal Income and Outlays
11-26-4
11-26-5

Jobless Claims

11-26-11


Durable Goods Orders

11-26-6
Highlights
The headline number for durables looked good for October but the core number notably disappointed.

Durables orders rebounded 0.4 percent in October after September’s decline of 0.9 percent. Market expectations were for a 0.5 percent decline.

The core fell 0.9 percent in October after a rise 0.2 percent the month before. Analysts projected a 0.5 percent gain for October. Transportation increased a monthly 3.4 percent after falling a monthly 3.3 percent in September.

MBA Purchase Applications
11-26-9
Highlights
Data that are weekly are often subject to volatility, wild volatility in the case of the purchase index over the last two weeks which fell 10.0 percent in the November 21 week after surging 12.0 percent in the prior week. The trend, based on the 4-week average, is again clearly negative, at minus 10.0 percent year-on-year.

Consumer Sentiment
11-26-10


euro update, q3 gdp update

Seems trade flows and ‘inflation’ continue make the euro fundamentally stronger even as portfolios shifting due to ECB rhetoric keep it under pressure. Should the shifting run its course, I would not be surprised dramatic appreciation.

q3-1

q3-2

New figures released by the Federal Reserve Bank of New York on Tuesday show that mortgage lending is running at its lowest level in 13 years, with 2014 on pace to be the weakest for new loans since 2000.

Q3 GDP revised up a bit, year over year still low and down a bit, profits low and down a bit, and there is growing evidence the suspect sources of growth- govt and exports and inventories- that added about 2% are reversing:

GDP
q3-3

q3-4
Corporate Profits
q3-5

q3-6

q3-7

q3-8

Consumer Confidence
q3-9

q3-10

Richmond Fed Manufacturing Index
q3-11

Credit check, CBO suggestions

Nothing happening on the credit expansion side of consequence that I can detect:

credit-check-1

credit-check-2

credit-check-3

credit-check-4

credit-check-5

credit-check-6

Seems the CBO should stick to simple reporting:

CBO Presents Options for Reducing the Deficit: 2015 to 2024

from the Congressional Budget Office

The Congress faces an array of policy choices as it confronts the prospect of large annual budget deficits and further increases in the already-large government debt that are projected to occur in coming decades under current law. To help inform lawmakers about the budgetary implications of changing federal policies, CBO periodically issues volumes of policy options and their effects on the federal budget, of which this is the most recent. The agency also issues separate reports that present policy options in particular areas.