ADP oil and gas jobs down

Just getting started?

“Payroll processor ADP said this week that the mining industry, which includes oil and gas drilling, shed about 2,000 jobs last month after gaining an average of 3,000 a month in 2014.”

U.S. Steel to lay off more than 700 due to falling oil prices

By Len Boselovic

Jan 6 — U.S. Steel has announced plans to lay off 756 workers at steel tube plants near Cleveland and Houston, citing sharply lower oil prices.

Consumer credit, jobless claims

Less than expected and still subdued:

Consumer Credit
cons-credit-nov
Highlights
Consumer credit rose $14.1 billion in November though, once again, revolving credit was weak. The revolving credit component, where credit card debt is tracked, fell $0.9 billion in the month for the second contraction of the last four months. In contrast, the non-revolving credit component, as usual, posted a strong gain, up $15.0 billion and once again reflecting demand for auto loans and student loans. But revolving credit is the weak link in the consumer sector that continues to hold back gains for retail spending.
cons-credit-nov-graph

Jobless Claims
claims-1-3
Highlights
Initial jobless claims fell 4,000 in the January 3 week to 294,000, helping to pull down the 4-week average slightly to 290,500. The average is trending about 10,000 lower than the month-ago comparison which points to steady improvement underway in the labor market.

Data on continuing claims, which are reported with a 1-week lag, are mixed. Continuing claims in the December 27 week rose a sizable 101,000 to 2.452 million but the 4-week average fell 17,000 to 2.397 million. This average has been steady around the 2.400 million mark since late November. The unemployment rate for insured workers is unchanged for a fourth week at a recovery low of 1.8 percent.

Las Vegas Real Estate in December: Lowest Sales in Years, Non-contingent Inventory up 18% YoY

mtg purch apps, adp

Weaker, and down 8% year over year, even with much lower rates.

MBA Purchase Applications
mba-1-2
Highlights
Mortgage application activity fell sharply in the 2 weeks to January 2, down 5.0 percent for purchase applications and down 12.0 percent for refinancing applications. The trend for purchase applications, which offers an indication on underlying home purchases, is clearly negative, at a year-on-year minus 8.0 percent.

The declines come despite low mortgage rates with the average 30-year rate down slightly in the 2-week period to 4.01 percent for conforming loans ($417,000 or less). Note that today’s report covers not the usual 1-week period but, due to a holiday for MBA, a 2-week period.
mba-graph-1-2

Remember, this is now a forecast of Friday’s number, and not the ‘core’ ADP employment itself.

ADP Employment Report
adp-dec
Highlights
ADP’s estimate for private payroll growth for December is 241,000 vs the Econoday consensus for 235,000 and against ADP’s upwardly revised 227,000 for November (initial estimate 208,000). Turning to government data, the corresponding Econoday consensus for Friday’s jobs report is 238,000 vs November’s 314,000.

Imports down, but exports down as well, which could be a trend as surveys have been indicating deceleration.

International Trade
trade-balance-nov
Highlights
The U.S. trade balance again narrowed and more than expected. And again, improvement was largely due to lower oil prices.

In November, the U.S. trade gap narrowed to $39.0 billion from a revised $42.2 billion in October. Market expectations were for the deficit to narrow to $41.5 billion. Exports were down 1.0 percent after gaining 1.6 percent the month before. But imports declined a sharp 2.2 percent after rising 0.7 percent in October.

Shrinkage in the overall gap was led by the petroleum goods trade gap which dropped to $11.4 billion from $15.2 billion in October. Petroleum imports were down 11.9 percent while exports rose 5.9 percent.

The goods excluding petroleum gap increased to $45.7 billion from $45.2 billion in October. The services surplus was essentially unchanged at $40.4 billion.

On a seasonally adjusted basis, the November figures show surpluses, in billions of dollars, with South and Central America ($4.3) and Brazil ($0.6). Deficits were recorded, in billions of dollars, with China ($29.8), European Union ($12.7), Germany ($6.3), Japan ($5.6), Mexico ($4.4), South Korea ($2.9), Italy ($2.3), India ($1.7), France ($1.6), OPEC ($1.6), Canada ($1.4), Saudi Arabia ($1.3), and United Kingdom ($0.2).

Overall, the November number will likely bump up estimates for fourth quarter GDP growth.

Plunging Oil Prices Test Texas’ Economic Boom

And it’s not just the first order consequences of lower oil revenues and reduced capital expenditures. There are substantial multipliers as that income gets ‘respent’ not only in Texas but throughout the US and beyond.

Again, seems most all US periods of expansion were assisted by ‘borrowing to spend’ that would have been avoided, including the s and l credit boom of the 80’s that drove the Reagan years, the .com/y2k boom of the late 90’s, the sub prime expansion 10 years or so ago, and now, maybe the shale credit expansion boom that looks to have delayed the recession that otherwise would have set in after the tax hikes and sequesters of 2013. Japan, on the other hand, has been careful to not allow that type of thing to happen ever since it’s regretted credit boom of the late 80’s…

Plunging Oil Prices Test Texas’ Economic Boom

Jan 7 (WSJ) — The Lone Star State’s economy has been a national growth engine since the recession ended, expanding at a rate of 4.4% annually between 2009 and 2013, twice the pace of the U.S. as a whole. One in seven jobs created nationally during the 50-month expansion has been created in Texas, where the unemployment rate, at 4.9%, is nearly a percentage point lower than the national average. Analysts at the Federal Reserve Bank of Dallas estimate that a 45% decline in the price of oil will reduce Texas payrolls by 125,000. Payrolls were up 447,900 in November from a year earlier, or 3.9%. The Dallas Fed estimate implies growth of more than 300,000, or nearly 3%, even with a lower oil price, still faster than the national average of 2%.

Saudi Arabia Raises Price of Main Oil Grade for Asian Buyer

More on Saudi price changes.

Maybe the mainstream will wake up to the fact that the price went down because of Saudi price cuts, and not because of excess supply, etc.

But maybe not…

Saudi Arabia Raises Price of Main Oil Grade for Asian Buyers

By Anthony DiPaola and Grant Smith

Jan 6 (Bloomberg) — Saudi Arabia raised the cost of its oil sales to Asia in February, prompting speculation the world’s biggest exporter is retreating from using record price discounts to defend market share.

Saudi Arabian Oil Co. will sell its Arab Light grade for $1.40 a barrel less than a regional average next month, the company said yesterday in a statement. That’s a narrowing from January, when the discount was $2, the biggest in at least 14 years. It decreased 11 prices globally and increased six. Brent oil fell 5.9 percent yesterday.

Oil prices collapsed 32 percent since the Organization of Petroleum Exporting Countries decided to maintain its output target on Nov. 27, amid signs Saudi Arabia and other members are determined to let North American shale drillers and other producers share the burden of reducing an oversupply. When Aramco lowered prices for November it prompted speculation the nation was seeking to preserve market share.

“They’re putting the brakes on a little bit,” Leo Drollas, a London-based independent consultant and former chief economist at the Centre for Global Energy Studies, said by phone. “It’s a little message that maybe prices are going down too far too quickly, and this is a little signal that they’re looking at things.”

Brent crude added 22 cents to $53.33 a barrel on the ICE Futures Europe exchange at 12:38 p.m. Singapore time. Prices yesterday declined $3.31, or 5.9 percent, to $53.11, the lowest close since May 1, 2009.

Swelling Supplies

The state-owned producer, known as Saudi Aramco, raised prices for all its crudes in Asia and cut all of them for Europe and most in the U.S.

Saudi Aramco surprised the oil market in October when it trimmed November crude prices to five-year lows in Asia, signaling the biggest producer in OPEC would defend its market share rather than seeking to prop up prices. It continued last month, cutting the discount for Arab Light crude for sale to Asia in January to the deepest in at least 14 years.

Swelling supplies from producers outside OPEC drove Brent crude into a bear market on Oct. 8 amid waning demand from China, the world’s second-largest importer. Middle Eastern producers are increasingly competing with cargoes from Latin America, North Africa and Russia for buyers in Asia.

“There is a fight for market share going on,” said Tariq Zahir, a New York-based commodity fund manager at Tyche Capital Advisors. “We are not seeing any kind of production decreased.”

OPEC decided at its last meeting to keep its production target unchanged at 30 million barrels a day. Members pumped more than that for a seventh straight month in December even as the group itself forecasts that markets will need less of its crude.

Car sales weaker than expected

This is not good.

Q4 GDP estimates will be revised lower:

Motor Vehicle Sales
dec-vehicle sales
Highlights
Vehicle sales are coming in weaker than expected for December. With the bulk of automakers having already reported, sales of North American made cars and light trucks are tracking at an annual rate of 13.3 million for the month, well down from November’s 14.0 million rate and below the low end of the Econoday consensus of 13.5 million. Please check back at day’s end for the final tallies.

Posted in GDP

Saudis stabilizing price

Saudi Aramco Narrows Arab Light Asia OSP Discount to $1.40

By Sherry Su

(Bloomberg) — Co. raises official selling price to a discount of $1.40/bbl to Oman/Dubai benchmark crudes for Feb. shipments, from Jan. OSP of $2 discount, according to e-mail from co.

  • Jan. price was lowest since at least June 2000 when Bloomberg started compiling data
  • Asia OSP discount for Arab Medium was narrowed
  • Asia OSP discount for Arab Heavy was narrowed

Co. cuts Feb. official selling price of Arab Light for Northwest European buyers to $4.65/bbl discount to ICE Bwave benchmark vs $3.15 discount for Jan., according to e-mail from co.

  • Mediterranean formula price for Arab Light also cut; to -$4.60 for Feb. from -$2.50 in Jan.
  • Smaller changes applied to prices for U.S. buyers; light and medium grades cut, heavy grade raised

Saudi lifts oil price for Asia cuts in Europe

Jan 5 (FT) — Here’s more data for oil watchers to chew over – Saudi Arabia has just issued its selling prices for February.

Having rocked the market after two consecutive months of price cuts – first to Asia, then to the US, Saudi Aramco, the state-owned oil company, said in a statement on Monday that it would cut prices for all oil grades to customers in Northwest Europe by between $1.40 to $1.70.

However, in Asia, where it has been fighting for market share against Colombia and Nigeria (both of which have been kicked out of its traditional market in North America amid the shale oil boom), it raised prices across all oil grades by between 55 and 70 cents in a sign perhaps that demand from the region is growing once again.

For the US, it raised prices for heavy grade oil by 20 cents but cut prices on the other grades by between 10 and 60 cents.

Posted in Oil

flow news in 2014 is bad for the Euro

So I still see all the fundamentals/trade flows favoring the euro vs the $US, with the EU running a trade surplus and the US a deficit, and low oil prices ‘helping’ the EU trade balance while ‘hurting’ the US’s.

But the portfolio shifts continue to go the other way, including this report of CB’s shifting some 100 billion out of euro, spurred by the belief that what the ECB is doing and the Greek risk is euro unfriendly, and what the Fed is doing is $US friendly.

It’s as if the corn crop failed, and supply fell below demand, but someone with a large warehouse full of corn decided to sell it all. The price would go down until he was finished, and then the shortage due to the ongoing consumption would start driving prices higher.

Subject: flow snippet: last piece of flow news in 2014 is bad for the Euro

Every quarter the IMF puts out a snapshot of global central bank reserve composition (with a quarters lag).

Today, we got the Q3 numbers, and after accounting for valuation effects, the numbers seem to signal a shift in central bank behavior.

Normally, central banks operate with fairly fixed currency allocation targets, and when a currency goes down in value, they accumulate, to stabilize its share.

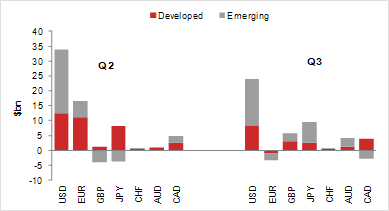
In Q3, the Euro dropped sharply vs the dollar, but both G10 and EM central banks were on the margin active sellers of Euro’s.

This is a big deal, as it suggest ‘portfolio rebalancing’ has been put on hold.

This means that stabilizing flows, which could have been in the region $100bn, are not materializing.

If this is indeed the new trend, there may be potential for a faster move lower in the Euro in early 2015, driven more purely by private sector flows.

Happy new year!
Jens Nordvig

The Euro share of global central bank reserves fell significantly in Q3. According to IMF COFER data published today, the Euro share of global reserves dropped 1.5 percentage points to 22.6%. This is one of the largest quarterly declines in the share ever. What is particularly interesting about the fall is that it was a function both of the valuation effect (a weaker Euro vs the USD) and active sales of Euros. This is striking, as normally „portfolio rebalancing‟ would create positive flows (EUR buying) to offset valuation effects when the price of the Euro declines (this happened during the early part of the Euro-crisis for example). As such, it seems that global reserve managers have may have put „portfolio rebalancing on hold‟ in the face of monetary policy divergence and negative interest rates on a large portion of their EUR holdings. If this trend continues, leaving central banks on the sidelines as the Euro declines, the Euro has potential to decline steadily in coming months in line with the trend in private sector flows.

Central Banks accumulate reserves, valuation causes total to fall

In the 2014 Q3 update of the IMF Composition of Official Foreign Exchange Reserves (COFER) data, global reserves decreased by $218bn, bringing the total reserves to $11.8trn. This is the first quarter that global reserves have fallen since the first quarter of 2009, and is only the third quarter total since the IMF began providing quarterly COFER data in 1999. The most recent data shows allocated reserves decreased by $128bn, while the unallocated reserves decreased by $90bn. However, the decline in reserves was driven by valuation adjustments. Excluding the valuation adjustments, advanced countries added $21bn in reserves, while emerging markets added $31bn.

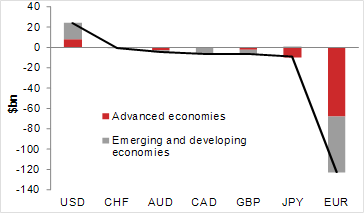
Adjusting the allocated reserves for currency valuation effects, there was central bank reserve buying of $52bn. This was dominated by USD buying, which totaled $24bn, with advanced economies buying $8bn and EM buying $16bn. EUR stood out as the most sold currency, with $3bn sold total, split with $1bn of selling from advanced economies and $2bn from emerging. EUR showed the biggest decline when including valuation and measured in USD, with reserves falling by $123bn (or just over 8% of outstanding EUR denominated (allocated) reserves).
cur-1

cur-2
According to our central bank intervention tracker, intervention slowed significantly to just $22bn in Q3, driven primarily by a large change in tact by China, which switched to FX selling (see Quarterly central bank reserve update, 16 October 2014). The valuation-adjusted flows from the IMF also suggest that intervention slowed, although to a lesser degree, with $52bn of total accumulation compared to $71bn in Q2 (in allocated reserves).

Allocation to USD up, EUR down

With the US dollar gaining strength in the third quarter, it would have been logical to assume a tendency to sell USD and buy some of the relatively cheaper currencies in order to maintain allocations in central bank portfolios. At least this has been the general pattern of central bank behavior in the past, including during the Euro-crisis.

However, in Q3 we saw the opposite. Reserve managers actively accumulated USD and sold EUR. Meanwhile, portfolio rebalancing worked as normal for other currencies, with reserve managers actively buying JPY, AUD and GBP during Q3, helping to stabilize allocated shares. With regard to the Euro, the active selling exacerbated the valuation effect rather than countering it. Hence the USD allocation jumped sharply to 62.3% from 60.7% (a 1.6pp increase) globally and EUR allocation fell to 22.6% from 24.1% (a 1.5pp decline). This fall in EUR allocation globally is the largest in a quarter since Q1 2004 (and larger than the declines during the Euro crisis periods). The USD allocation gain is tied historically with Q1 2004 as the largest.

One reason for the shift out of EUR as a reserve currency could be the low and often negative yields in Eurozone assets. As we highlighted in The Trillion Euro Question, a large amount of short-term bonds and deposits held in Eurozone assets were earning negative yield and at risk for a shift out of the Eurozone. If global reserve managers have indeed disabled portfolio rebalancing in the context of their EUR share, it has important negative implications for the Euro in coming months

If global reserve managers have indeed disabled portfolio rebalancing in the context of their EUR share, it has important negative implications for the Euro in coming months.

credit check

Big dip in commercial paper. Note the uptick in some of the bank lending charts indicating borrowers switched from borrowing in the commercial paper market to borrowing from their banks.

And be on the lookout for mainstream research noting only the growth in bank lending and associating that with an improving economy.

This fell:

cc-12-2-1
And these next two went up a bit:
cc-12-2-2

cc-12-2-3

The rest remained lack luster:

cc-12-2-4

cc-12-2-5

PMI Manufacturing Index, ISM manufacturing, Construction spending

PMI Manufacturing Index
1-2-1

Highlights
Slowing growth is the signal from Markit’s US manufacturing sample where the final composite score came in at 53.9, down from November’s 54.8. The flash reading for December was 53.7. New business gains and output both slowed in the month which respondents tied to uncertainty over the global economic outlook. Export orders did rise but weak demand was noted in the euro area and emerging markets. The news on hiring is downbeat with growth the slowest since July. A negative for employment is a marked slowing in backlog accumulation. Inventory data look lean the price data subdued. Coming up next will be the ISM’s manufacturing report at 10:00 a.m. ET.

The index was down and below expectation and note the fall in export orders. Part of the downside of low oil prices could be a drop in exports to producing nations experiencing sharp declines in oil revenues.

1-2-2
Highlights
The ISM report had been running hot compared to many other measures of the manufacturing sector which should help limit the impact from the slowdown in today’s report. The ISM composite index came in at 55.5, down a sizable 3.2 points from November for the slowest rate of monthly growth in six months.

Growth in new orders slowed substantially, to 57.3 from November’s exceptionally strong 66.0, while backlog accumulation also slowed, to 52.5 from 55.0. Production slowed to 58.8 vs 64.4.

1-2-3

1-2-4

Construction Spending
1-2-5

Highlights
Construction outlays slipped 0.3 percent in November after a sharp 1.2 percent rebound in October. Market expectations were for a 0.5 percent gain.

November’s decrease was led by public outlays which fell 1.7 percent after a 2.8 percent jump in October. Private residential spending rose 0.9 percent, matching the pace the month before. Private nonresidential construction spending dipped 0.3 percent in November after edging up 0.1 percent in October.

On a year-ago basis, total outlays were up 2.4 percent in November compared to 4.0 percent in October.

The construction sector is slowing, tugging down on fourth quarter GDP.
1-2-6