mtg purchase apps

Purchase apps up nicely again.

Seems to be replacing “all cash” buyers.

MBA Mortgage Applications
mba-4-3
Highlights
The purchase index had been dead flat all year but is now moving higher and quickly in what is the latest positive sign out of the housing sector. Mortgage applications for home purchases surged for a 3rd week, up 7.0 percent in the April 3 week to the highest level since July 2013. Year-on-year, the index is up a very strong 12.0 percent.

The refinancing index, which had also risen sharply in the prior 2 weeks, fell back 3 percent in the latest week. Low rates are a key factor boosting demand with the average 30-year mortgage for conforming loans ($417,000 or less) down 3 basis points in the week to 3.86 percent.

Purchase Applications:
purch-apps-4-3

labor mkt index, ISM services, tax collections, truck sales, lumber

Presumably this means something to the Fed:

Labor Market Conditions Index
labor-market-conditions-mar
Highlights
The Fed’s Board of Governors Research Department’s unofficial report on labor market conditions came in weak for March, dropping to minus 0.3 from plus 2.0 in February. There was no text or detail on the unofficial report but highly likely was weighed down by the March payroll number from the BLS. Odds have gone up for delayed rate hiking by the Fed. The March number was the lowest since minus 2.4 for June 2012. The Fed revises the historical data every month.

This survey still looks reasonably firm:

ISM Non-Mfg Index
ism-non-man-march
Highlights
The factory sector may be soft right now but not the rest of the economy, based on a very strong PMI services report posted earlier this morning and now the ISM non-manufacturing report where the headline index is at a very healthy 56.5. Strength in new orders, at 57.8, is a key plus in the report as is growth in backlog orders, at 53.5 which is relatively strong for this reading. Employment, at 56.6, is very strong and at a 5-month high.

Breadth of strength is especially encouraging with 14 of 18 industries reporting composite growth in the month led by management services at the top and even including construction which, though the slowest of the 14, is still in the plus column. The 4 industries in the negative column include mining and also education.

Weakness in foreign demand for US goods, the result in part of the strong dollar, is increasing focus on the non-manufacturing economy and the ability of the US consumer to keep up the nation’s economic growth. Right now, with employment trends solid, consumers appear to be doing their share.
ism-non-man-march-graph

Looks like the govt took a lot of $ out of the economy April 1 indicating taxable income was up:
fed-withholding
These seem to peak in front of recessions:
us-heavy-trucks-sales
Sort of a housing indicator:
framing-lumber-index

Balanced budget amendment getting closer, consumer credit, Redbook retail sales, JOLTS

the BIG stupid…

Conservative lawmakers weigh bid to call for constitutional convention

Consumer Credit
consumer-credit-feb-table
Highlights
Consumer credit rose a solid looking $15.5 billion in February but a closer look shows an unwanted $3.7 billion decline in revolving credit. This is the 4th decline in 5 months for the revolving component which reflects consumer reluctance to finance purchases with credit-card debt. This reluctance may be a plus for consumer wealth, given the extremely high rates of interest credit-card companies often charge, but it is a definite negative for consumer spending which has been very soft in recent months.

In contrast to revolving credit, non-revolving credit rose $19.2 billion which is the strongest gain since July 2011. The gain does reflect financing for autos but also an item not associated with consumer spending, and that’s the government’s ongoing and heavy acquisition of student loans.

Year over year showing a (modest) decline in growth:

consumer-credit-feb-graph
consumer-credit-feb-graph-2

This is mainly student loans and the growth rate continues to decline:

consumer-credit-feb-graph-3

Not much of an Easter boost in retail showing in this chart:

redbook-4-2

This was for Feb and inline with Feb payrolls:

JOLTS
jolts-feb

Payrolls, credit check

As suspected, last month’s print was revised lower and now with this month’s even lower print the spike reported in November has completely reversed and the payroll number is back in sync with ADP and the rapid declines in most other series.

Employment Situation
emp-cc-1
Highlights
The labor market has softened in several aspects. Payroll jobs increased a mere 126,000 in March after increases of 264,000 in February and 201,000 in January. January and February were revised down a net 69,000. Market expectations for March were for a 247,000 increase.

The unemployment rate held steady at 5.5 percent and matched expectations. The labor force participation rate edged down marginally to 62.7 percent from 62.8 percent in February.

Turning back to the establishment survey, private payrolls increased 129,000 in March after a 264,000 boost the month before. Analysts forecast 240,000. In March, employment continued to trend up in professional and business services, health care, and retail trade, while employment in mining declined.

Employment in other major industries, including construction, manufacturing, wholesale trade, transportation and warehousing, information, financial activities, and government, showed little change over the month.

Average hourly earnings rose 0.3 percent, topping expectations for 0.2 percent. The average workweek slipped to 34.5 hours versus 34.6 in February and coming in below forecasts for 34.6 hours

The latest employment report clearly is soft and will add to arguments by Fed doves to delay rate hikes.
emp-cc-2

emp-cc-3
emp-cc-4
emp-cc-5
And no ‘structural issues’ here, just an obvious lack of demand:
emp-cc-6

BLS Jobs Situation Surprisingly Bad in March 2015

By Steven Hansen

The BLS jobs report headlines from the establishment survey was weak and well below expectations. The unadjusted data shows relatively weak jobs growth. The real story this month is the ALL the establishment survey jobs growth for 2015 was re-estimated lower. This is such a soft jobs report that the Federal Reserve will be reluctant to raise their interest rates.

Credit check:
emp-cc-7
emp-cc-8
emp-cc-9
emp-cc-10

Trade, factory orders, rail traffic, Japan PMI

Imports and exports both down.

Note the last two time this happened in any magnitude sort of match up to the last two recessions:

us-trade-exp-imp
us-trade-def

February 2015 Trade Data Shows a Mixed Picture of the Economy

By Steven Hansen

Written by Steven Hansen

A quick recap to the trade data released today shows a mixed picture. The unadjusted value of export three month rolling averages accelerating month-over-month, while imports decelerated. Many care about the trade balance (which was better than last month and well above expectations), but trade balance simply has little correlation to economic activity. Likely much of the soft data is due to the West Coast ports labor issues.

Factory Orders
factory-orders-feb-table
After 6 straight declines, factory orders finally moved to the plus column, up 0.2 percent in a February gain, however, that is tied largely to an upward price swing for petroleum and coal products. Another mitigating factor is a sharp downward revision to January orders, to minus 0.7 percent from minus 0.2 percent.

Durable goods show broad weakness with orders down 1.4 percent in data initially posted last week. Most readings show significant declines and underscore this morning’s export dip in the international trade report and the Fed’s concerns over weak export markets and the negative effects of the strong dollar. Core capital goods are down 1.1 percent in the month for a 6th straight decline in a reading that points to a lack of business confidence and business investment.

Total shipments bounced back 0.7 percent in February but follow a 2.3 percent plunge in January and which holds down factory contribution to first-quarter GDP. A clear negative is a 3rd straight decline for unfilled orders, down 0.5 percent for what is now the weakest string since way back in the recession days of late 2009. A lack of unfilled orders will not encourage manufacturers to add to their workforces. One positive is inventories which are less heavy, up only 0.1 percent and bringing down the inventory-to-shipments ratio to 1.35 from January’s recovery high of 1.36.

The main positive in today’s report is the non-durables component where a 1.8 percent gain ends 7 straight declines, declines all tied to oil-price effects. But the weakness in durables, tied to foreign demand, is becoming a significant negative for the economic outlook.
factory-orders-feb-graph

February 2015 Manufacturing Mixed. Rolling Averages Remain in Contraction.

By Steven Hansen

US Census says manufacturing new orders improved. Our analysis agrees – and even the headline year-over-year growth declined from last month. The data has been soft for a half a year. Consider that this data is noisy – and the rolling averages (which include transport) remain in contraction territory. Unfilled orders are shrinking (year-over-year). Transport was soft this month.

Rail Week Ending 28 March 2015: Month Ends with Contraction Year-over-Year

Econintersect — Week 12 of 2015 shows same week total rail traffic (from same week one year ago) again declined according to the Association of American Railroads (AAR) traffic data. Intermodal traffic, which accounts for half of movements, is now strongly growing year-over-year – but weekly railcar counts remain in contraction. Rail traffic is surprisingly weak.

jn-pmi-mar
Highlights
The March business activity index reading was below the crucial 50 no change mark for a second consecutive month, signaling deterioration of the service sector. The reading was 48.4. New orders stagnated with service providers continuing to reduce their staffing numbers albeit at a slight pace. Meanwhile, cost pressures were evident, as purchasing costs increased and at a faster rate than the previous month. Although only moderate, the rate of contraction was faster than the average since the higher sales tax was implemented in April 2014.

Panelists mentioned a slowdown in sales volumes and a fall in contracts leading to the latest decline in activity. Meanwhile, latest data highlighted a weaker improvement of output in the Japanese manufacturing sector. The composite output index posted at 48.4, indicating a slight contraction in overall activity.

Car sales, mortgage purchase apps, ADP jobs, ISM manufacturing, construction spending

U.S. Light Vehicle Sales increase to 17.05 million annual rate in March

By Bill McBride

​U.S. auto sales hit a speed bump in March

April 1 — DETROIT – U.S. car buyers tapped the brakes in March, a sign of a long-expected slowdown in the blistering pace of sales.

March sales were expected to be flat compared with last March. Car-buying site TrueCar.com predicted total U.S. sales of 1.5 million vehicles in March, down less than 1 percent from a year ago. It was the first monthly decline since September 2013.

But not every company saw declines. Hyundai’s U.S. sales jumped 12 percent over last March after a big boost in incentives. Subaru’s sales were up 10 percent. Toyota’s (TM) sales were up 5 percent, and FCA (FCAU) — the parent of Chrysler and Fiat — said its sales rose 2 percent.

However, those gains were offset by lower sales at other major automakers. General Motors’ (GM) sales fell 2 percent, and Ford (F) and Nissan (NSANY) both saw 3 percent declines. Honda’s (HMC) sales were down 5 percent. Volkswagen’s (VLKAY) sales plummeted 18 percent.

For the most part, March didn’t see the kind of big increases the industry has gotten used to. U.S. auto sales were up 14 percent in January, for example, and 5 percent in February.

Mtg purchase apps up 8% vs last year, though still very low absolute level.
We’ll see if it’s a case of cash buyers being replaced or net new purchases
as sales reports surface:

MBA Mortgage Applications
mba-3-27-table
Highlights
Signs of life are suddenly appearing across a host of housing data including mortgage activity which is up sharply for a second straight week. Purchase applications rose 6.0 percent in the March 27 week with refinancing up 4.0 percent. Rates are low with the average 30-year mortgage for conforming loans ($417,000 or less) down 1 basis point in the week to an average 3.89 percent.
mba-3-27-graph

The chart looks like tomorrows jobs report is overdue to converge:

ADP Employment Report
adp-march-table
Highlights
ADP’s data are very soft, at 189,000 in March vs the Econoday consensus of 230,000 and vs a consensus of 240,000 for private payroll growth in Friday’s employment report. And ADP’s data for February tracked much lower than the government’s data, at a revised 214,000 vs 288,000 for the government. ADP doesn’t always track well with the government’s data but today’s data, which are unusually soft relative to expectations, will nevertheless weigh on expectations for Friday’s employment report.
adp-march-graph

This chart is also retreat, and note the weakness in exports:

ISM Mfg Index
ism-mfg-march-table
Highlights
Weak exports are pulling down ISM’s manufacturing sample whose index fell 1.4 points to 51.5. This is below what was a soft consensus forecast of 52.5 and is the lowest reading since May 2013.

New orders fell 7 tenths to 51.8 for its lowest reading since April 2013. New export orders are in contraction for a 3rd straight month, down 1.0 point to 47.5 for their lowest reading since November 2012.

There was no net hiring in ISM’s sample during March with the employment index at 50.0 which is the lowest reading since May 2013. Prices paid, at 39.0, remains in contraction for a 5th straight month.

This report points to another month of trouble for government data on manufacturing, a sector that, due to weak foreign demand, appears to be pulling down the nation’s growth.
ism-mfg-march-graph

Construction Spending
construction-spending-feb-table
Highlights
Construction spending unexpectedly dipped 0.1 percent in February after falling 1.7 percent in January. Market expectations were for a 0.2 percent increase.

February’s decrease was led by public outlays which dropped 0.8 percent. Private nonresidential construction spending rebounded 0.5 percent. Private residential spending slipped 0.2 percent.

On a year-ago basis, total outlays were up 2.1 percent in February compared to 1.4 percent in January.
construction-spending-feb-graph

Saudi output

Saudis set price and let their clients buy all they want at the price settings, so their output continually adjusts to equal global demand net of all others producers.

What’s clear is that said net global demand has fluctuated very little, obviating the notion that the price collapse was somehow a function of a collapse of demand.

saudi-output-march

US macro update, FX update

US macro update:

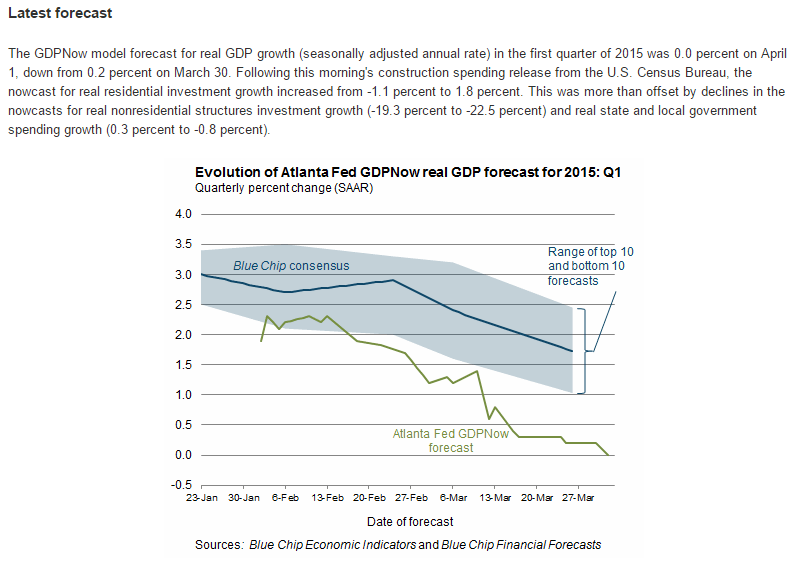
So looks to me like it’s all gone bad since the oil price crash, exactly as feared, and the Atlanta Fed most recently lowered it’s Q1 GDP estimate to 0.

First, a quick review of the accounting.
GDP = spending = sales = income.
An increase in spending = an increase in sales = an increase in income.

And, on a look back, as a point of logic, is this critical, fundamental understanding:

For every agent that spent less than his income (aka demand leakages) another must have spent more than his income (aka deficit spending/spending from savings) or that much output would not have been sold.

And this also means that to sustain last year’s rate of GDP growth, all the sectors on average need to grow at least at the same rate as last year, and higher if GDP growth is to increase.

Next, in that context, a quick look back at the last few years.

When stocks fell after the 2012 Obama reelection I called it a buying opportunity, as I saw sufficient total deficit spending along with sufficient income growth for additional private sector deficit spending that I thought would support maybe 4% GDP growth.

But that changed when we were allowed to at least partially go over what was called ‘the fiscal cliff’ with the expiration of my (another story) FICA tax cut and some of the Bush tax cuts amounting to what was then estimated to be a $180 billion tax hike- the largest in US history. And the sequesters about 4 months later cut about 70 billion in spending. That all lowered my GDP estimate by that much and more, and I began referring to a macro constraint that would keep an ever declining lid on GDP.

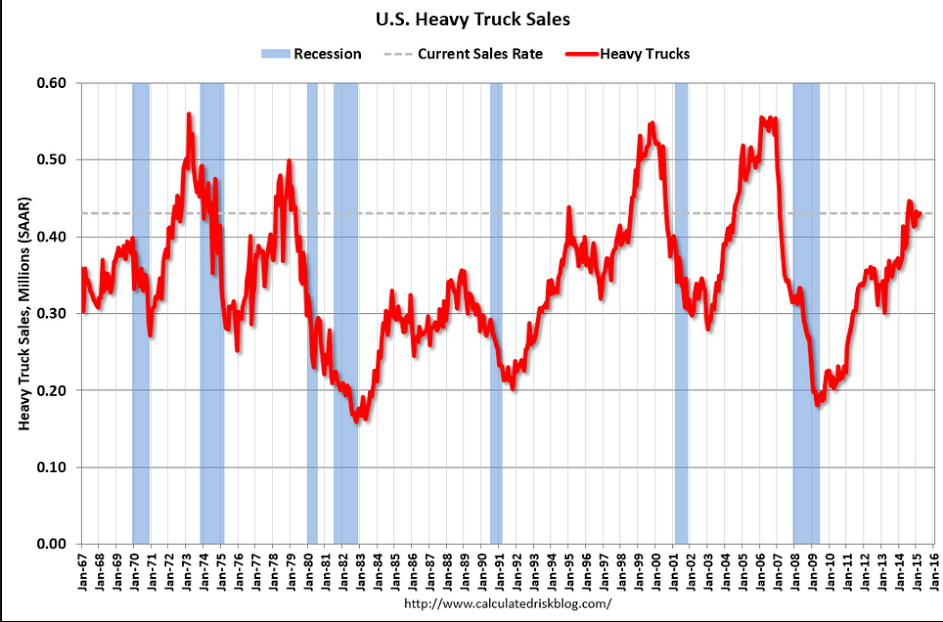
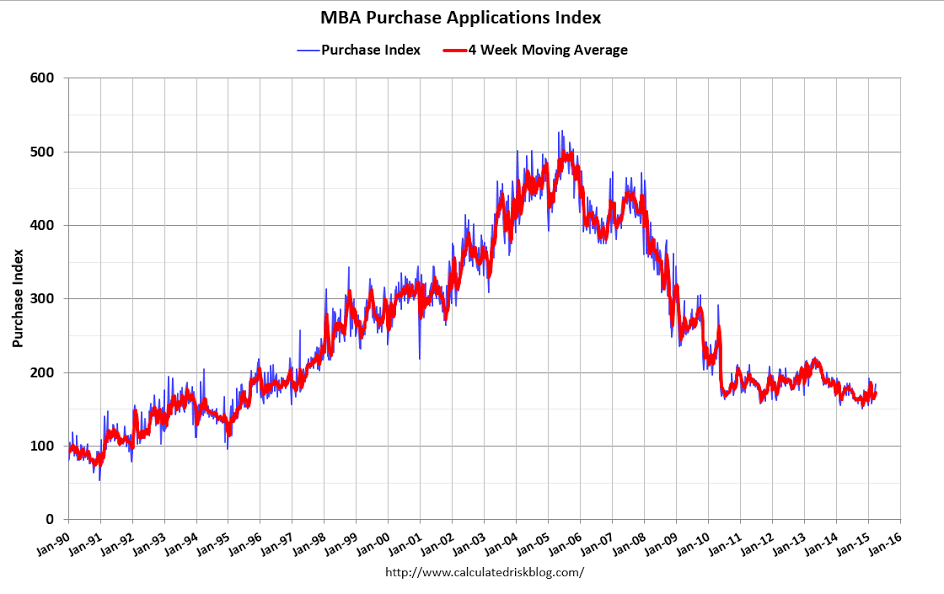
The fundamental problem was that govt, the agent that was spending more than its income to offset the demand leakages, had suddenly removed that support, and I didn’t see any other agent stepping up to the plate or even capable of stepping up to the plate to increase his deficit spending to replace it. Historically it would be housing and cars, but with the income cuts from the decrease in govt net spending I didn’t see those sectors sufficiently increasing private sector deficit spending.

So GDP growth was lower than expected in 2013, and even what we had towards the end of the year looked bogus to me, including the mainstream claiming the rise in inventories this time was a good thing, not to be followed by reduced production, as it meant there were high sales forecasts and it all would be self sustaining. I thought otherwise and wrote about heading to negative growth by year end.

And in fact Q1 2014, originally forecast to grow at about 2%, was first released as positive before being subsequently revised down to less than -2%, with maybe 1% of that drop due to cold weather. At that point I continued to not see any source of deficit spending to offset the demand leakages that were dragging down the economy.

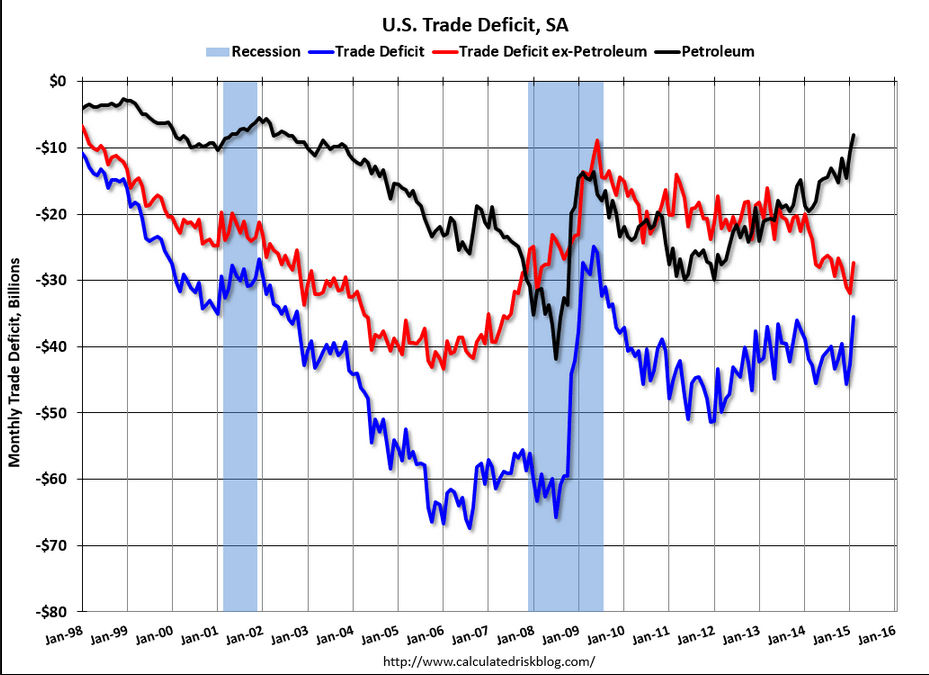
However, what I completely missed in early 2014 was the increase in deficit spending underway in the energy sector as new investment chased $90 crude prices. I knew crude production was expanding, and likely to grow by maybe a million barrels/day or so, but I didn’t realize the magnitude of the rate of growth of that capital expenditure until after prices collapsed several months ago and economists started estimating how much capex might be lost with lower prices.

It was then I realized that the energy sector had been the mystery source of the growth of deficit spending that had been offsetting the drop in govt deficit spending, and thereby supporting the positive GDP prints that otherwise might have gone negative much sooner, and that the end of that support was also the end of positive GDP growth.

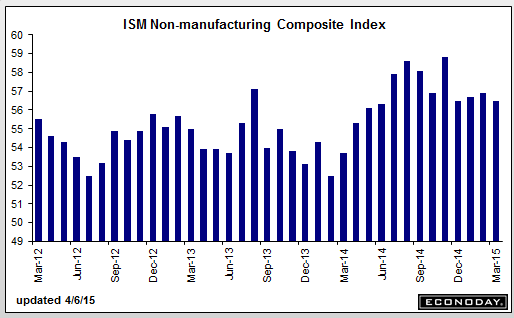
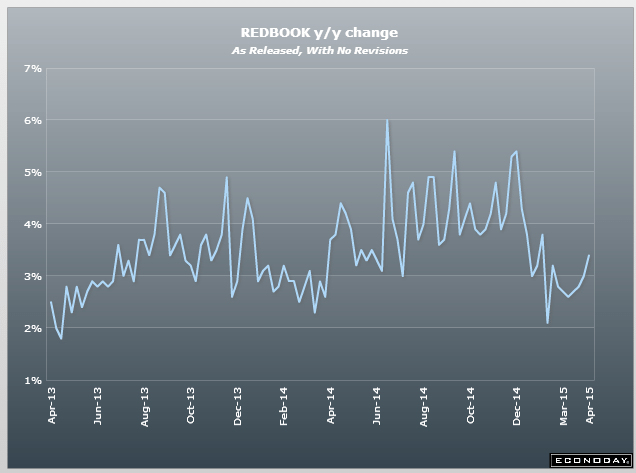
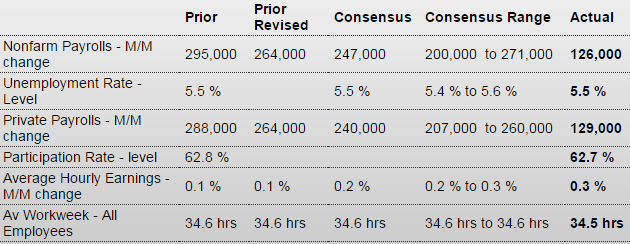
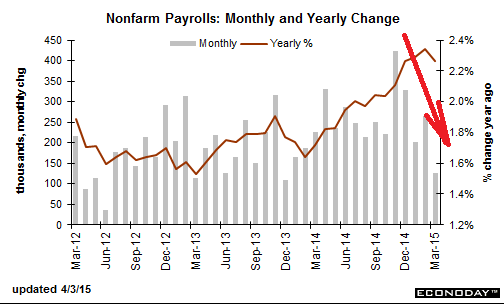
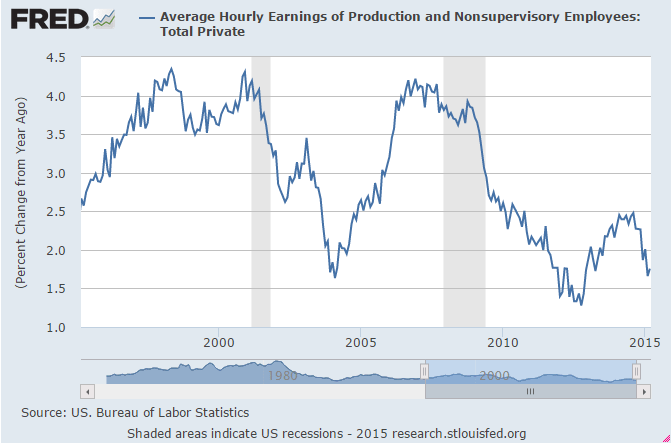
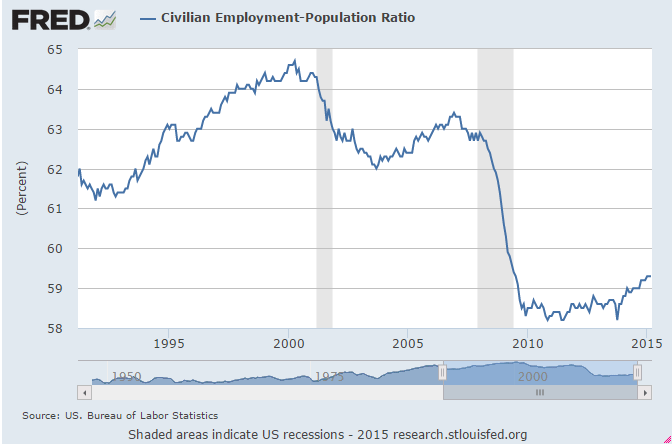
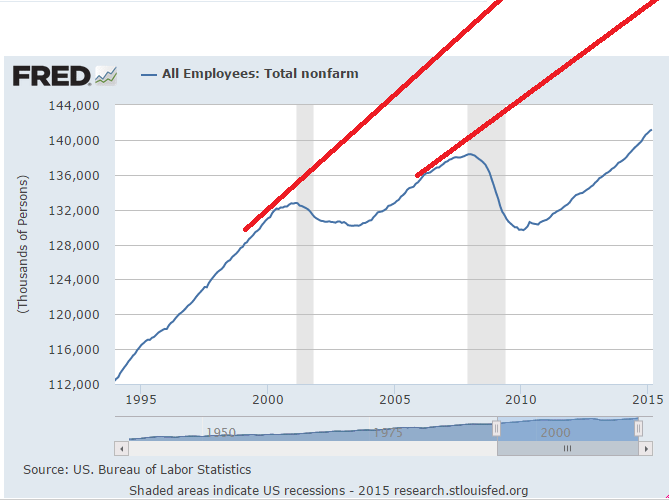
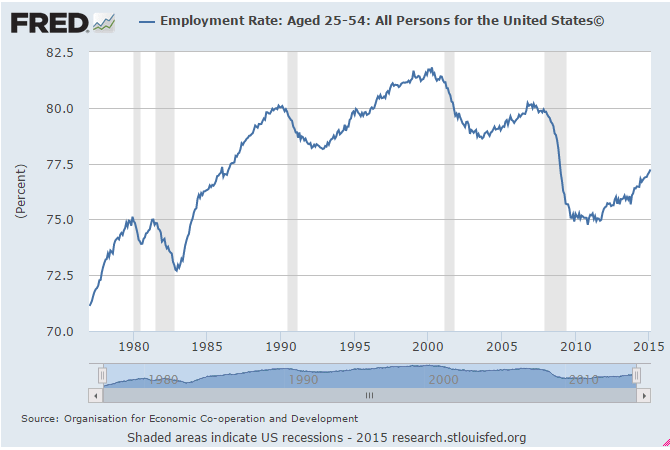
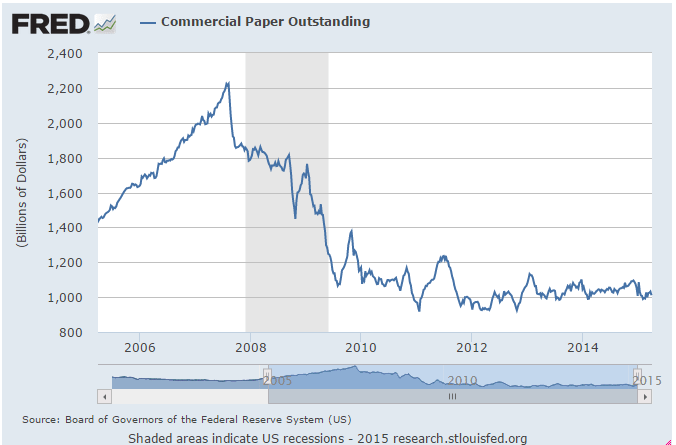
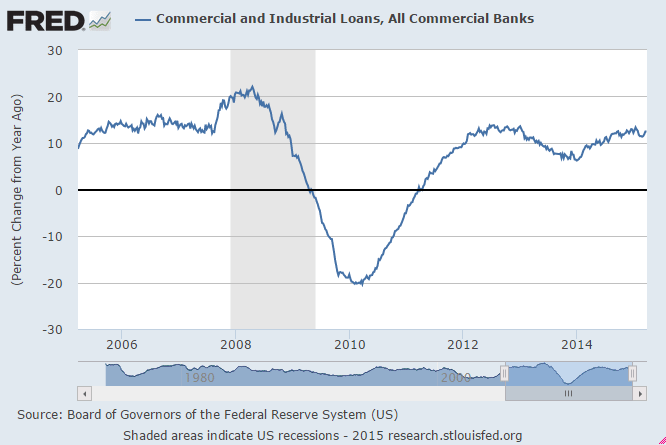
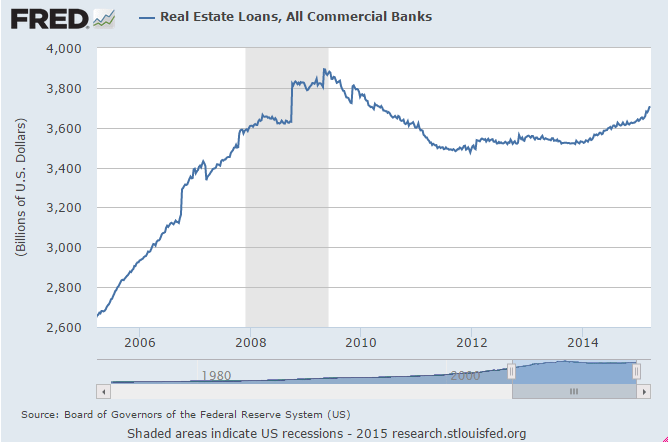
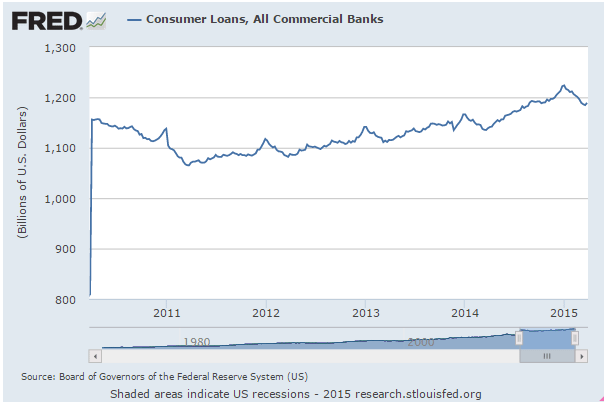
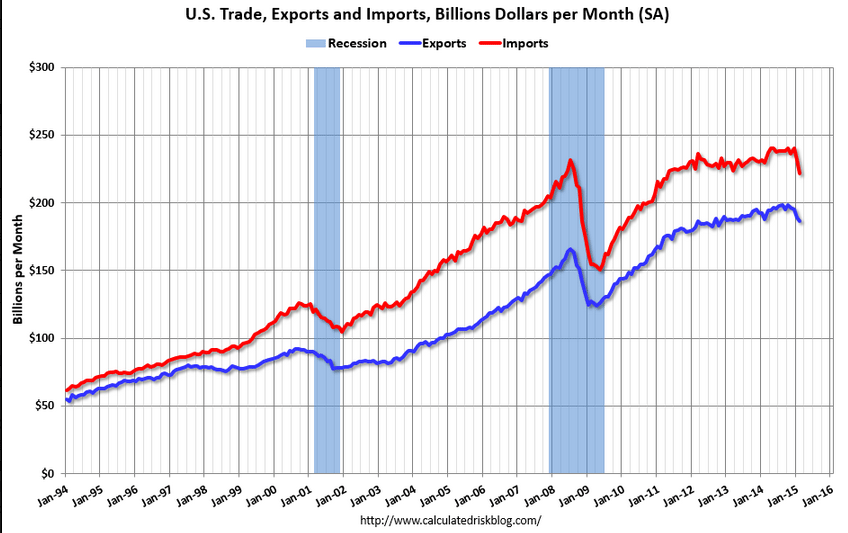
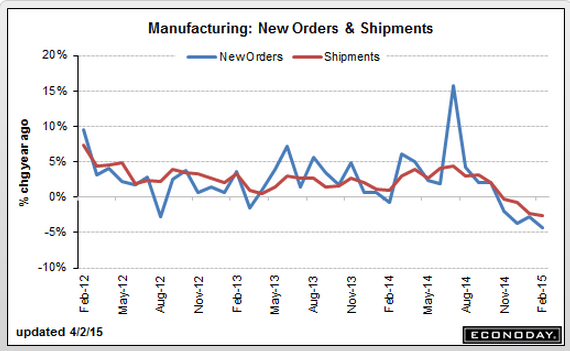
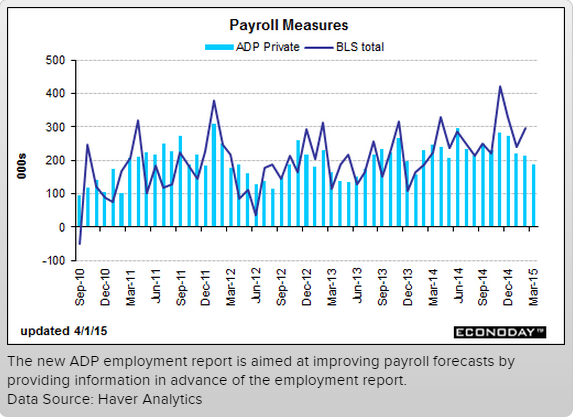
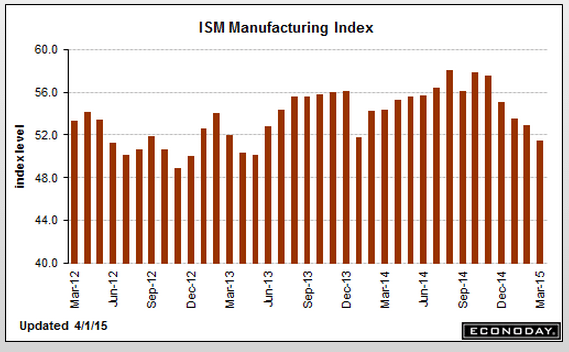
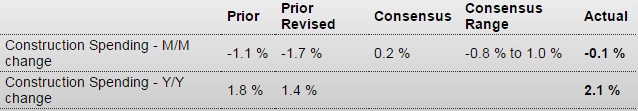
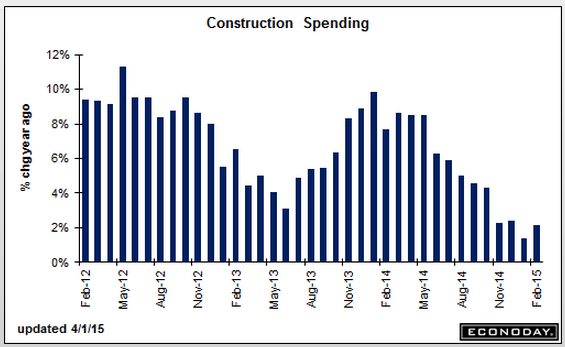
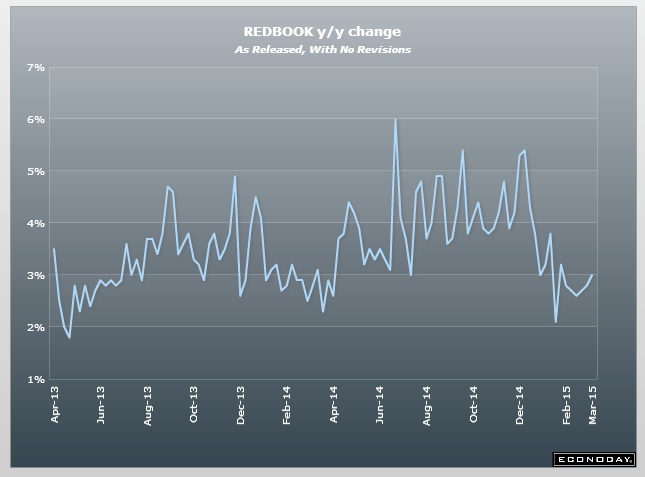
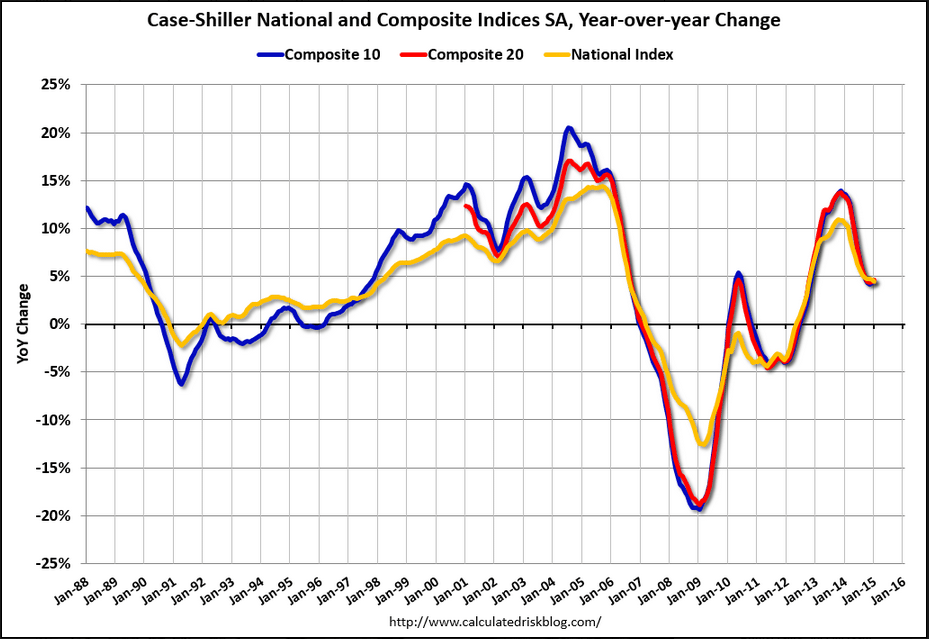
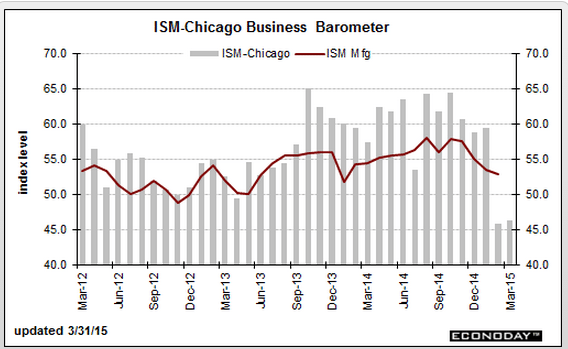
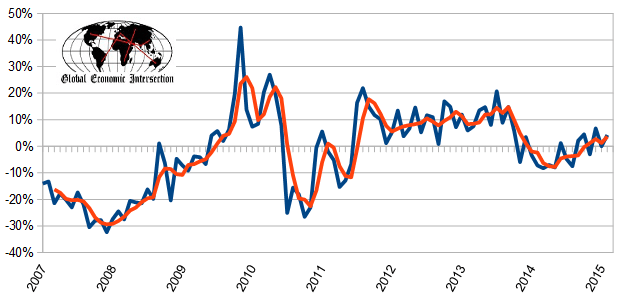
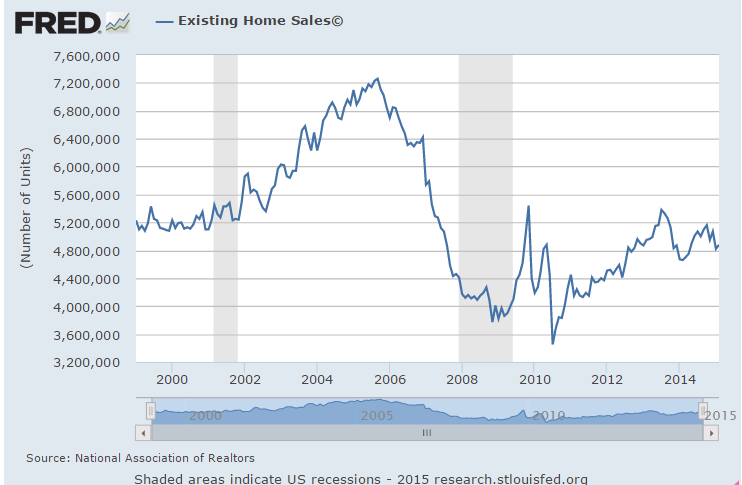
So here we are, with Q1 GDP forecasts all being revised down after Q4 was also revised down, as all the charts are pointing south, and all are in denial that it is anything more than a random blip down as happened last year in Q1, along with the pictures of houses and cars covered in snow, as forecasts for Q2 and beyond remain well north of 2%.

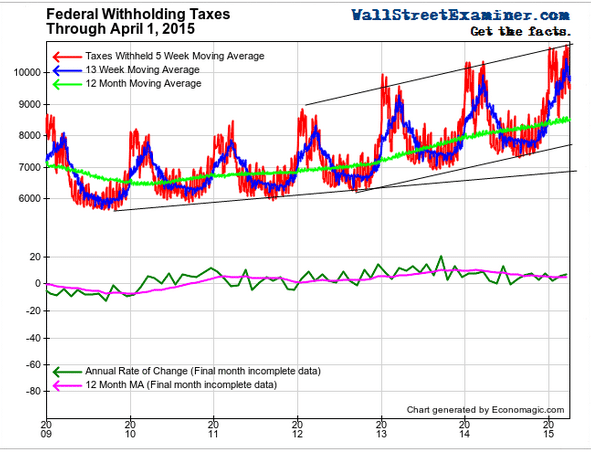
But without some agent stepping up to the plate to replace the lost growth in energy CAPEX that replaced the lost govt deficit spending, all I can see is the automatic fiscal stabilizers- falling tax revenues and rising unemployment comp- as the next source of deficit spending that eventually reverses the decline.
nowcast-3-30

FX:

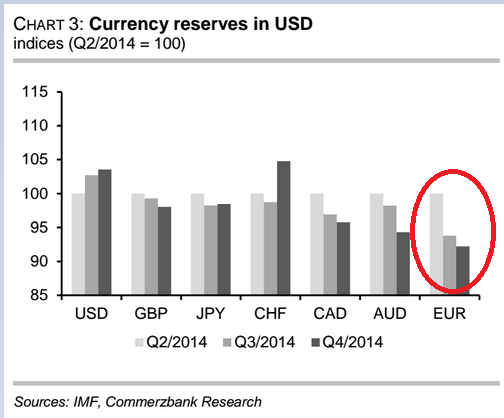
The euro short/underweight looks to me to be the largest short of any kind in the history of the world. The latest reports confirmed large scale global central bank portfolio shifting out of euro both through historically massive active selling, as well as passively as valuations changed relative weightings. And at the same time, the speculation and portfolio shifting that drove the euro down resulted in the real global economy selling local currencies to buy euro to use to purchase real goods and services from the EU. In other words, the falling euro has supported a growing EU current account surplus that’s removing net euro financial assets from the global economy.

The portfolio shifting has been driven by fundamental misconceptions that include the belief that
1. The old belief that lower rates from the ECB are an inflationary bias and therefore euro unfriendly
2. The old belief that QE is an inflationary bias and therefore euro unfriendly
3. The belief that Greek default is euro unfriendly
4. The new belief that the EU current account surplus creates a domestic savings glut that is euro unfriendly.

The operational facts are the opposite:

1. Lower rates paid by govt reduce net euro financial assets in the economy while net govt spending is not allowed to increase, the net of which functionally is a tax on the economy and euro friendly.
2. QE merely shifts the composition of euro deposits at the ECB while (modestly) reducing interest income earned by the economy and increasing ECB profits that get returned to members to contribute to deficit reduction efforts and not get spent, the net of which is functionally a tax on the economy and euro friendly.
3. Greek bonds are euro deposits at the ECB that are reduced by default, thereby acting as a tax on the economy and euro friendly.
4. The EU current account surplus is driving by non residents buying real goods and services from the EU which entails selling their their currencies and buying euro used to make their purchases, which is euro friendly.

So it now looks to me like the portfolio shifting has run its course as the EU current account surplus continues to remove euro from the global economy now caught short. This means the euro is likely to appreciate to the point where the current account surplus reverses, and since the current account surplus is not entirely a function of the level of the euro, that could be a very long way off. Not to mention that as EU exports soften additional measures will likely be taken domestically to lower costs to enhance competitiveness, which will only drive the euro that much higher.
eu-reserves

Redbook retail sales, Case-Shiller HPI, Chicago PMI, Consumer Confidence, small business borrowing

Growth still depressed, even vs last year’s winter weakness:

redbook-3-31

Same here:

S&P Case-Shiller HPI
sp-jan-table
Highlights
Home prices are firming as the Case-Shiller composite-20 index rose 0.9 percent in January following a 0.9 percent gain in December and a 0.8 percent rise in November. This is the strongest streak for this report since late 2013. Year-on-year, however, prices are still on the soft side, up only 4.6 in January and only fractionally higher than the prior two months.
sp-jan-graph

Bad here too:

Chicago PMI
chicago-pmi-mar
Highlights
Companies sampled in the Chicago PMI report continue to report a lull in activity, at a sub-50 March index of 46.3 following 45.8 in February. On a quarterly basis, the index averaged only 50.5 in the first quarter, down steeply from 61.3 in the fourth quarter for the weakest reading since the third quarter of 2009. Respondents are citing bad weather and fallout from the West Coast port slowdown as temporary negatives, and they see orders picking up during the second quarter. Though the Chicago report, which covers both the manufacturing and non-manufacturing sectors, is often volatile, the last two months of sub-50 readings do confirm other indications of first-quarter weakness for the nation’s economy as a whole. The Dow is moving to opening lows following today’s report.
ism-chicago-graph

Consumer confidence is up even as retail sales growth plummets:

consumer-conf-mar

U.S. small-business borrowing slips in February, up on year: PayNet

By Elvina Nawaguna

March 31 (Reuters) — The Thomson Reuters/PayNet Small Business Lending Index fell to 119.2 last month from 122.4 in January. Still, the index was up 7 percent from February 2014. The index gauges borrowing by firms with $1 million or less in outstanding debt. An increase of 1 percent to 2 percent indicates businesses are borrowing to replace worn out assets, PayNet founder and President Bill Phelan said. Higher readings signal that firms are investing more to increase their production of goods and services. Small businesses account for nearly half of US GDP.