Slow start for April Manufacturing:
ISM Mfg Index

Highlights
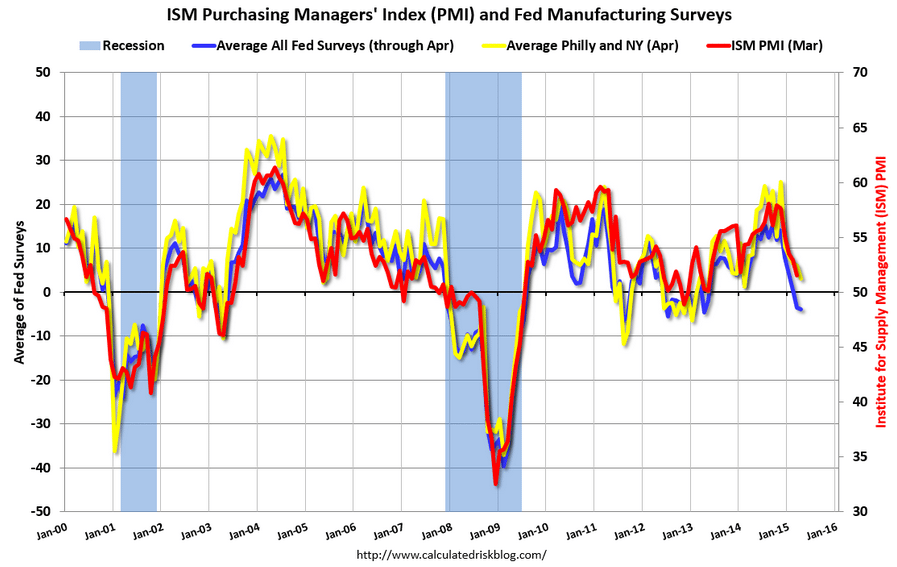
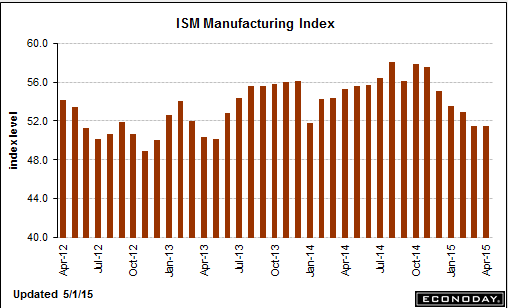
There’s a new unwanted wrinkle in the ISM report and that’s weakness in employment, holding down the headline index to 51.5 in April, unchanged from March. Employment has been holding strong in other reports — but not in the ISM report where the index is down nearly 2 points to a sub-50 level of 48.3 to indicate month-to-month contraction. This is the first time this reading is in contraction since May 2013 and it’s the lowest reading since all the way back in September 2009.
Other indications, however, are positive. New orders actually rose in the month, up 1.7 points to 53.5, and export orders are above 50 for the first time this year, at 51.5 for a 4.0 point gain. Production, at 56.0, is especially strong as are import orders at 54.0 for a 1.5 point gain. Prices, as in other reports, remain in contraction, little changed at 40.5.
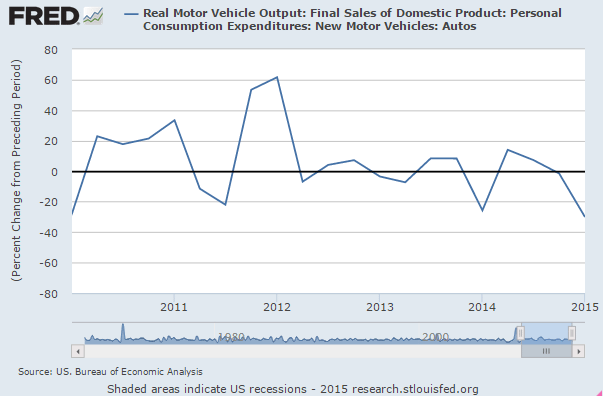
And there’s solid breadth in the report with 15 of 18 industries showing composite growth in the month with strength in the auto industry specifically cited. This report is mixed though the decline in employment won’t be raising expectations for next week’s employment report for April.
Goldman Analyst’s index:

PMI Manufacturing Index
Highlights
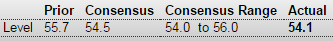
Markit’s sample has been reporting some of the strongest activity of any manufacturing sample, making its otherwise respectable showing at 54.1 in April, down from 55.7 in March, yet another indication of weakness in the sector. Weakness, as in other samples, is centered in exports where orders, for the first time since November, are in outright contraction, the result of the strong dollar’s depressing impact on foreign demand.
Production is the softest it’s been all year, and that of course includes the winter months which, in most data, were hit hard by heavy weather. Deliveries continue to be delayed, the result not of strong demand but, interestingly, of continued issues tied to the long resolved port slowdown on the West Coast.
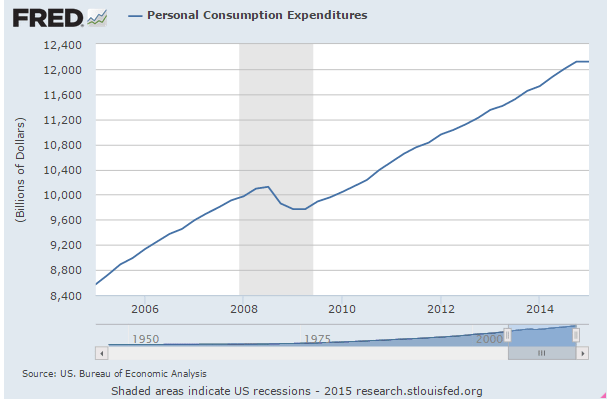
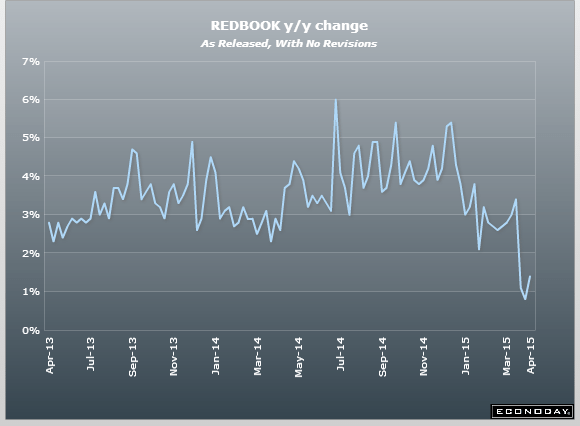
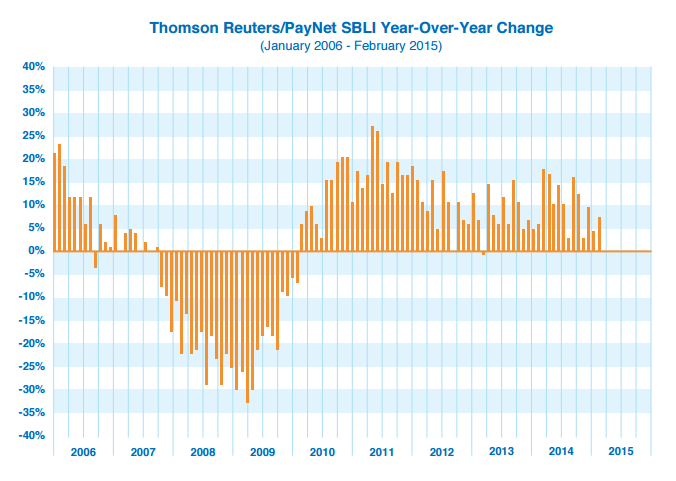
This is one man one vote, not one dollar one vote, which squares this series with soft consumer spending reports:
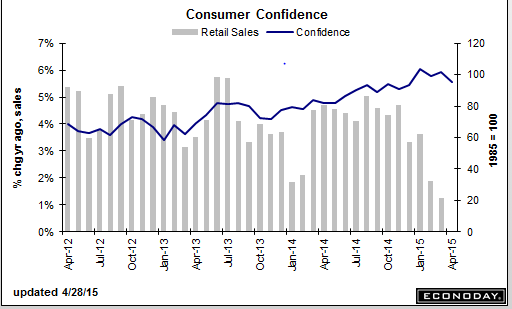
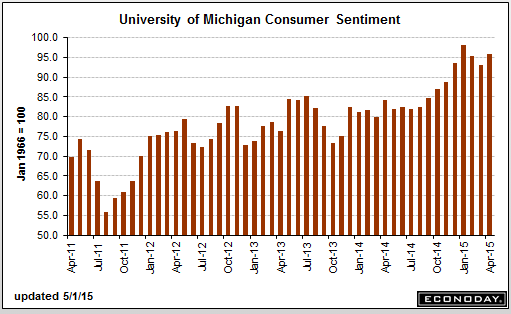
Consumer Sentiment

Highlights
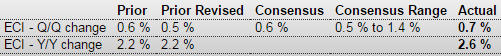
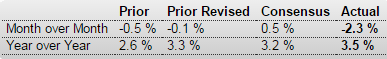
The Federal Reserve in Wednesday’s FOMC statement described consumer confidence as strong, confirmed by today’s consumer sentiment index which came in at 95.9 for final April, unchanged from mid-month April and noticeably higher from 93.0 in final March.
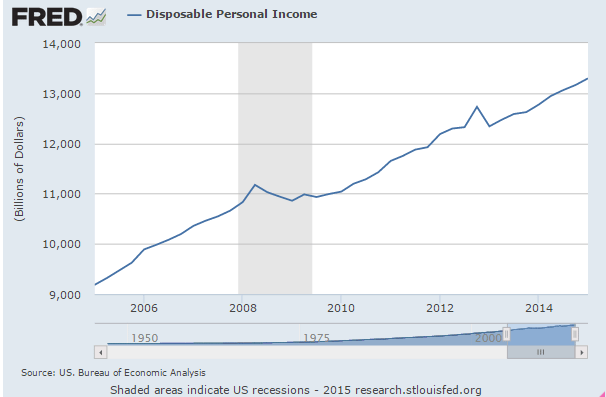
The headline’s two components both show gains with current conditions at 107.0, up 2.0 points from March, and with expectations at 88.8, up 3.5 points. The former points to month-to-month strength for consumer activity while the latter points to confidence in the income outlook, specifically the jobs market.
Inflation readings are very weak in this report, reflecting no doubt the low level of gas prices which however have been on the rise in recent weeks. The 1-year outlook is at 2.6 percent, down from 3.0 percent in March, with the 5-year outlook also at 2.6 percent, down from 2.8 percent.
Fed policy makers are keeping a close eye on inflation expectations and today’s report won’t offer anything to the hawks who want to begin raising rates. And despite the strength in the overall reading, strength in sentiment has yet to translate to strength in spending.
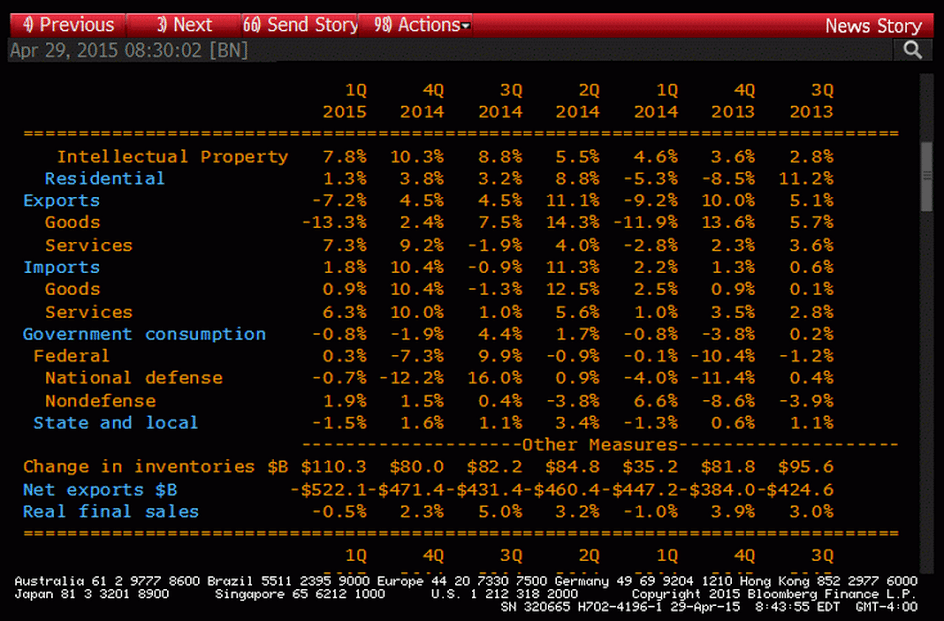
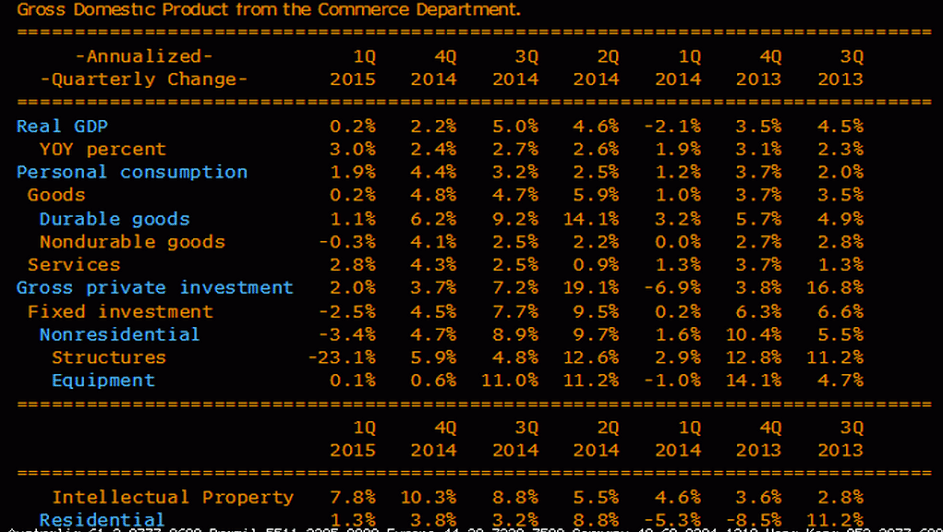
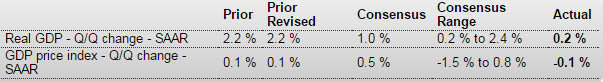
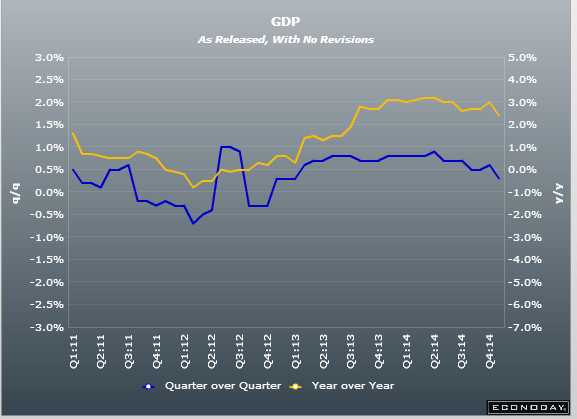
This is just plain bad and a downward reduction to Q1 GDP. And weaker GDP=weaker sales and incomes=that much less spending power going into Q2:
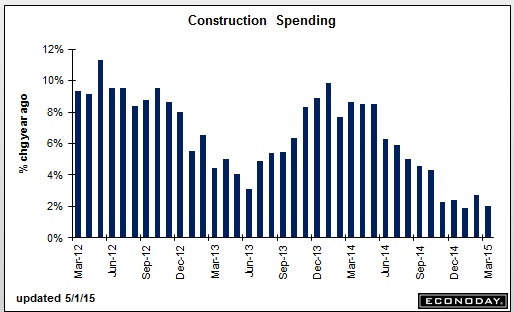
Construction Spending

Highlights
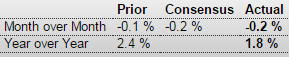
Construction spending once again defied expectations. March construction spending dropped 0.6 percent against expectations of an increase of 0.4 percent. On the year, construction spending was up 2.0 percent, down from February’s annual increase of 2.7 percent. Both residential and public building declined. While weather can still be blamed for some of the decline, a basic weakness in the building sector was apparent.
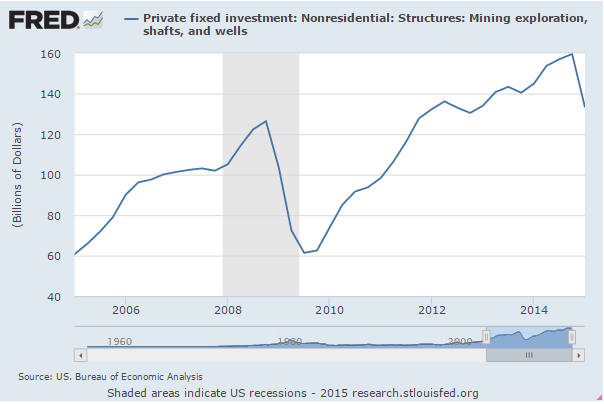
Private residential spending dropped 1.6 percent on the month with both single family and multi-family homes declined. In addition, residential construction excluding new homes, which captures home remodeling, also declined after gains in the previous two months. Nonresidential private construction provided a ray of sunshine — it advanced 1.0 percent on gains in the office, manufacturing, and health care sectors.
Public construction was down for a third straight month to its lowest level since February 2014. State and local government spending, the much larger portion of public construction, dropped in both February and March while Federal Government construction retreated after an 8.6 percent surge in the previous month.