business inventories and sales

Looks to me like business is likely to be cutting output to reduce inventories:

Business Inventories
bi-s-7-14-1
Highlights
Business inventories, up 0.3 percent, rose modestly in May in line with sales which rose 0.4 percent. The stocks-to-sales ratio held unchanged at 1.36. Components show no builds for either factory or retail, which is a plus given softness in both sectors, but a large 0.8 percent build for wholesalers where however sales were strong enough to keep the sector’s stock-to-sales ratio unchanged.

A modest inventory build isn’t a plus for the second-quarter GDP calculation but is a plus for the production and employment outlooks which benefit from lean inventories.
bi-s-7-14-2
Sales don’t look so good either:

bi-s-7-14-3
bi-s-7-14-4

NFIB index, retail sales, Redbook retail sales

When it was going up it made headlines.
On the way down not a word…

United States : NFIB Small Business Optimism Index
er-7-14-1
Highlights
Small business optimism fell very sharply in June, down 4.2 points to 94.1 with 8 of 10 components falling and pointing to weakness for the second half of the year. Earnings, which were the big strength in May, fell 10 points followed by current job openings and the outlook for company expansion which both fell 5 points. The only gainer in the month was inventory plans which rose sharply. Today’s report, like the June employment report, could be a surprise signal for slowing ahead.
er-7-14-2

On track with the general narrative that Q2 isn’t looking any better than Q1, and that we could already be in recession, depending on inventory adjustments and June trade data.

United States : Retail Sales
er-7-14-3
Highlights
The second-quarter suddenly doesn’t look very strong as retail sales for June, showing broad weakness, came in way below expectations, at minus 0.3 percent. Motor vehicles were part of the reason, excluding which sales came in at only minus 0.1 percent. But excluding both autos and gasoline, core sales fell 0.2 percent.

The bounce back for gasoline prices has given gas station sales a lift the last couple of months, up 0.8 percent in June following May’s 3.7 percent surge. And there’s also two strong gains for the key general merchandise category which is up 0.7 percent and 1.4 percent the last two months. Electronic & appliance stores also show a solid gain, up 1.0 percent in June.

But that’s where the good news stops. Auto sales, though still at strong levels, fell 1.1 percent against an unusually strong May. Furniture sales fell 1.6 percent, apparel fell 1.5 percent, building materials fell 1.3 percent, and restaurants fell 0.2 percent.

The fall in restaurant sales doesn’t speak to the strong levels of consumer confidence that are being reported, readings that the Fed has been pointing to as a future indicator of strength for consumer spending. A look at year-on-year sales underscores the complete lack of consumer punch, at only plus 1.4 percent for total retail sales and only plus 2.7 percent for the core. This is a very disappointing report that will cut second-quarter GDP estimates and that will likely push back the outlook for the Fed’s rate hike from September to December, at least for now.

er-7-14-4

er-7-14-5

er-7-14-6
And, coincidentally, the retail sales report’s year over year gain of 1.4% matches the Redbook report:

United States : Redbook
er-7-14-7
Highlights
This morning’s retail sales report for June was very weak as are Redbook’s early indications for July with same-store year-on-year sales up only 1.4 percent in the July 11 week. Redbook’s sales rate, up until March, had trended in the 3 percent range. Still, Redbook sees sales picking up later this month and sees a slight gain compared to June.
er-7-14-8

China trade, Greece comment

More reason to suspect US exports will disappoint and US imports will exceed expectations:
er-7-13-1

Highlights
China’s June merchandise trade surplus was $46.6 billion against expectations of a $55.3 billion surplus. In Yuan terms, exports were up 2.1 percent on the year while imports tumbled 6.7 percent. The first half of 2015 trade balance was CNY1.61 trillion or $263.9 billion. On a seasonally adjusted basis, exports were up 1.1 percent on the year after sliding 1.4 percent in May. Seasonally adjusted imports dropped 9.9 percent after a 14.1 percent plunge.

According to Chinese Customs, expectations are for export growth to rebound in the second half of the year. It noted that the Greek crisis will have some impact on China’s trade – it is hard to quantify just how big an impact there will be.

China sees exports increase 2% in June, imports decline

By Chen Jia and Zhong Nan

July 13 (ChinaDaily)
er-7-13-2
China’s export rose by 2.1 percent year-on-year to 1.17 trillion yuan($188.5 billion) in June, a better-than-expected increase after the 6.4 percent decline in April, according to data from Customs released on Monday.

However, the import figure fell by by 6.7 percent to 890.67 billion yuan last month, leading to an accelerated growth of monthly trade surplus to 45 percent year-on-year.

In the first six months, the country’s total foreign trade value was 11.53 trillion yuan, down by 6.9 percent from a year earlier. Exports increased by 0.9 percent to 6.57 trillion yuan while imports decreased by 15.5 percent to 4.96 trillion yuan.

Trade surplus in the first half rose by 1.5 times from a year earlier to 1.61 trillion yuan, the data revealed.

The structure of trade modes continued to improve when exports of general trade showed marked growth, and strong momentum was spotted in exports to emerging markets and some countries along the “Belt and Road”, said Huang Songping, a spokesman from the Customs department, at a press conference.

China’s bilateral trade with the European Union declined by 6.8 percent during the January-to-June period to 1.67 trillion yuan and trade with Japan fell by 10.6 percent to 832.02 billion yuan, said Hong.

“The Greek debt crisis is likely to influence China’s export, but it is difficult to predict the exact effects,” added Huang.

Varoufakis’ interview in the New Statesman:

Exclusive: Yanis Varoufakis opens up about his five month battle to save Greece

“He said he spent the past month warning the Greek cabinet that the ECB would close Greece’s banks to force a deal. When they did, he was prepared to do three things: issue euro-denominated IOUs; apply a “haircut” to the bonds Greek issued to the ECB in 2012, reducing Greece’s debt; and seize control of the Bank of Greece from the ECB.”

As suspected, he’s was in it over his head.

My response would be to let the banks remain open with circumstances limiting withdrawals to available liquidity. Liquidity might come from earnings on assets, asset sales, and new deposits. The banks would be free, by mutual agreement, to issue IOU’s to depositors who didn’t want to wait for actual euro. The govt might issue IOU’s if it ran out of cash for operating expenses. To ‘seize control of the Bank of Greece from the ECB’ is nonsensical, as there’s nothing there but a computer with a spreadsheet. It would not give Greece the ability to clear funds outside of Greek member banks that are on that spreadsheet. Haircuts to bonds issued to the ECB and reducing Greek debt would also be meaningless in this context.

Wholesale trade

Wholesale Trade
er-7-10-1
Highlights
Wholesale inventories rose a sharp 0.8 percent in May, a much larger-than-expected gain but still in line, though just barely, with sales in the wholesale sector which rose 0.3 percent to keep the stock-to-sales ratio unchanged at a respectably lean 1.29. Inventories relative to sales fell for autos and paper products. Builds were posted in furniture, farm-products, and apparel.

Indications on second-quarter inventories have been favorable, showing balanced growth despite the overhang of the first quarter. Today’s larger-than-expected build may bump up second-quarter GDP estimates slightly.

In the first chart the yellow line is whole sales, which collapsed when oil prices fell enough eliminate capital expenditures that were chasing higher priced oil. The blue line is inventories, which have continued to rise even after sales fell. The textbook narrative where sales lead inventories, with inventories falling after sales fall and production is reduced, is most likely what’s going on here, as evidence that we may already be in recession continues to increase:
er-7-10-2
Sales Y/Y:
er-7-10-3
er-7-10-4

Posted in Oil

macro update

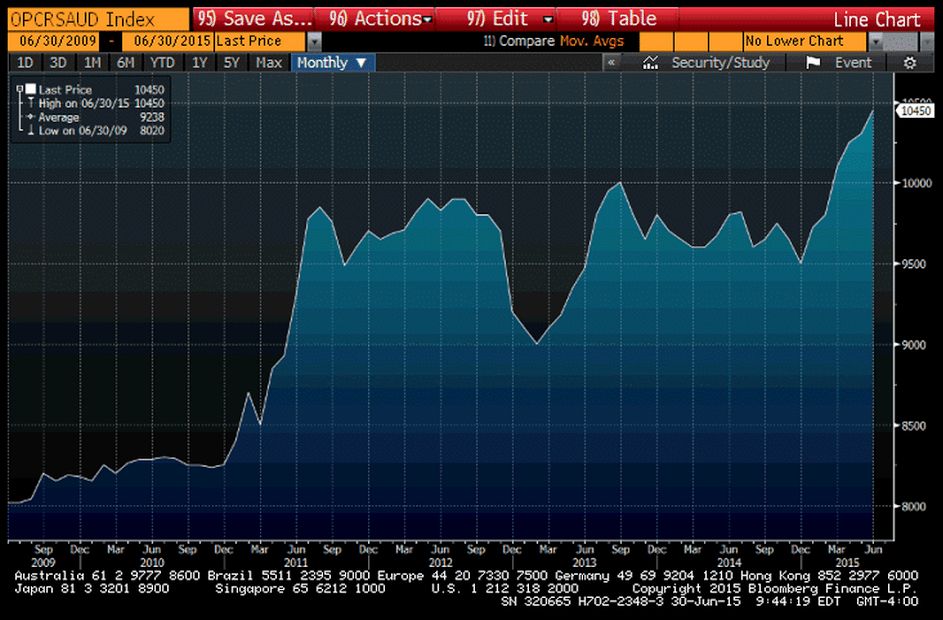
Saudis remain price setter:

saudi-june

Main theme: deflationary biases

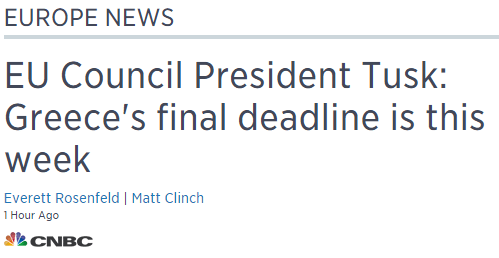
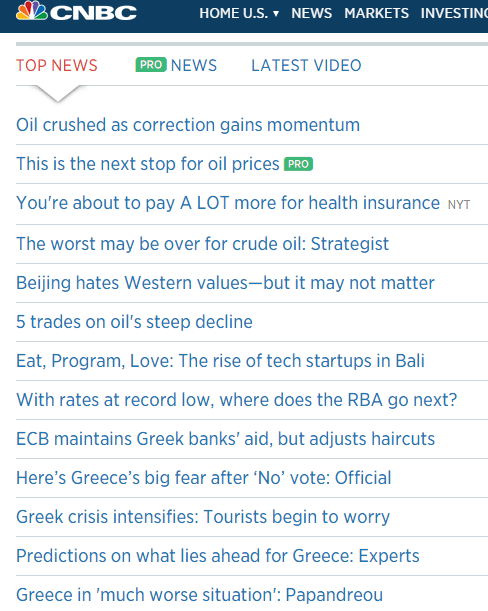
Greece is a deflationary event, as EU aggregate demand is further restricted, with no sign of any possibility of fiscal relaxation.

Oil fell as Saudis increased discounts, further reducing global capex and related asset prices.

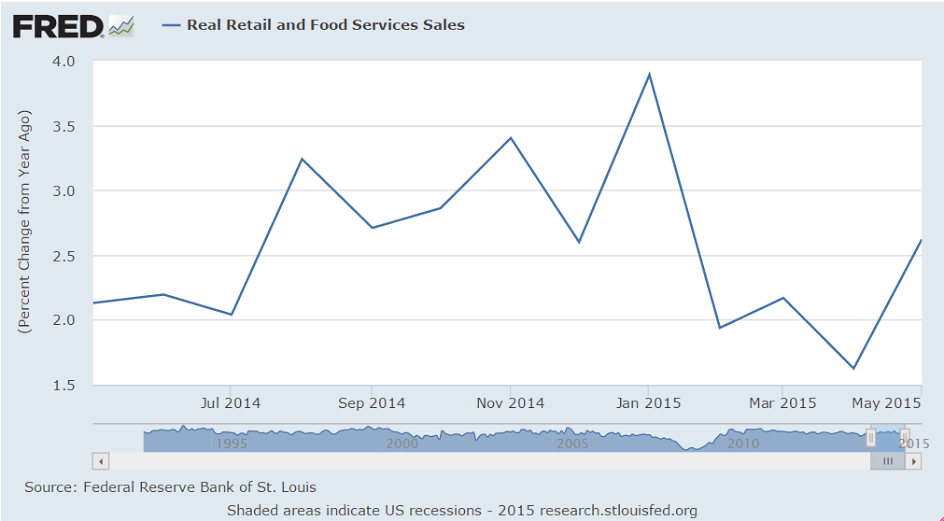
US oil production that gets sold counts as GDP, and for Q3 both production and prices look to be lower. Yes, the lower price also reduces the deflator, but the fall in the price of oil relative to other prices reduces GDP.

The decline in oil prices has also directly lowered income earned from oil sales, royalties, etc. plus ‘multipliers’ as that lost income would have been ‘respent’ etc. This loss has been at least 1% of GDP and completely ignored by analysts who have been over forecasting growth by several % since oil prices declined.

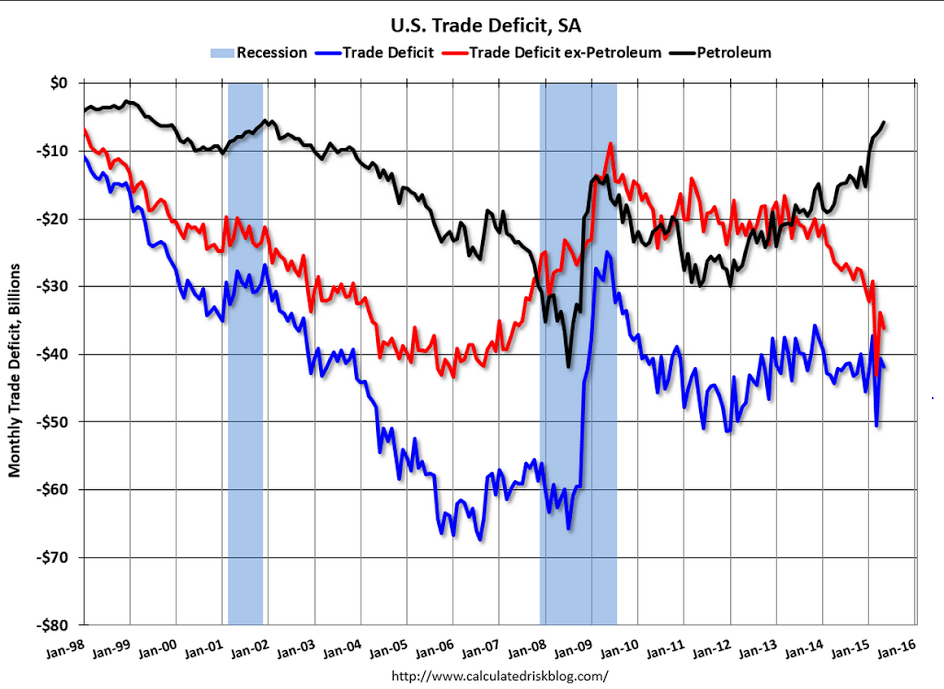
And the more than 50% decline in drilling due to the lower prices = declining production as oil (and gas) output from existing wells declines over time. This means both less GDP and higher imports, a negative bias for the dollar.

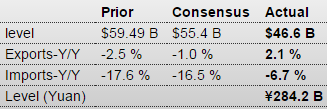
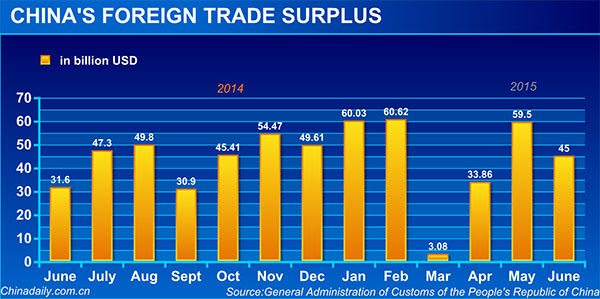
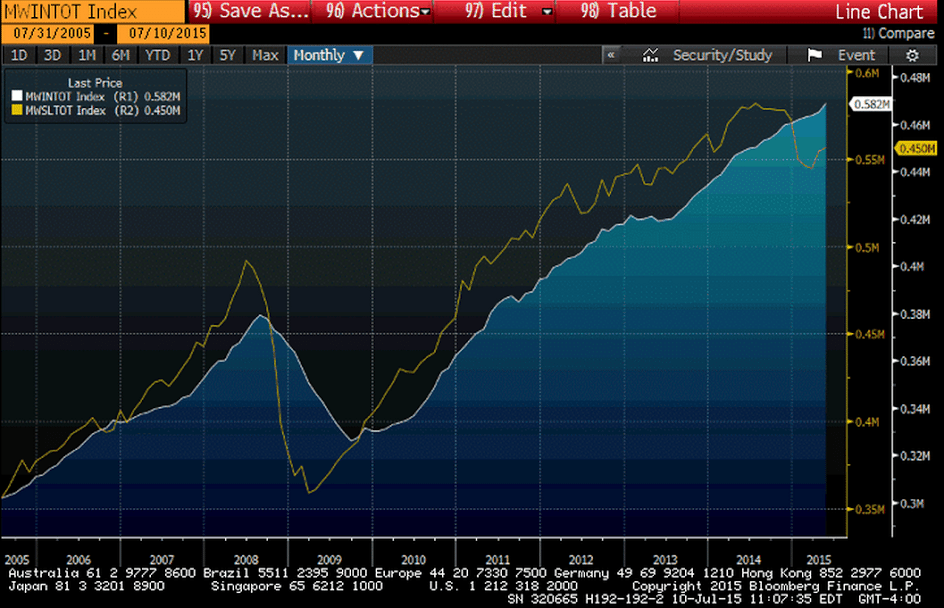
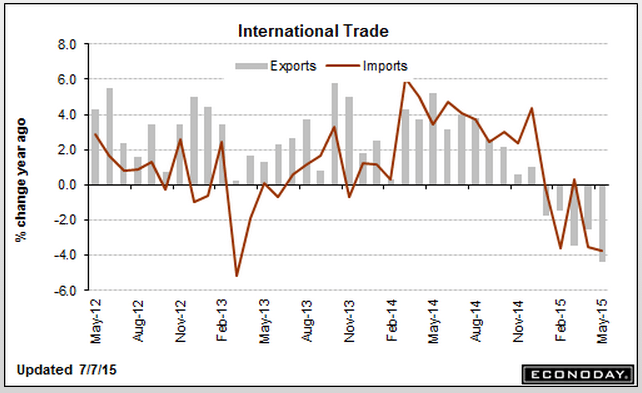
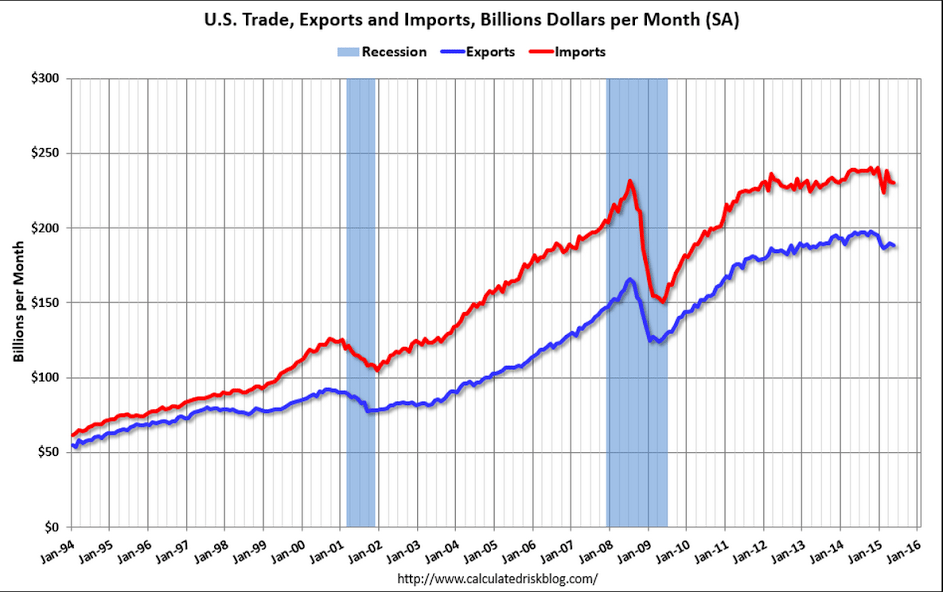
Trade flows remain euro friendly and are taking over the price action, and trade will continue to put upward pressure on the euro until the trade surplus is reversed.

The stronger euro vs the dollar initially helps US stock psychology via earnings translations, etc. but hurts euro zone stocks, exports, GDP, etc. reversing this year’s growth forecasts. And a weaker euro zone economy is also a negative for the US.

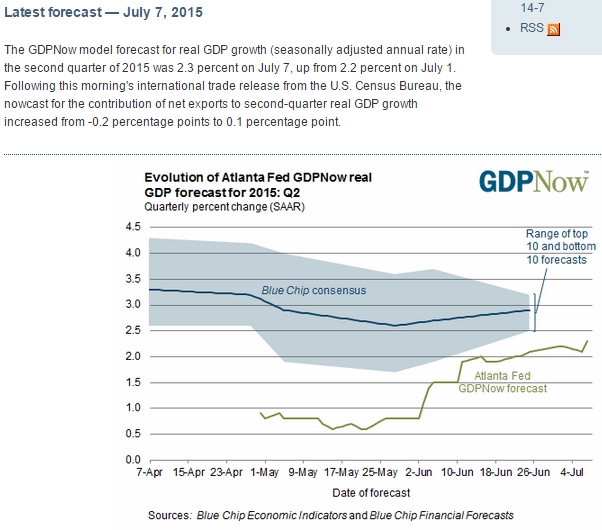
Oil capex is down and not coming back until prices rise, and the US budget deficit is down further as well, and I see nothing else stepping up to replace the reduced private and public deficit spending that was offsetting the demand leakages (unspent income) inherent in the institutional structure that grows continuously. So unlike last year, when oil capex did the heaving lifting, I expect any bounce in Q2 gdp from Q1 to be modest and transitory.

The Fed may raise rates some not because of the state of the economy, but due to fears that current policy somehow risks some kind of financial instability. No discussion, of course, that Japan has had a 0 rate policy for over 20 years with perhaps the highest level of financial stability in the history of the world, perhaps indicating that a 0 rate policy promotes financial stability…

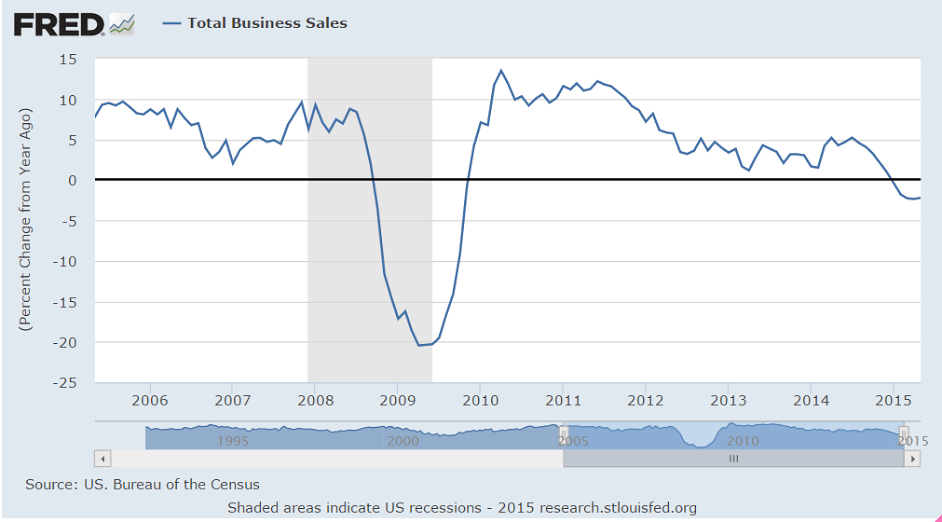
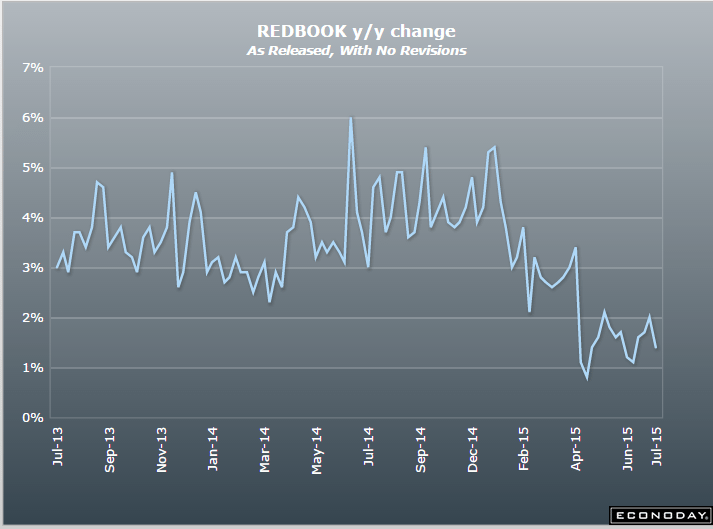
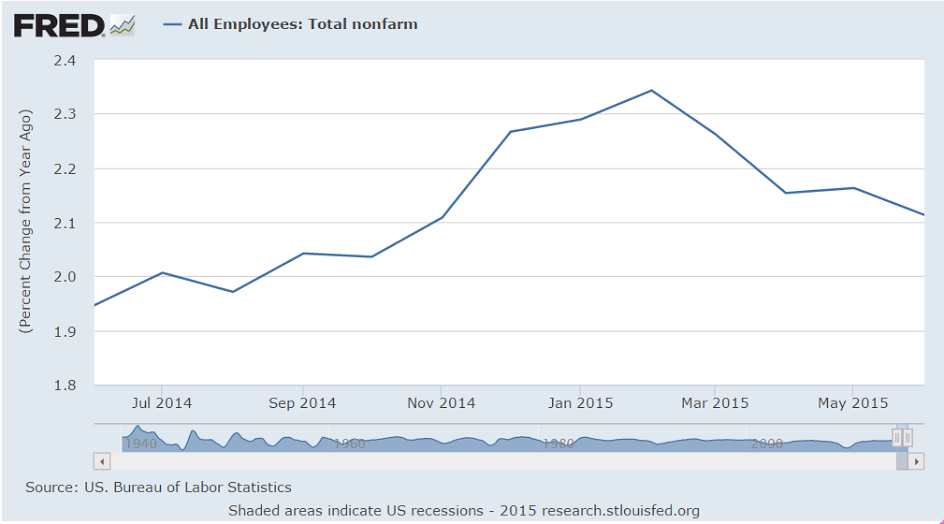
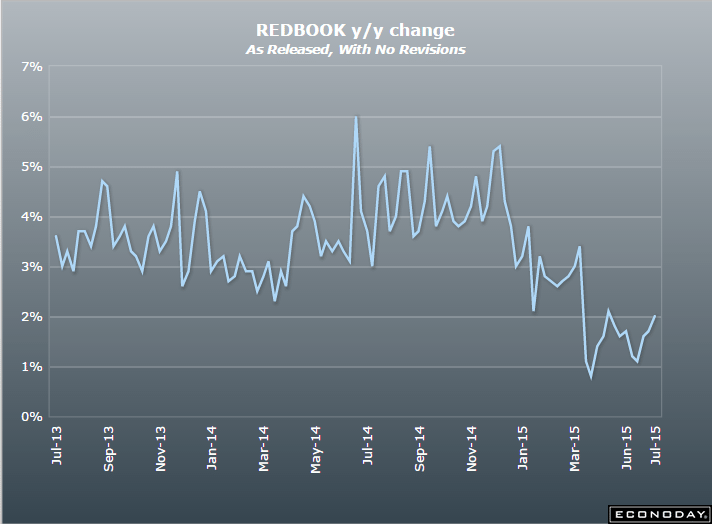
Employment seems to have begun to decelerate as well, with fewer new jobs each month and claims beginning to rise.

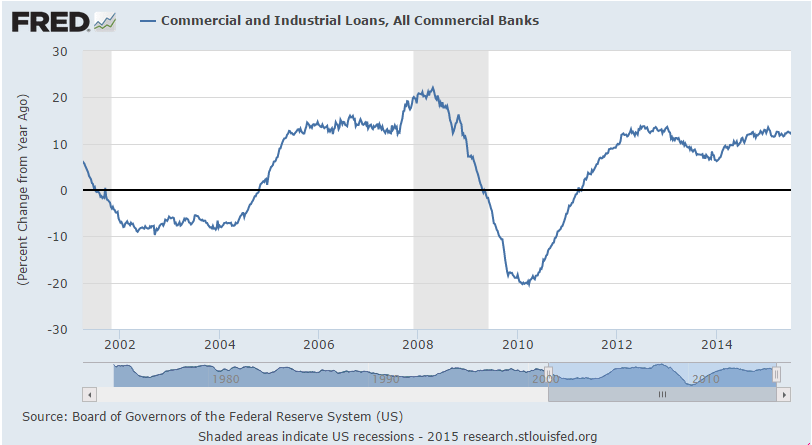
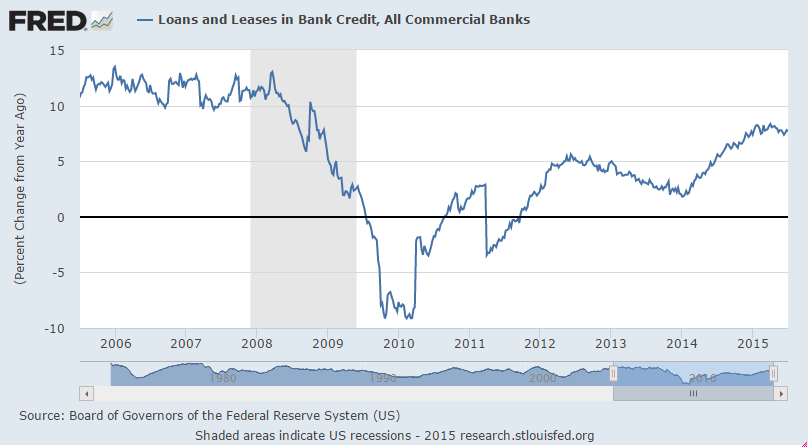
Unlike the last recovery that ended suddenly with a financial crisis that cut off credit, this one is ending with a fall off in aggregate demand from oil capex due to the Saudis cutting oil prices, so the sequence of events has not been the same. But, as always, it’s just a simple unspent income story.

Mtg purchase apps, Consumer credit

The purchase index had a nice increase, more than reversing last week’s decline, as cash purchases have declined and been ‘replaced’ with mortgage financing. There has been a pick up in total sales as well, though applications remain severely depressed and haven’t even recovered to 2013 levels. The July 4 holiday may also have created a distortion:

MBA Mortgage Applications
er-7-8-1
Highlights
Weekly data are often volatile, evident in MBA’s mortgage applications where big gains in the latest week offset big losses in the prior week. The purchase index rose 7 percent in the week with the refinance index up 3 percent. A fall in rates helped the week’s volumes with the average 30-year mortgage with conforming balances ($417,000 or less) down 3 basis points to 4.23 percent.
er-7-8-2

Low than expected and not reflecting an acceleration from Q1.
And note the misleading cheer leading:

Consumer Credit
er-7-8-3

Highlights
The consumer is showing some life. Consumer borrowing rose $16.1 billion in May following an upward revised $21.4 billion in April. Key to this report is the component for revolving credit which is where credit cards are tracked. Revolving credit rose $1.6 billion in May, a moderate gain that follows, however, two very strong gains in April and March. Non-revolving credit, inflated by the student loan subcomponent, rose $14.5 billion in May. Non-revolving gains, however, do reflect gains for vehicle financing.
er-7-8-4
er-7-8-5
er-7-8-6
er-7-8-7

Trade, Atlanta Fed, Redbook sales

Trade deficit a bit higher but looks to me like more to come, including revisions. The petroleum gap is set to widen as US production begins to decline and is replaced by imports. And to my prior point, auto imports were up. And further note that global reductions in trade are associated with recessions:

International Trade
er-7-7-1
Highlights
The nation’s trade gap came in near expectations in May at $41.9 billion, wider than April’s revised gap of $40.7 billion. The goods gap rose by a net $1.2 billion to $61.5 billion, offset in part by a fractionally wider services surplus of $19.6 billion. The petroleum gap narrowed $1.0 billion to $5.8 billion which, reflecting rising domestic oil output together with rising exports of refined products, is the lowest since February 2002.

Exports, which have been pressured by strength in the dollar, fell $1.5 billion to $188.6 billion in May reflecting a $2.4 billion downswing for capital goods and, within this reading, a $1.2 billion downswing in aircraft exports. Exports of nonmonetary gold fell $0.5 billion in the month.

Imports were also down, $0.3 billion lower to $230.5 billion including a $0.8 billion decline in capital goods. Imports of industrial supplies fell $0.6 billion within which imports of crude oil fell $0.4 billion. The decline in crude imports comes despite a more than $4 rise in prices to $50.76 per barrel. Imports of autos rose $0.9 billion in the month.

By country, the gap with China rose $4.0 billion to $30.5 billion with the EU gap down $0.8 billion to $12.5 billion. The gap with Japan narrowed $1.8 billion to $5.2 billion while the gap with Mexico widened slightly to $4.6 billion in the month. And for the first time since 1990, the nation posted a monthly surplus with Canada, at $0.6 billion.

The decline in goods exports is a major concern for the manufacturing sector which is struggling right now with weak foreign demand. The May gap is in line with trend and is not likely to affect GDP estimates.
er-7-7-2
er-7-7-3
er-7-7-4

An uptick to 2.3% based on today’s trade report for May. The first Q2 GDP estimate will be out later this month, and will include an estimate for June trade which won’t come out until the first revision for Q2 GDP comes out:
er-7-7-5
This minor indicator remains depressed, as do other retail sales indicators:

Redbook
er-7-7-6
Highlights
Hot weather triggered demand for seasonal goods in the July 4 week, helping to boost Redbook’s same-store year-on-year sales index by 3 tenths to plus 2.0 percent. But the reading is still soft and does not point to strength for the government’s core retail sales reading (ex-auto ex-gas). May was a very strong month for retail sales which, however, appear to have edged lower since.
er-7-7-7
er-7-7-8