LA Port Traffic, Greek Banks, Recession Without Financial Crisis

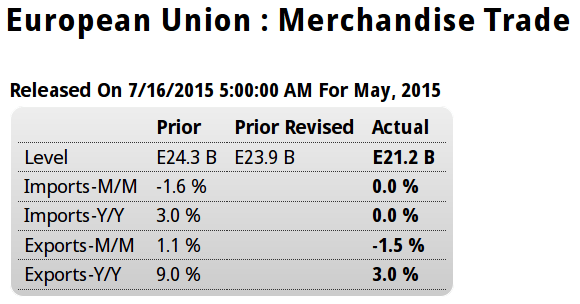
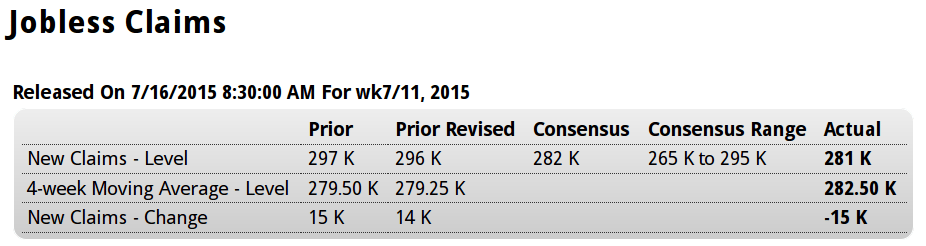
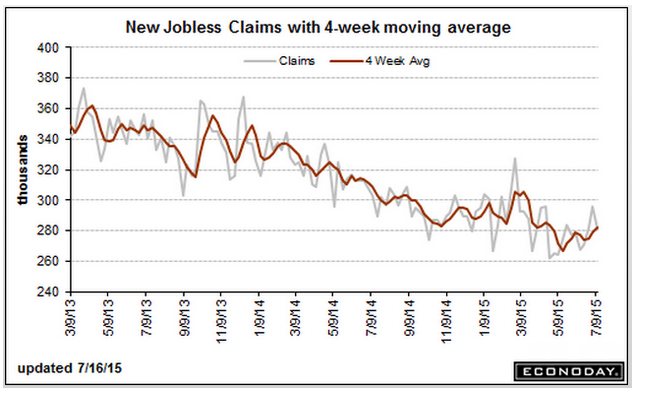
Another weak export report. No mention of the drop in oil prices reduced foreign incomes.

LA area Port Traffic: Weakness in June

by Bill McBride on 7/20/2015 09:57:00 AM

Note: There were some large swings in LA area port traffic earlier this year due to labor issues that were settled on February 21st. Port traffic surged in March as the waiting ships were unloaded (the trade deficit increased in March too), and port traffic declined in April. Perhaps traffic in June is closer to normal.

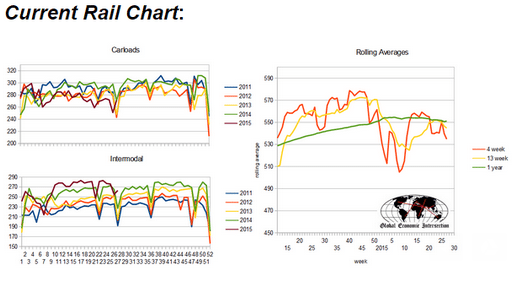
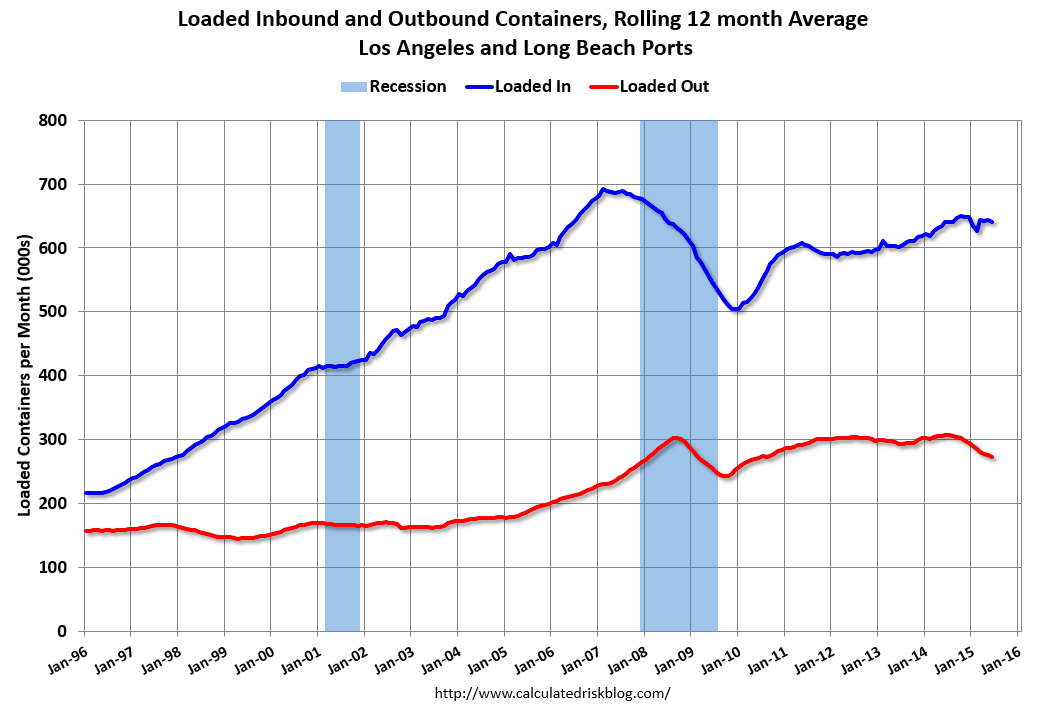
Container traffic gives us an idea about the volume of goods being exported and imported – and usually some hints about the trade report since LA area ports handle about 40% of the nation’s container port traffic.

The following graphs are for inbound and outbound traffic at the ports of Los Angeles and Long Beach in TEUs (TEUs: 20-foot equivalent units or 20-foot-long cargo container).

To remove the strong seasonal component for inbound traffic, the first graph shows the rolling 12 month average.

er 7-20-1

On a rolling 12 month basis, inbound traffic was down 0.4% compared to the rolling 12 months ending in May. Outbound traffic was down 0.9% compared to 12 months ending in May.

The recent downturn in exports might be due to the strong dollar and weakness in China.

Read more at Calculated Risk Blog

Reads like they still don’t have a clue about how banking works:

The Greek government ordered banks to open on Monday, three weeks after they were shut down to prevent the system collapsing under a flood of withdrawals,

That doesn’t cause collapse. Depositors might have to wait for their Euro. That’s all. No reason for the govt. to close the banks. Reads to me like the govt. thinks that Euro needed to run the economy, pay taxes, etc. would leave the country, or something like that. Makes no sense.

As Prime Minister Alexis Tsipras looked to the start of new bailout talks next week.

The first action of the new cabinet was to sign off on a decree to reopen banks on Monday with slightly more flexible withdrawal limits that allow a maximum of 420 euros a week in place of the strict limit of 60 euros a day currently in place.

But restrictions on transfers abroad and other capital controls remain in place.

It’s up to the banks to set their limits based on how much liquidity they have available.

Also:

Three week shutdown of Greece banks cost the economy an estimated €3B, not counting lost tourism revenue – press – Athens Chamber of Commerce and Industry (EBEA) says some 4,500 containers with raw materials and finished products are blocked at customs.

Additionally, €6B in business transactions were frozen by the bank shutdown.- Retailers lost about €600M in business, with apparel taking the main blow. Exporters lost €240M.

Source: TradeTheNews.com

Yes, negative growth and recession sometimes happens without a domestic financial
crisis, and without any financial crisis globally as well.

Lots of things can cause deficit spending- both non government (private sector) and government together- from being insufficient to offset agents desiring to spend less than their incomes.

Sometimes it’s a sudden obstruction to lending and sometimes it’s not.

Sometimes the agents spending more than their incomes just fade away. For a government allowing the deficit to get too small is a political choice, sometimes well informed but most often misguided.

For the private sector it could be insufficient income, or any reason it simply doesn’t want to borrow to spend or spend from savings.

And the private sector tends to be pro cyclical. That is, should GDP growth decline, private sector borrowing to spend tends to taper as well, as credit worthiness deteriorates, causing the slowdown to get worse. This downward process continues until some agent starts spending more than its income, which historically is government, as tax revenues fall and transfer payments increase with rising unemployment from the downward spiral.

So looks to me like it was the oil capex that was keeping up with the demand leakages, and when that collapsed as prices fell the demand leakages got the upper hand. And so far no sign of anything else stepping up its spending enough to move the GDP needle.

Rail Traffic and Credit Check


Rail Week Ending 11 July 2015: Back to Contraction

Econintersect: Week 27 of 2015 shows same week total rail traffic (from same week one year ago) contracted after expanding last week according to the Association of American Railroads (AAR) traffic data. Intermodal traffic expanded year-over-year, which accounts for approximately half of movements – but weekly railcar counts continued in contraction.

er 7-18-2

Rate of growth still declining:

er 7-18-3

Slow steady growth continues, but no sign of acceleration yet:

er 7-18-4

er 7-18-5

er 7-18-6

Housing Starts, Consumer Sentiment

The increase is entirely a multi family story, and multi family dwellings are cheaper/smaller than single family:


er 7-17-1

Highlights

Strong demand for apartment units drove housing starts & permits data far beyond expectations, overshadowing less strength for the key single-family home category. Starts came in near the top of expectations, up 9.8 percent in June at a 1.174 million annual rate, but reflect a 29.4 percent surge in the multi-family component. The single-family component actually fell 0.9 percent. The same pattern appears for permits which jumped 7.4 percent overall to a much higher-than-expected 1.343 million rate but here too multi-family units rose 15.3 percent with single-family up far less but at a still very strong 0.9 percent.

Regional data, where the separation between single-family homes and multi-family units is not broken out, show special strength for the South which is by far the largest region for housing. Starts in the South rose 13.5 percent in June with permits up 10.4 percent. Permits in the West are also strong, up 9.5 percent, though starts in the region fell 6.0 percent. Also of note is an outsized 35.5 percent surge in Northeast starts.

The unusual rise for multi-family units reflects high levels of rent, evident in today’s CPI report. The single-family component is less strong though the 0.9 percent rise in permits does point to strong second-half activity for the new home sector. This report is very solid but just not as spectacular as the headlines suggest.

er 7-17-2

er 7-17-3

Negative surprise here:


er 7-17-4

Highlights

Consumer sentiment is softening this month, to 93.3 in the mid-month July reading which is below Econoday’s low estimate for 94.5. The current conditions component is down nearly 3 points to 106.0 in an early reading for July that points to another month of weakness for consumer activity. The expectations component fell a bit less to 85.2 which is still very respectable for this reading and points to confidence in the jobs outlook.

Inflation data, as Federal Reserve policy makers have been predicting, are inching higher with 1-year expectations at 2.8 percent and 5-year expectations at 2.7 percent, both up 1 tenth in the month.

Consumer sentiment has been running very strong most of this year and often well ahead of consumer spending readings which have been flat. But today’s report suggests that the best for confidence may already have passed.

er 7-17-5

Atlanta Fed, 2004 vs 2015 US data, EU trade

The Atlanta Fed forecast as of July 14 is was +2.3% annualized for Q2, which is far below initial estimates of most professional forecasters, and below their current forecasts as well, and likely to be lowered further due to recent data.

The first government estimate for Q2 GDP will be released on July 30th. June trade numbers will not be released until August, and it looks to me like May was a zig that could zag in June and could cause a downward revision to Q2 GDP.

Inventories also look high to me which means a correction would further reduce Q2 GDP, and the low productivity numbers and decelerating employment reports tell me business is overstaffed for the current pace of sales and likely to adjust accordingly as well.


er 7-16-7

The economy before the 2004 rate hikes vs now:


er 7-16-8

Another strong surplus:


er 7-16-9

Highlights

The seasonally adjusted trade balance returned another healthy surplus in May. At E21.2 billion the black ink was short of April’s slightly downwardly revised E23.9 billion but still above the E20 billion mark for the fourth time so far this year.

The deterioration in the headline reflected a 1.5 percent monthly fall in exports, their first drop since January. Imports were flat. Annual growth of the former was 3.0 percent and of the latter 0.0 percent.

At E2.6 billion the average surplus in April/May was 6.4 percent above its first quarter mean which points to a probable small positive contribution from total net exports to second quarter real GDP growth. Quite apart from the weakness of the oil market, the current soft level of the euro should help to ensure continued strong trade data over the rest of 2015.

er 7-16-10

This is just the euro area, also in surplus:


er 7-16-11

Italy in surplus as well:


er 7-16-12

Highlights

The seasonally adjusted trade balance was in a E4.3 billion surplus in May following a marginally larger revised E3.6 billion excess in April.

The headline gain was mainly attributable to stronger exports which rose 1.5 percent from April, their third increase in the last four months. Much of this came courtesy of a 28.4 percent jump in the energy sector excluding which exports were up only 0.6 percent. Consumer goods (2.2 percent) had a good period but intermediates were only flat and capital goods were weak (minus 0.3 percent). Compared with May 2015 exports were 2.0 percent stronger.

Imports fell a monthly 0.3 percent, largely due to a 5.3 percent slump in energy although capital goods also struggled (minus 0.9 percent). Annual import growth was 0.5 percent.

Claims, Phili Fed, Housing index

Down a touch but the 4 week moving average still moving higher:

er 7-16-1

Highlights

Auto retooling is clouding initial jobless claims data which fell 15,000 in the July 11 week to 281,000. But the 4-week average, inflated by a 14,000 spike in the prior week, rose 3,250 to a 282,500 level that’s more than 5,000 above the month ago comparison. The rise in the average is not a positive indication for the July employment report.

But the latest on continuing claims, which are reported with a 1-week lag, are very favorable, down a very steep 112,000 to 2.215 million in the July 4 week which is a new recovery low. Nevertheless, the 4-week average, down 3,000 to 2.264 million, is trending slightly higher than the month-ago comparison. The unemployment rate for insured workers is down 1 tenth to a recovery low of 1.6 percent.

July, with its closings in the auto sector, is always a difficult month for claims data. Next week’s report will be especially important as initial claims will cover the sample week for the monthly employment report.

er 7-16-2

Not at all good:

er 7-16-3

Highlights

It turns out that the Philly Fed’s big jump in June was in fact a one-time wonder as the index slowed substantially in the July reading to 5.7 from 15.2. Growth in new orders is still respectable, at 7.1, but well down from June’s 15.2. Likewise, shipments slowed to 4.4 from 14.3 while backlog orders fell into contraction at minus 6.3 from plus 3.7. Employment also fell into contraction, at minus 0.4 from 3.8.

The June reading for this report stood alone as really the only strong indication this year on the manufacturing sector, but the give back now in July puts the Philly Fed in line with other readings. The nation’s manufacturing sector is being held down by weak exports and is a drag on economic growth.

er 7-16-4

Housing still a bit of a bright spot, relatively speaking, but still very low and depressed, and too small to move the GDP needle. And there are fewer builders:


er 7-16-5

Highlights

The housing market index, unchanged in July at 60, is signaling substantial strength for the new home market. This is the strongest reading since November 2005.

Future sales, at 71, lead the report with present sales right behind at 66. Still lagging is traffic, down 1 point in the month to 43 and reflecting a lack of first-time buyers in the market.

All regions are showing growth led by the West at a composite 63 followed by the South at 62. The Midwest is at 59 and the Northeast, which had been under 50 for a long run, is now at 52.

The new home market is accelerating and is in place to be the best surprise of the 2015 economy. Housing starts & permit data, which have been volatile but very strong, will be posted tomorrow.

er 7-16-6

Fed Testimony

Semiannual Monetary Policy Report to the Congress

By Janet Yellen

Looking forward, prospects are favorable for further improvement in the U.S. labor market and the economy more broadly. Low oil prices

Still seems to leave out the fact that a dollar saved by the buyer of oil is a dollar lost by the seller.

And ongoing employment gains should continue to bolster consumer spending, financial conditions generally remain supportive of growth,

Yes, but the growth rate of lending has only been relatively modest and stable

And the highly accommodative monetary policies abroad should work to strengthen global growth.

Low and negative rates and quantitative easing now have a very long history of not resulting in increased aggregate demand.

In addition, some of the headwinds restraining economic growth, including the effects of dollar appreciation on net exports and the effect of lower oil prices on capital spending, should diminish over time.

Yes, but the question is what will replace the lost capital spending? Without that incremental capital expenditure, growth, at best, stagnates and likely goes negative as the ‘demand leakages’ continue to grow.

Also, the weakness in U.S. exports is partially the consequence of lower oil prices as reduced U.S. expense for imported oil = reduced income available to non residents to import U.S. goods and services. And the decline in global oil capital expenditures works against global growth and U.S. exports as well.

As a result, the FOMC expects U.S. GDP growth to strengthen over the remainder of this year and the unemployment rate to decline gradually. As always, however, there are some uncertainties in the economic outlook. Foreign developments, in particular, pose some risks to U.S. growth. Most notably, although the recovery in the Euro area appears to have gained a firmer footing,

That’s due to the weak Euro helping their exports. You can’t have it both ways- if the dollar becomes less of a headwind for the U.S., the Euro will become less of a tailwind for the EU.

The situation in Greece remains difficult. And China continues to grapple with the challenges posed by high debt, weak property markets, and volatile financial conditions. But economic growth abroad could also pick up more quickly than observers generally anticipate, providing additional support for U.S. economic activity.

This again assumes lower rates and quantitative easing are accommodative, particularly in the EU and China

The U.S. economy also might snap back more quickly as the transitory influences holding down first-half growth fade and the boost to consumer spending from low oil prices shows through more definitively.

Again, still assumes lower oil prices are a net positive.

mtg purch apps, Empire survey, industrial production

Still up from last year this time but seem stalled out at relatively low levels and Q2 not any better than Q1:

United States : MBA Mortgage Applications
er-7-15-1
Highlights
Weekly data are often volatile and it’s hard making much of the last two weeks of purchase applications data which plunged 8.0 percent in the July 10 week after spiking 7.0 percent in the prior week. Put together, the purchase index has slipped 1.4 percent in the two weeks which is a negative signal for home purchases. The refinance index rose 4 percent in the week. Rates were little changed in the week with the average 30-year mortgage for conforming loans ($417,000 or less) unchanged at 4.23 percent.
er-7-15-2

Not encouraging and yet another reference to weak US exports:

United States : Empire State Mfg Survey
er-7-15-3
Highlights
The manufacturing sector isn’t picking up any steam this month based on the Empire State index which came in only just above zero, at 3.86. The new orders index, ominously, is in negative ground at minus 3.50. This is the fourth negative reading in five months for new orders which points squarely at slowing overall activity in the months ahead.

And hiring this month has slowed, to 3.19 vs June’s 8.65 in yet another soft signal. Price data show moderation for inputs at 7.45 vs 9.62. One plus in the report is a slight uptick in the 6-month outlook to 27.04 vs 25.84.

Hit by weak exports, the manufacturing sector is dragging down U.S. growth. Watch Thursday for the Philly Fed report for July which, in what may prove to be an outlier, showed surprising strength in June.
er-7-15-4

Not good, and another reference to weak US exports:

United States : Industrial Production
er-7-15-5
Highlights
A plus 0.3 percent rise in June industrial production looks respectable but still overstates strength. The gain follows two prior months of sizable contraction, at minus 0.2 percent and minus 0.5 percent, and reflects a jump higher for utilities and for mining. Manufacturing, and the key component for the series, is unchanged for a second straight month — truly dead in the water at a year-on-year rate of only plus 1.8 percent.

Motor vehicle production is very weak
in the June report, down 3.7 percent and more than offsetting a 0.8 percent rise for hi-tech production, a 0.7 percent gain for chemicals, and a 1.4 percent jump for furniture. Retail sales of vehicles surged back in May but turned lower in June which doesn’t point to much of a rebound for vehicle production later this summer.

One sign of strength is a 2 tenths uptick in the overall capacity utilization rate to 78.4 percent. But here too, the gain reflects gains for utilities and mining and not manufacturing where capacity utilization actually fell 1 tenth to 77.2 percent.

This report offers the first conclusive data on the manufacturing sector during June while this morning’s earlier release of the Empire State report offers the first anecdotal look at July. And the verdict? A manufacturing sector that is being hurt by weakness in exports and that’s dragging down the economy’s growth.
er-7-15-6

er-7-15-7

er-7-15-8