Capex Cuts, Mtg Purchase Apps

Volkswagen to Pare, Delay Capital Investments

Oct 6 (WSJ) — Volkswagen AG plans to slash an €86 billion ($96 billion) investment plan and step up cost-cutting as it grapples with fallout from its emissions scandal, Chief Executive Matthias Müllersaid on Tuesday.

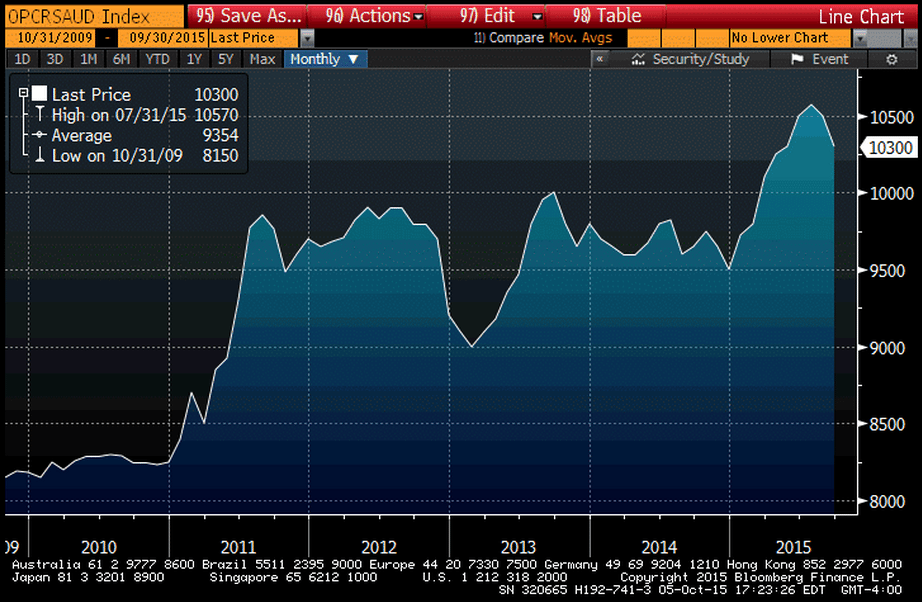
Global Oil to Cut Spending by $130 Billion, OPEC Says

Germany : Industrial Production
er-10-7-1
Highlights
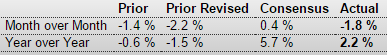
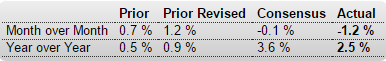
Industrial production was weaker than expected in August. A 1.2 percent monthly fall exactly reversed an upwardly revised gain in July but with base effects favourable, annual seasonally and workday adjusted growth was boosted from 0.9 percent to 2.5 percent.

The monthly headline decline reflected worryingly broad-based losses. Hence, capital goods output was down 2.1 percent, consumer goods 0.4 percent and intermediates were only flat. Energy decreased 1.4 percent and construction was off 1.3 percent.

Despite August’s setback average industrial production in July/August was still 0.4 percent above its mean level in the second quarter. However, output will need to expand 0.5 percent in September for the third quarter just to match the previous period. As such, the likelihood is that goods production provided at best only a limited boost to real GDP in July-September which in turn increases the risk of a disappointingly sluggish increase in whole economy output.

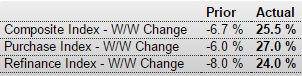
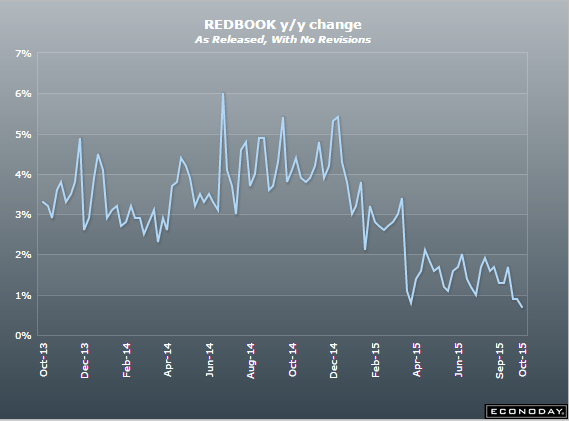
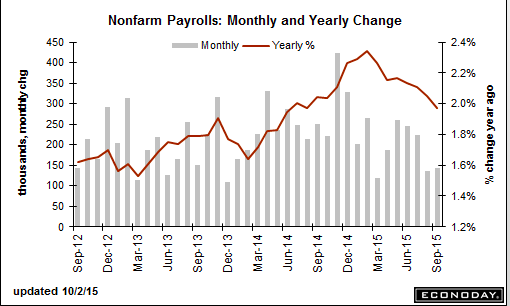
Up big but front loaded:

“The number of applications for purchase and refinance mortgages soared last week due both to renewed rate volatility and as many applications were filed prior to the TILA-RESPA regulatory change,” said Lynn Fisher, the MBA’s vice president of research and economics.

The change is part of a move by federal regulators to further protect borrowers by forcing lenders to disclose all details of a loan at least three days prior to closing; it went into effect October 3rd.

MBA Mortgage Applications
er-10-7-2

Exports, News Headlines, Atlanta Fed, German Comment

They say its the strong $ that’s hurting exports.

I say it’s the drop in oil related capex after the price collapse:

er-10-6-2-1
er-10-6-2-2

This is what news headlines have been looking like (not good):

er-10-6-2-3
er-10-6-2-4
From Rüdiger (top German Specialist) research:

German new business orders for August were broadly lower. Compared to July, which was revised downward, they fell a seasonally adjusted 2.1pc. Compared to August 2014 orders rose 3.4pc.

However, there are two critical factors behind this figure. First, there was a huge positive base effect at work. Eliminating this statistical quirk orders would have been down an annual 0.2pc. Second, orders were helped by large scale orders for other vehicles“ (chiefly aircraft). Stripped for these orders the picture is even bleaker. It shows that the firming euro exchange rate has already significantly slowed orders from non-EMU countries.

The bottom line is that today’s order figures support our notion that the German economy is moving closer to recession.

Saudi Oil Production, US Trade, Gallup Index, Redbook Retail Sales, German Manufacturers’ Orders

Their price cuts reported yesterday indicate they’d like to pump more:
er-10-6-1
Gap widening as previously suspected, even with lower oil prices:

International Trade
er-10-6-2
Highlights
A surge in imports of new iPhones helped feed what was an unusually wide trade gap in August of $48.3 billion, well up from July’s revised $41.8 billion. But cell phones, at $2.1 billion, make up only a portion of the gap with a drop in exports the most salient factor. Exports were down nearly across the board including industrial supplies at minus $2.2 billion, consumer goods at minus $0.6 million, autos at minus $0.5 million, and foods/feeds/beverages at minus $0.3 million. Weakness in exports reflects weakness in foreign demand together with the strength of the dollar.

The goods gap came in at $67.9 billion, which is up from last week’s advance reading of $67.2 billion. The petroleum gap, which is always a central factor in the nation’s deficit, fell to $6.9 billion from July’s $8.1 billion and reflects lower prices. Demand for the nation’s services, unlike its goods, continues to climb, to a surplus of $19.6 billion vs $19.5 billion in a reflection of demand for technical and managerial services.

By country, the gap with China, the main source of iPhones, rose sharply, to $35.0 billion from $31.6 billion. The gap with Mexico widened to $5.3 from $3.4 billion. Other bilateral data are mostly steady though the gap with the EU narrowed to $13.8 from $15.2 billion.

Imports are a subtraction on the national accounts but are, nevertheless, a two-way street, that is reflecting demand at home which is a sign of economic strength, not weakness. Still these results will limit expectations for third-quarter GDP.
er-10-6-3
Gallup US ECI
er-10-6-4
Highlights
Unlike other confidence readings that are climbing, Gallup’s reading is holding at lows, at minus 14 in September vs August’s minus 13. The report cites losses in the stock market and disappointing jobs data as negatives, offset by low prices at the gas pump. For current conditions, 24 percent of the sample rates the economy as excellent or good vs 31 percent rating it as poor. For expectations, 38 percent say the economy is getting better vs 58 percent who say it’s getting worse.

Just when you think it can’t get any worse:

Redbook
er-10-6-5
Highlights
Retail sales are looking very soft based at least on Redbook’s sample which has been reporting, mostly in contrast to solid government data, soft results since way back in March. Same-store sales are up only 0.7 percent for the October 3 week which is the weakest Redbook reading of the year. The report doesn’t offer any meaningful commentary on the weakness but does say seasonally cooler weather is now helping sales at specialty and department stores.
er-10-6-6

Germany under pressure as well:

Germany : Manufacturers’ Orders
er-10-6-8
Highlights
Manufacturing orders were weaker than expected in August. A 1.8 percent monthly fall followed a steeper revised 2.2 percent drop in July and constituted the first back-to-back decline since January/February. However, with orders down a particularly hefty 5.3 percent a year ago, annual growth still rebounded sharply to stand at 2.2 percent.

The monthly decrease was led by capital goods which were down fully 2.8 percent. However, weakness was broad-based as consumer and durable goods dropped 1.5 percent and basics were off 0.4 percent.

Regionally domestic orders contracted 2.6 percent after a 3.7 percent bounce at the start of the quarter and, ominously, have now declined in four of the last five months. Overseas demand fell 1.2 percent, compounding July’s 6.1 percent slump and would have looked a lot worse but for the surprising robustness of the Eurozone component which posted a 2.5 percent gain following a 0.6 percent increase last time. Orders from the rest of the world fell 3.7 percent having already nosedived 10.1 percent in July.

August’s setback means that average total orders in July/August were 2 percent below their mean level in the second quarter. The new manufacturing PMI pointed to solid growth of both output and orders in September but readings here have proved overly strong in recent months. Although early days yet, there are good reasons for supposing that the economic recovery has lost some momentum and hopes for a rebound this quarter are looking somewhat optimistic.

Capex Revision, Gallup Spending Survey, PMI, ISM Non Mfg Index

A gauge of U.S. investment plans slipped more in August than initially estimated, giving a cautionary sign for the economic outlook.

New orders for non-military capital goods outside of aviation fell 0.8 percent in August, the Commerce Department said on Friday.

The government had previously reported that this gauge, which is a leading indicator of business investment, had fallen 0.2 percent during the month.

Shipments of this category of goods also fell, declining a sharper-than-initially reported 0.4 percent and giving a bearish signal for third-quarter economic growth.

New orders for overall U.S. factory goods fell 1.7 percent in August, Friday’s report showed. Analysts had expected new orders for factory goods to fall 1.2 percent.
er-10-5-1

Yet another consumer spending chart that shows it’s been going down since the drop in oil prices that most insisted would cause a sharp increase:
er-10-5-2
The ‘Markit’ surveys aren’t all that credible but do make news:
er-10-5-3
Also lower than expected and more credible, and indicates to me the service sector is now following the manufacturing sector that’s already gone negative. Interesting how the ‘Highlights’ narrative below sees it otherwise:

ISM Non-Mfg Index
er-10-5-4
Highlights
Understandable slowing in new orders and business activity, which have been extraordinarily strong in the two prior reports, pulled down ISM’s non-manufacturing index to a still very solid 56.9 in September.

One component, however, that did not slow and which, had it been released last week, would have sent the wrong signal for the employment report is a 2.3 point jump in the employment index to 58.3. This, together with July’s 59.6, are some of the strongest readings in the 18-year history of this series and a puzzle given softness in the government’s payroll data.

Readings throughout this report are very strong including backlogs which have been building for four straight months and new export orders which have been rising for five months (note that foreign demand for U.S. services has proven very resilient at the same time that foreign demand for U.S. goods has been declining sharply.) The price indication in this report shows slight contraction in contrast to other surveys where price contraction is very sharp.

This report, together with the services PMI released earlier this morning, underscore the fundamental domestic-based strength of the U.S. economy.
er-10-5-5

And now the Fed’s own labor market indicator is suggesting weakness as well:

er-10-5-6

Saudi Price Cut, Domestic Car Sales, Commercial Paper

This is how they would start a downward price spiral if that’s what they wanted:

Saudi Aramco Cuts Crude to Asia, U.S. Amid Weak Demand

By Anthony Dipaola

Oct 4 (Bloomberg) —Saudi Arabia cut pricing for November oil sales to Asia and the U.S. as the world’s largest crude exporter seeks to keep its barrels competitive with rival suppliers amid sluggish demand.
Saudi Arabian Oil Co. reduced its official selling price for Medium grade crude to Asia next month to a discount of $3.20 a barrel below the regional benchmark, compared with a $1.30 discount for October sales, the company said in an e-mailed statement. The discount for the Medium grade to Asia, the main market for Saudi crude, widened by the most since the state-owned company made a $2 a barrel cut in February 2012, according to data compiled by Bloomberg.

Doesn’t look so good (Imports aren’t part of GDP):
er-10-3-1
er-10-3-2

Here’s the foreign car sales:
er-10-3-3
Even total sales don’t look all that stellar.

The growth rate has to match the prior year growth rate to make the same contribution to GDP:
er-10-3-4
er-10-3-6
er-10-3-7

The rest of the bank lending charts haven’t updated yet. Will post when I get the updates.

Employment, Atlanta Fed, Draghi comments

A shocker for most analysts/entirely in line with my narrative of insufficient deficit spending-public or private-to offset unspent income, aka demand leakages. And it’s only going to get worse until appropriate fiscal adjustments are implemented. The cut in oil capex, which was the only thing supporting growth after the tax hikes and sequesters, triggered a downward spiral, with lower employment, lower income, and lower spending working it’s way through the economy.

Employment Situation
er-10-2-1
Highlights
Forget about an October rate hike and maybe forget about a December one too. The September employment report came in weaker than expected on all scores with nonfarm payroll at 142,000, well under the low estimate for 180,000. To seal the matter, downward revisions to the two prior months total 59,000. Average hourly earnings also came in below the low end estimate, at an unchanged reading and a year-on-year rate of 2.2 percent which is also unchanged. And the labor market is shrinking! The labor participation fell 2 tenths to a nearly 40 year low of 62.4 percent.

Note how it all went bad after oil prices collapsed:
er-10-2-2
Back down to .9% on reduced exports, and soon to go lower with the employment revisions:
er-10-2-3
Managing expectations as they rearrange the deck chairs on the Titanic…:

ECB President Mario Draghi Says Eurozone Returning to Growth After Policy Moves

Oct 2 (WSJ) — ECB President Mario Draghi said the eurozone had returned to “sustained growth, under the impulse of our monetary policy.” The results were “good news for everybody, everywhere,” he said. Mr. Draghi said the eurozone accounts for 17% of global GDP and 16% of global trade, so the strength of the eurozone was critical to maintain at a time of uneven global growth. “The progress achieved over the past three years to stabilize and strengthen the euro area is real,” he said. “Growth is returning. The way forward is well identified. And we will not rest until our monetary union is complete.”

Auto Sales

Just over 18 million which is stronger than expected, with continuing ‘pent up demand’ from the sales collapse that started in 08. Lots of imports and import content, so not going to do much for GDP. Back to levels of 10 years ago, but the population is also about 15% higher. September included the labor day weekend this year, and so analysts anticipate a reduced selling rate going forward:

VS-1
VS-2

Auto stocks don’t seem impressed:
VS-3
VS-4

VS-5
VS-6

Posted in GDP

Bank capital and lending comment

So the idea is that with higher capital ratios banks are less prone to ‘get in trouble’.

So let’s say minimum capital requirements go from 8% to 10%. Most banks try to stay about 1% over the limit to be safely compliant.

That means that when requirements were 8%, most banks had 9% to be ‘safe’ and with 10% required, banks are at 11% to be ‘safe’

Now let’s say today’s banks have losses of 2% of capital, which brings them down to 9%, 1% under the new limit. When that happens is the regulators call it a ‘troubled bank’ and suspend new lending until ‘good standing’ is restored. And cessation of bank lending triggers a general, downward, pro cyclical credit contraction.

In other words, the increase in capital requirements didn’t prevent the same 2% drop in capital from having the same negative effect.

Yes, the increased capital may help to protect ‘tax payer money’ to some degree should banks be liquidated, but it does nothing to protect the macro economy from a contractionary pro cyclical downward spiral.

And all it takes is a drop in asset prices to shut down lending, a risk I pointed out late last year when oil prices collapsed. Stocks were the cheapest source of borrowing for many, and with that equity evaporating that lending contracts. Lending vs commodities related collateral also contracts. etc.

Challenger Job Cuts, Claims, ISM Manufacturing, Construction Spending

Looks like it started trending higher after oil prices collapsed:
er-10-3
Nothing happening here yet, I suspect it’s at least partially about restrictions on eligibility, etc.
er-10-4
Bad:

United States : ISM Mfg Index
er-10-1-5
Highlights
The ISM index, like nearly all other September indications, is pointing to trouble for the factory sector. At 50.2, the index is at its lowest point since May 2013. New orders, at 50.1, are at their lowest point since August 2012. Backlog orders, at a very low 41.5, are in their fourth month of contraction and won’t be giving manufacturers much breathing room to keep up production. Export orders, at 46.5, are also in their fourth month of contraction and are a key factor behind the general weakness.
er-10-6

July revised down .3 and August .1 higher than expected. And the elevated year over year growth rate is vs a dip last year. Looking at the chart below you can see the rate of growth has resumed at the lower, prior levels, and that the level of spending spending, which is not inflation adjusted, remains below prior levels, and on an inflation adjusted basis construction remains depressed. Not to mention the spike in permits, exacerbated by NY tax breaks that expired June 15, seems to have reversed:

United States : Construction Spending
er-10-1-7
Highlights
Construction spending is picking up, at plus 0.7 percent in August for a year-on-year gain of 13.7 percent. Construction of single-family homes rose a solid 0.7 percent in the month with continuing gains certain given strength in permits. Multi-family construction, driven by rising rents, jumped 4.8 percent in the month and is up 25 percent year-on-year. The year-on-year gain for single-family homes is lagging but is still very strong at 14.0 percent.

Gains were also posted in private non-residential construction, at 0.2 percent following July’s 1.6 percent jump, with gains continuing to be centered in manufacturing in strength that belies other indications of weakness in business investment. Year-on-year, non-residential construction is up 17 percent. Public construction remains subdued with year-on-year gains in related components in the mid-single digits.

Strength in construction, including strength in new homes, looks to offset not only unevenness in existing home sales but also what appears to be a breaking down in the factory sector.
er-10-8
er-10-9
er-10-10