Saudi oil pricing, import and export prices, Japan Manufactures’ sentiment

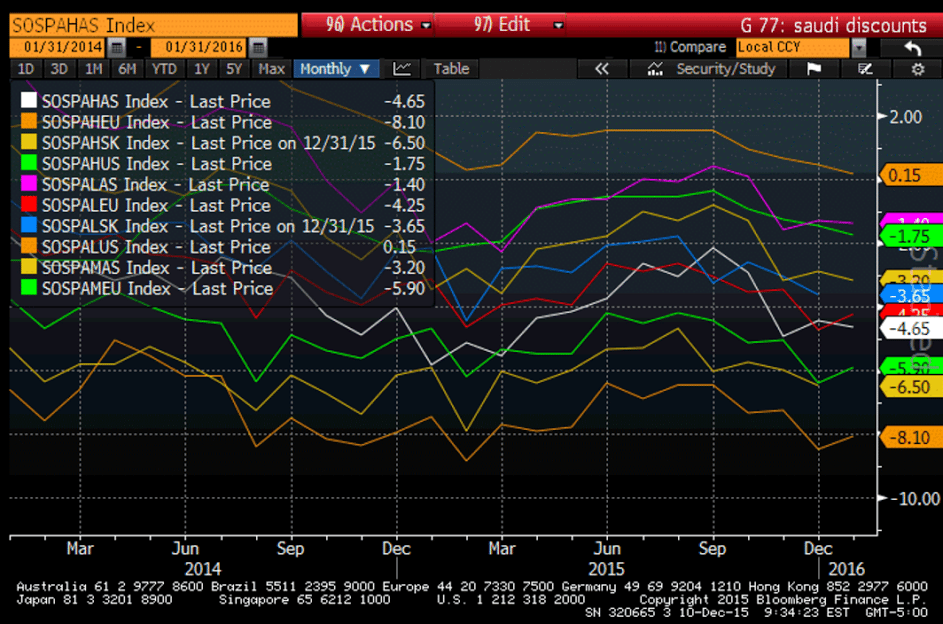
Not a lot of change for January, most ‘discounts’ still at or near the wides, so price action likely to be more of same:
er-12-10-1
Something the Fed takes into consideration:

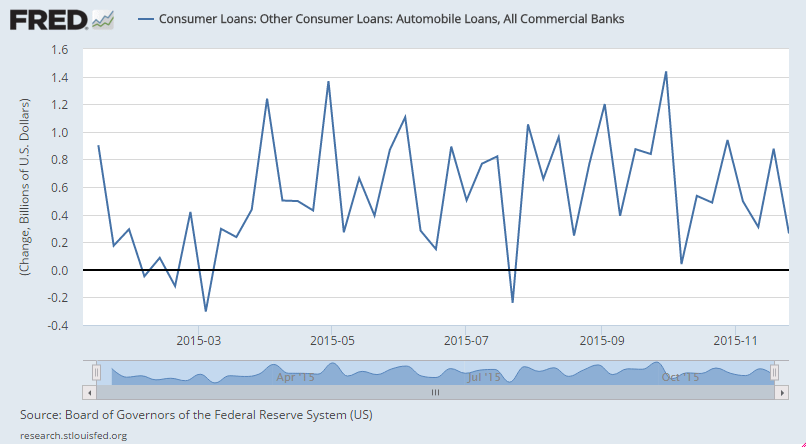
Import and Export Prices
er-12-10-12
Highlights
Cross-border price pressures remain negative with import prices down 0.4 percent in November and export prices down 0.6 percent. Petroleum fell 2.5 percent in the month but is not an isolated factor pulling prices down as non-petroleum import prices fell 0.3 percent in the month. Agricultural exports are the wildcard on the export side and they fell a sizable 1.1 percent but here too, the deflationary pull is widespread with non-agricultural export prices down 0.6 percent.

Year-on-year contraction is perhaps less severe than prior months but not by much. Import prices are down a year-on-year 9.4 percent with non-petroleum import prices at minus 3.4 percent. Import prices from Canada are down the heaviest, at minus 18.0 percent on the year, with Latin America next at minus 12.7 percent. Showing the least price weakness are imports from China at minus 1.5 percent. Export prices are down 6.3 percent on the year with non-agricultural prices down 5.7 percent.

Of special concern are continuing incremental decreases for prices of finished goods, both imports and exports. Federal Reserve policy makers have been waiting for an easing drag from low import prices, not to mention oil prices as well, with neither yet to appear. Contraction in import prices not only reflects low commodity prices but also the strength of the dollar which has been giving U.S. buyers more for their dollars.

Japan big manufacturers’ mood worsens in Q4

Dec 10 (Reuters) — Big Japanese manufacturers’ sentiment worsened in October-December, a government survey showed. The business survey index (BSI) of sentiment at large manufacturers stood at plus 3.8 in October-December, compared with plus 11.0 in July-September, according to the joint survey by the Ministry of Finance and the Economic and Social Research Institute, an arm of the Cabinet Office, released on Thursday. The BSI measures the percentage of firms that expect the business environment to improve from the previous quarter minus the percentage that expect it to worsen.

Retail hiring, Alaska

November Retail Hiring Falls To 4-Year Low – 5% Fewer Than One Year Ago

er-12-9-5
As it says, Alaska is not alone, as spending cuts and tax increases due to the oil price collapse continue into next year:

Alaska governor proposes first income tax in 35 years

Dec 9 (AP) — Alaska Gov. Bill Walker is proposing instituting a personal income tax for the first time in 35 years as the oil-dependent state looks to plug a multibillion-dollar budget deficit amid chronically low prices.

In laying out his budget plan Wednesday, Walker also proposed using the fund that provides annual checks to most Alaskans to generate a stream of cash to help finance state government. The plan would change how dividends are calculated and mean lower checks, at least initially — with 2016 payouts about $1,000 less than this year’s.

Alaska isn’t alone among oil-producing states to experience hard times as oil prices stay low. But unlike states like Texas or Louisiana, Alaska has few other industries to make up the difference.

Walker’s proposal also includes:
—Adding a dime to every drink of alcohol and $1 per pack of cigarettes.

—Additional budget cuts.

—Changes to the oil tax credit system, a big budget item.

—Increases to industry taxes including mining, fishing and oil.

Mtg apps, US wholesale trade

Maybe up from a year ago, but for the last several months flat to down and still at depressed levels:

United States : MBA Mortgage Applications
er-12-9-1
Highlights
The purchase index was little changed in the December 4 week, up 0.04 percent to an unusual second decimal place as published by the Mortgage Bankers Association. Year-on-year, however, the gain is robust with no decimals offered, at plus 29 percent. The refinance index, measured as usual with one decimal place, rose 4.0 percent in the week. No matter how many decimal places MBA may or may not use, the approaching readings for the purchase index will be interesting to watch as they will cover the reaction, if any, to next week’s pending rate hike by the Fed. The average rate for 30-year fixed mortgages with conforming balances ($417,000 or less) rose 2 basis points in the week to 4.14 percent.
er-12-9-2

Nothing good here, sales flat and inventories down a very small amount as sales/inventory stays way too high:

United States : Wholesale Trade
er-12-9-3
Highlights
Wholesale inventories fell 0.1 percent in October against no change for sales, keeping the stock-to-sales ratio for this sector unchanged at 1.31. Wholesale inventories are on the heavy side as this ratio is well up from 1.22 this time last year. Year-on-year, inventories are up 3.6 percent which is well ahead of a 3.7 percent decline for sales.

Inventory builds reflecting falling sales include metals and autos, though strong sales of the latter at the retail level point to a bounce back for related wholesale sales. Inventory draws reflecting rising sales include furniture, apparel, and farm products.

Businesses including wholesalers watch their inventory levels carefully, limiting unwanted overhang as much as they can especially when sales are slow. The decline in October inventories, together with a sizable 3-tenth downward revision to September to plus 0.2 percent, may be negatives for third-quarter GDP but are positives for the production and employment outlooks. Watch Friday for the business inventories report which will include data from the retail sector.
er-12-9-4

Draghi quote, Euro purchasing power parity, Small business index

“Often wrong but never in doubt”?
;)

Quote from Mario Draghi:

But there is no doubt that if we had to intensify the use of our instruments to ensure that we achieve our price stability mandate, we would. There cannot be any limit to how far we are willing to deploy our instruments, within our mandate, and to achieve our mandate. And indeed the European Court of Justice has stated that the ECB must be allowed “broad discretion” when it “prepares and implements an open market operations programme”.

I can say therefore with confidence – and without any complacency – that we will secure the return of inflation to 2% without undue delay, because we are currently deploying tools that we believe will achieve this, and because we can, in any case, deploy our tools further if that proves necessary. “

More evidence the euro is fundamentally cheap:
er-12-8-2

And yet another weak release:

NFIB Small Business Optimism Index

er-12-8-1

Consumer Credit, Oil comment

Looks like the last blip up just got reversed so it continues to go nowhere and it’s at levels higher than before the last recession:

Consumer Credit
er-12-7-6
Highlights
Revolving credit barely made it into the plus column in October, up $0.2 billion for what is, however, an eighth straight gain. Non-revolving credit, which in contrast to revolving credit hasn’t posted a decline since April 2010, rose an intrend $15.8 billion, once again boosted by vehicle financing and also by student loans which are tracked in this component. But the gain on the non-revolving side couldn’t offset the flat result for revolving credit as total consumer credit rose a lower-than-expected $16.0 billion in October. The slowing in the revolving component may not be pointing entirely to consumer caution but may reflect a lack borrowing demand given the strength in the jobs market and the savings rate and also of course low gas prices which are leaving more money in consumer pockets. Still, the pause for revolving credit won’t be lifting expectations for holiday spending.

er-12-7-7
er-12-7-8

No telling how low prices will go before Saudi sells their entire output capacity estimated at 12 million bpd. Right now they are at 10 million bpd and prices have to go low enough for other suppliers to cut back or demand to increase. And here comes Iran:

“It is going to be 12 to 18 months before they see any relief,” David Fyfe, from the oil trading group Gunvor, said.

“We think oil stocks will continue to build in the first half of next year and we don’t think they will draw down to normal levels until well into 2017.”

Mr Fyfe said Iran has 40m to 50m barrels floating on tankers offshore that will flood onto the market as soon as sanctions are lifted. It will then crank up extra output to 500,000 b/d by the end of next year.

Labor market conditions index, Euro and yen charts, Fed discussion

This is the Fed’s own index and it’s on the very weak side:

Labor Market Conditions Index
er-12-7-1
Highlights
Friday’s employment report, led by a 211,000 rise in non-farm payrolls, was solid but didn’t give the labor market conditions index much of a boost, coming in at only plus 0.5 vs expectations for plus 1.7. The October index, however, was revised 6 tenths higher to plus 2.2 reflecting in part the upward revision to that month’s nonfarm payroll growth which now stands at a very impressive 298,000. After dipping in the spring, this indicator, despite November’s soft outcome, is now on a seven-month winning streak.

Do you really want to bet against a currency with this kind of trade balance (surplus) and teetering on deflation? Looking like the yen fundamentals used to look when it was the strongest currency in the world, before the tsunami closed the nukes and the surplus turned to deficit? ;)
er-12-7-2
er-12-7-3
er-12-7-4

er-12-7-5
Fed comment:

The Fed uses models that use oil futures as indicators of the future price of oil, so they are currently forecasting a rise in oil prices and therefore a rise in inflation,vwhich feeds into their decision regarding interest rate policy.

Unfortunately, the FOMC doesn’t seem to understand the difference between the analysis of perishable vs non perishable commodities, and therefore they don’t recognize the higher oil futures prices express the cost of storage, rather than an indicator of future spot prices.

Rail traffic, Credit check, Employment flows, State and local taxes and expenditures

Rail Week Ending 28 November 2015: Contraction Growing Faster. Rail Traffic in November Down 10.4%.

Week 47 of 2015 shows same week total rail traffic (from same week one year ago) declined according to the Association of American Railroads (AAR) traffic data. Intermodal traffic contracted year-over-year, which accounts for approximately half of movements and weekly railcar counts continued in contraction. The 52 week rolling average contraction is continuing to grow. Rail counts for the month of Novembers showed a significant contraction.

Looks like the growth in car loans has been slowing?
er-12-5-11

er-12-5-10

er-12-5-9

Same here?
er-12-5-8
Real estate loan growth has been moving up even as total loan growth has not.

Perhaps banks are increasingly demanding real estate as collateral from borrowers:
er-12-5-7

er-12-5-6

Consumer loan growth has also increased a bit even as total loan grow has not:
er-12-5-5
So this is interesting- looks like approximately 4 million people who were not considered in the labor force, and therefore not counted as unemployed, have been getting jobs every month…
er-12-5-4
And also each month over 4 million people have left their jobs and left the labor force and are therefore not considered unemployed:
er-12-5-3
Lower growth of state and local govt tax receipts indicates lower growth of private sector spending as well as lower growth of state and local spending, which has already been low:
er-12-5-12

er-12-5-1

Comments on Draghi NY Speech

Excerpts from the Speech by Mario Draghi, President of the ECB, Economic Club of New York, 4 December 2015:

There is no particular limit to how we can deploy any of our tools.

True- limits are political

And in this context it is important to recall that we operate under a clear framework of monetary dominance – we are ultimately driven by our mandate of maintaining price stability.

True

Indeed, it is inevitable that unconventional policy settings, ranging from negative interest rates to purchases of a broad range of assets, can have unintended consequences on allocation and distribution.

Yes, and as they function like taxes to remove euro net financial assets from the private sector, they can have the (presumably) unintended consequences of reducing aggregate demand, reducing ‘inflation’, and, likewise, fundamentally causing the euro to appreciate and further exacerbate the other unintended consequences.

In the selection of our policy tools, we aim to minimise the extent of such distortions, which is why, for instance, we have so far focused our asset purchases as much as possible in the most liquid and generic asset classes.

But there is no doubt that if we had to intensify the use of our instruments to ensure that we achieve our price stability mandate, we would.

Yes, however removing more euro removes more aggregate demand, is deflationary, and further supports the euro.

As the carpenter said about his piece of wood, ‘no matter how much i cut off it’s still too short’

There cannot be any limit to how far we are willing to deploy our instruments, within our mandate, and to achieve our mandate. And indeed the European Court of Justice has stated that the ECB must be allowed “broad discretion” when it “prepares and implements an open market operations programme”.

True, potentially they can perform the miracle of making the blind man lame, so to speak…

I can say therefore with confidence – and without any complacency – that we will secure the return of inflation to 2% without undue delay, because we are currently deploying tools that we believe will achieve this, and because we can, in any case, deploy our tools further if that proves necessary.

As the Bank of Japan, after 20 years of similar policy, and the Fed after 7 years of similar policy have continued to say with regard to meeting their inflation targets, after 6 years Draghi also repeats:

We just need a little more time to allow our monetary policy to kick in…

:(

Payrolls, Trade

The growth rate continues to decelerate (see chart):

NFP

er-12-4-1

Highlights
Payroll growth is solid and, though wages aren’t building steam, today’s employment report fully cements expectations for December liftoff. Nonfarm payrolls rose a very solid 211,000 in November which is safely above expectations for 190,000. And there’s 35,000 in upward revisions to the two prior months with October now standing at a very impressive 298,000. The unemployment rate is steady and low at 5.0 percent with the participation rate less depressed, up 1 tenth to 62.5 percent.

But earnings data are not impressive, up a monthly 0.2 percent vs October’s outsized 0.4 percent gain. And the year-on-year rate for average hourly earnings is down 2 tenths to 2.3 percent.

Payroll data show a 46,000 jump in construction where activity right now is very strong. This follows construction gains of 34,000 and 19,000 in the two prior months. Trade & transportation, reflecting activity in the supply chain, is also very strong with November and October gains of 49,000 and 46,000. Payrolls are also on the rise in retail trade, up 31,000 and 41,000 the last two months to indicate that retailers are gearing up aggressively for this holiday season. One negative, however, is a 12,000 dip in temporary help services which nearly cuts in half the prior month’s 28,000 gain. Demand for temporary services is considered a leading indicator for permanent hiring.

And weekly hours slipped in the month, down 1 tenth to 34.5 hours. Data on manufacturing are flat and point to little change for November production. And one negative in the report is a 1 tenth uptick to 9.9 percent for the broadly defined U-6 unemployment rate which had, however, dropped sharply in the prior months.

Despite soft spots and though earnings are flat, this report confirms that the nation’s labor market is solid and growing and, for the Fed, it supports arguments for the beginning of policy normalization.
er-12-4-2

U6 still well above pre recession levels:
er-12-4-3
Export weakness- much of it, as previously discussed, is oil related as oil exporting states cut back on spending and foreign oil capex declines as well- is beginning to dominate. Also, as previously discussed, falling US oil production and rising gasoline consumption are beginning to increasingly offset the drop in price for oil related imports.

In other words, all considered, the drop in oil prices is causing the negative trade gap to widen rather than narrow as most expected.

This makes the oil price collapse fundamentally a negative for the $US rather than a positive.

International Trade
er-12-4-4
Highlights
The nation’s trade deficit came in at the high end of expectations in October, at $43.9 billion with details reflecting oil-price effects but also soft foreign demand. Exports fell 1.4 percent in the month while imports, pulled down by oil, fell 0.6 percent. The decline for goods exports, at 2.5 percent, is in line with last week’s advance data but not for imports where goods declined 0.6 percent, vs the advance reading of minus 2.1 percent. Exports of services are once again solid at plus 0.7 percent.

Low prices for oil held down imports of both crude and industrial supplies. Imported crude averaged $40.12 per barrel in the month vs $42.72 in September and, in a reminder of the commodity price collapse, vs $88.47 a year ago. Turning to finished goods, however, imports do show gains with capital goods up as well as autos and consumer goods. Country data show a narrowing with China to $33.0 billion, which ends five straight months of widening, and a widening with the EU to $13.4 billion.

This report is mixed, confirming weakness abroad but showing some life at home. But, with exports down, the data do point to a slow start for fourth quarter GDP.