Philly Fed, leading indicators, jobless claims

Another bad one, and supports the possibility of another downward revision to industrial production next month:

Philadelphia Fed Business Outlook Survey
er-2-18-1
Highlights
The Philly Fed report, much like Tuesday’s Empire State report, is pointing to continuing trouble for the nation’s factory sector. The general business conditions index came in at minus 2.8 to extend a long run of negative readings. New orders, at minus 5.3, have also been stuck in the minus column as have unfilled orders, at minus 12.7. Shipments, at plus 2.5, are positive for a second straight month but aren’t likely to hold above zero for very long given the weakness in orders. Employment is in the contraction column for a second straight month at minus 5.0 with the workweek also posting a second month of contraction at minus 12.9. Manufacturers in the region continue to draw down inventories, to indicate sagging expectations, with the 6-month outlook down nearly 2 points to 17.3 which is still in the plus column but very low for this reading. Price data continue hold in the negative column. This report is a disappointment and belies yesterday’s manufacturing strength in the industrial production report.

er-2-18-2
Hard to imagine from this chart that the US isn’t already in recession:
er-2-18-3
This series is biased towards positive numbers as it presumes a positive yield curve supports future growth, and with rates near 0 the yield curve is pretty much always going to be positive. So when it goes negative like this, it means the rest is that much more negative:

Leading Indicators
er-2-18-4

er-2-18-5
My point here remains that you can have no new claims AND no new hiring. And in any case states have made it more difficult to collect benefits, which are both low and fully taxable, so this could be the type of recession where hiring continues to decelerate and attrition continues without an increase in involuntary separations followed by filing for benefits:

Jobless Claims
er-2-18-6

Mtg purchase apps, Housing starts, Redbook retail sales, Industrial production, E commerce retail sales

Purchase apps down again:

MBA Mortgage Applications
er-2-17-1
Highlights
Falling mortgage rates continue to drive refinancing applications sharply higher, up 16 percent for a second straight week. Purchase applications, up 30 percent year-on-year, are also being driven higher though they declined 4 percent in the latest week. The average rate for 30-year conforming loans ($417,000 or less) fell 8 basis points in the week to 3.83 percent.

Again, so much for what’s been forecast to be the ‘driver’ of the 2016 economy.

Note how the chart shows starts have been working their way lower for a substantial period of time:

Housing Starts
er-2-17-2
Highlights
Housing starts and permits proved softer-than-expected in January, down 3.8 percent to an annual rate of 1.099 million for starts with permits down 0.2 percent to 1.202 million. Starts show roughly equal weakness between single-family homes, down 3.9 percent to a 731,000 rate, and multi-family homes, down 3.7 percent to 368,000. Permits for single-family homes fell 1.6 percent to 720,000 while multi-family permits, in the strongest reading of the report, rose 2.1 percent to 482,000.

Multi-family homes remain the center of strength for the housing sector with year-on-year permits up 19.9 percent, surpassing a very solid 9.6 percent gain for single-family homes. Starts are lagging far behind, at a year-on-year plus 1.8 percent overall and reflecting supply constraints in the construction sector, including for labor, as well as January’s heavy weather that hit the East Coast at mid-month.

The housing sector isn’t on fire but trends in permits do point to strength. Watch for existing home sales on Tuesday next week followed by new home sales on Wednesday.

er-2-17-3
er-2-17-4
Not good, year over year negative, and the blip up in auto production will likely reverse as auto sales have declined:

Industrial Production
er-2-17-5
Highlights
A sharp gain in motor vehicle production underpins a very strong industrial production report where the headline surged 0.9 percent in January which is far above Econoday’s plus 0.4 percent consensus and 0.6 percent high-end estimate. The gain lifts capacity utilization to 77.1 percent for a strong 7 tenths gain from a downward revised December.

Vehicle production surged 2.8 percent in the month and drove the manufacturing component up by 0.5 percent, a gain that compares with a plus 0.2 percent consensus and a high-end estimate of 0.4 percent. But manufacturing was also supported by capital goods, an area that has been weak but which did gain 0.3 percent in the month.

The utilities component, up a monthly 5.4 percent and reflecting a temperature swing from a warm December to a more seasonably cold January, is the major factor behind the headline gain. Mining, hit by low energy and commodity prices, continues to lag, coming in unchanged in the month for a year-on-year decline of 9.8 percent.

Total year-on-year industrial production also remains in the negative column, at minus 0.7 percent, a disappointment but a contrast to manufacturing where the year-on-year rate is modest but accelerating, at plus 1.2 percent.

A negative in the report is a downward revision to December, to minus 0.7 percent from minus 0.4 percent. But the revision doesn’t take much away from the January surprise where strength, based in manufacturing and underscoring January’s rise in retail auto sales, should help ease concern over the economy’s first-quarter performance.

er-2-17-6
Deceleration here as well:

E-Commerce Retail Sales
er-2-17-7
Highlights
Strength in non-store retail sales and reports of strength for holiday online shopping are only modestly confirmed by the e-commerce report where sales rose only 2.1 percent in the fourth quarter vs a downward revised plus 3.8 percent in the third quarter. Still, compared to the no-change quarterly reading for total fourth-quarter retail sales, the gain does point to relative strength. And year-on-year, e-commerce sales were up 14.7 percent which is far above the 1.3 percent year-on-year rate for total sales. E-commerce as a percentage of total retail sales edged 1 tenth higher in the quarter to 7.5 percent.

NY Mfg survey, Home builder’s index, oil losses, Japan, China trade, euro trade

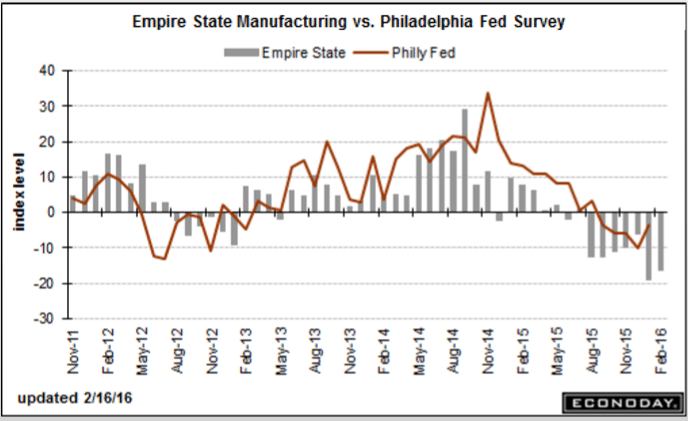
A lot worse than expected and still deep in contraction:

Empire State Mfg Survey
er-2-16-1
Highlights
For the seventh straight month, the Empire State report is signaling significant contraction for the manufacturing sector. The general business conditions index for February came in below low-end expectations, at minus 16.64 vs even deeper contraction of minus 19.37 in January. New orders, at minus 11.63, are in contraction for a ninth month in a row while employment, though improving to minus 0.99 from minus 13.00, is in contraction for an eighth month in a row.

Shipments are in contraction at minus 11.56 with unfilled orders at minus 6.93. The workweek is at minus 5.94. One reading in the plus column is the six-month outlook, up nearly 5 points to 14.48 which, however, is unusually low for this reading which usually tracks in the 30s and 40s. Price data show marginal improvement for inputs but contraction for finished goods.

This report is showing its weakest run by far of the recovery and, unfortunately, points to extended weakness for the nation’s factory which is getting hit by weak exports and weak energy markets at home.

er-2-16-2
This is going the wrong way for what’s been promoted as the ‘driver’ of the economy for the year:

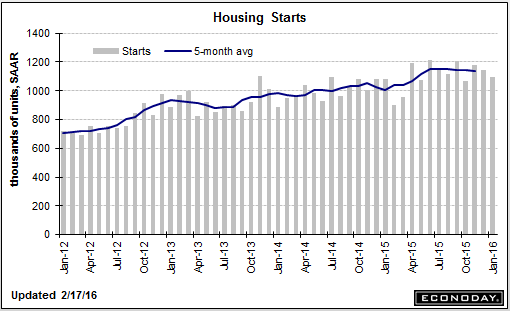
Housing Market Index
er-2-16-3
Highlights
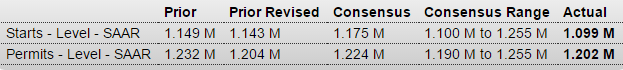
Optimism among home builders is cooling noticeably, based on the housing market index for February which is down 3 points to 58 for the lowest reading since May last year. But 58 is still well over breakeven 50 with the future sales component actually rising 1 point to 65. The current sales component, however, is down 3 points to 65 which points to expected slowing for tomorrow’s starts & permits data. The traffic component has been holding down this report throughout the whole recovery and continues to do so, down a steep 5 points to 39 and the lowest reading since also May last year. Weakness here reflects lack of first-time buyers and also perhaps the major snowstorm that hit the East Coast at mid-month.

Details show step backwards for all four regions with the West, a key region for the new home sector, down 5 points to a still standout composite score of 68. The South and Midwest are both at 57 with the Northeast continuing to trail far behind, down 2 points to 45.

Builders are citing scarcity of both labor and available lots as negatives right now. Momentum in the housing sector was bumpy last year and, based on this report, looks to remain so, at least through the early part of this year.

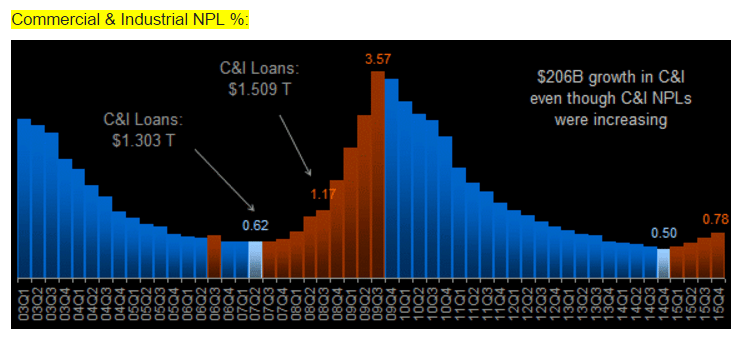
As previously discussed, not good for bank, either:

High risk of bankruptcy for one-third of oil firms: Deloitte

Feb 16 (Reuters) — Roughly a third of oil producers are at high risk of slipping into bankruptcy this year as low commodity prices crimp their access to cash and ability to cut debt, according to a study by Deloitte. The report is based on a review of more than 500 publicly traded oil and natural gas exploration and production companies across the globe. The roughly 175 companies at risk of bankruptcy have more than $150 billion in debt, with the slipping value of secondary stock offerings and asset sales further hindering their ability to generate cash, Deloitte said in the report.

Pro active currency depreciation tends to have these kinds of consequences:

Japan’s household spending falls 2.7% in 2015

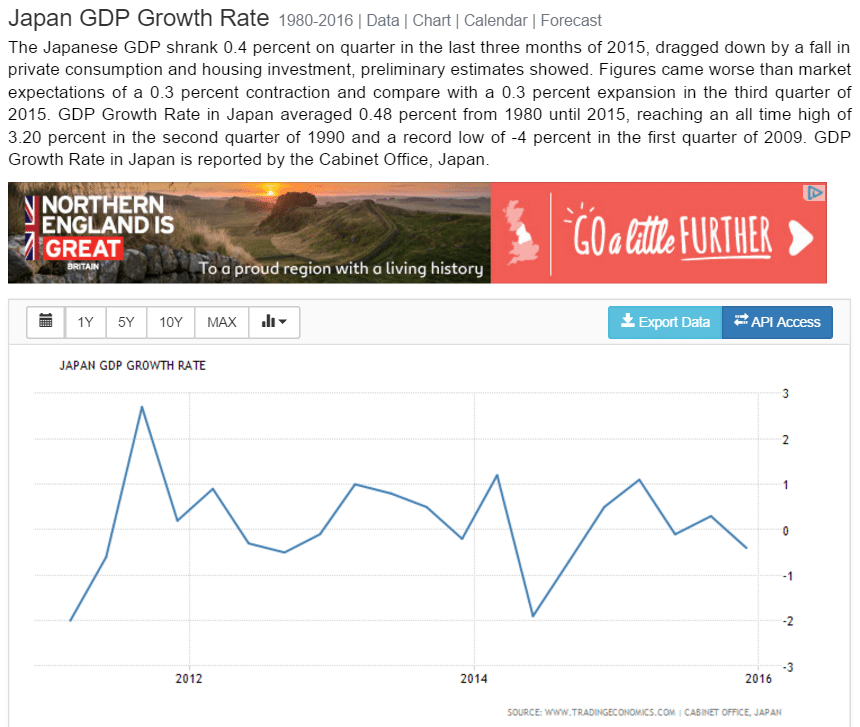
Feb 16 (Kyodo) — Japan’s average monthly household spending in 2015 fell 2.7 percent in price-adjusted real terms from the previous year to 247,126 yen for the second straight year of decrease. The drop followed a demand surge in the January to March period in 2014 before the consumption tax increase in April as well as weak sales of clothing due to an unusually warm winter, according to an official of the Internal Affairs and Communications Ministry. The decline compares with a 3.2 percent drop in 2014. Household spending figures are a key indicator of private spending, which accounts for around 60 percent of the nation’s gross domestic product.

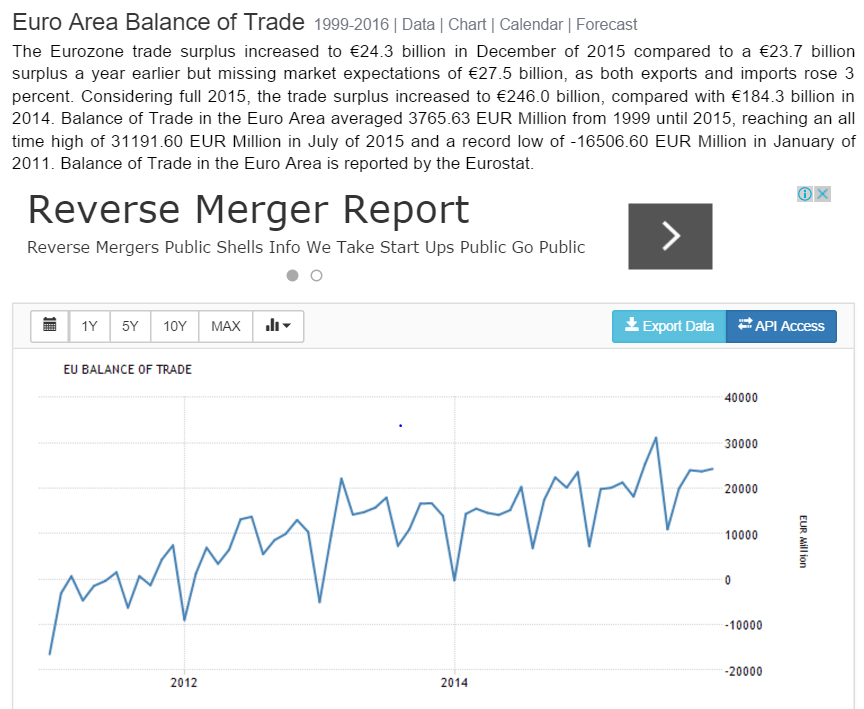
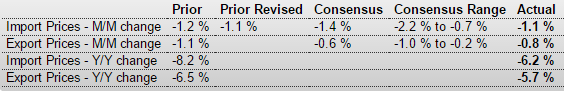
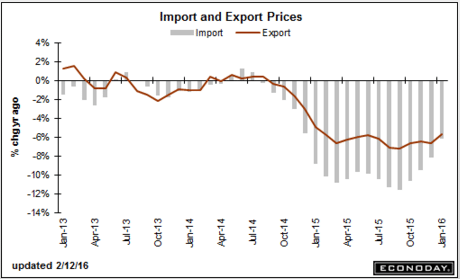
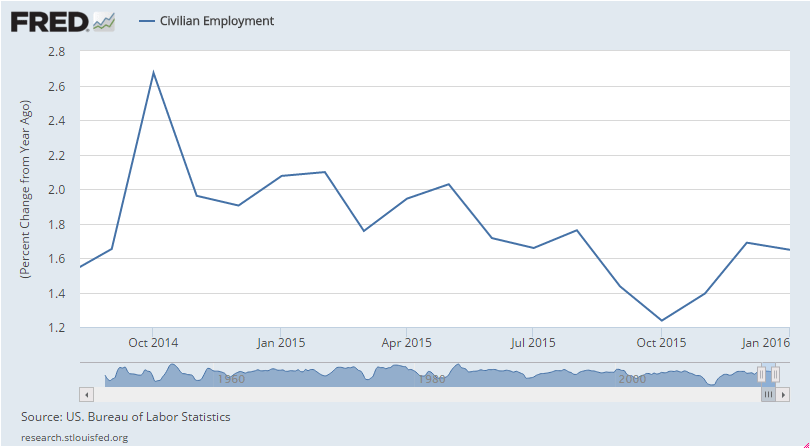
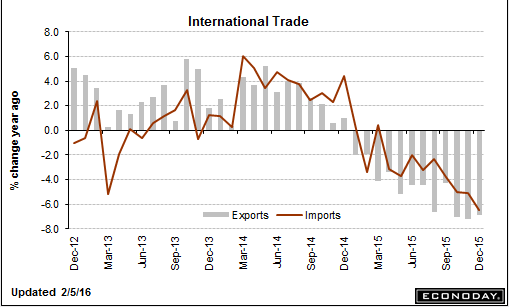
Two things. First, weak exports tend to reflect weak global demand. Second, reduced imports tend to reflect weak domestic demand.

And the ‘solid’ -;)- trade surplus is a fundamental force that works to support the currency:

China Trade Surplus Hits Fresh Record High in January

China trade surplus stood at USD63.29 billion in January of 2016, widening from USD60.03 billion reported a year earlier and beating market consensus. It is the largest trade surplus on record, as exports and imports fell far worse than expected. In January, exports plunged by 11.2 percent year-on-year to USD177.48 billion, following a 1.4 percent fall in December 2015.Imports tumbled by 18.8 percent year-on-year to USD114.19 billion, following a 7.6 percent decline in the preceding month, the 14th straight month of contraction, as a result of declining commodity prices and weak demand.
Same for the euro:

er-2-16-4

Atlanta Fed, Japan GDP, Consumer comment. LA port traffic

This is supported by increases in inventories that were already too high and likely to either be revised down or followed buy large declines for the rest of Q1. The retail sales number is also suspect and likely to revert to lower numbers:
er-2-15-1
er-2-15-2

The Myth Of The Resilient Consumer

By Lakshman Achuthan

The premise of incomes powering a consumer-driven pickup in U.S. economic growth is demonstrably false. And for people renting their homes the squeeze is even greater.

One clue is the extent of the increase in health care spending in recent years. Renters’ expenditures on health care as a percentage of after-tax income – after hovering around 4¾% for over a quarter century through 2011 – rose to 6.1% in 2013 before easing a bit in 2014 (top line). Homeowners also saw an analogous rise in health care spending as a percentage of after-tax income (not shown).
er-2-15-3
Similarly, spending on rent as a percentage of after-tax income – after staying fairly stable around 22% for over a quarter-century through 2012 – soared well above 25% in 2013 before slipping slightly (bottom line).

It follows that, on average in 2013-14, renters spent an extra 4½% of their after-tax incomes on rent and health care combined than in the previous quarter-century or so. Judging by the surge in consumer spending for health care, as well as the steady uptrend in rental inflation, renters’ share of spending on health care and rent would have risen even higher during 2015.

Rent and health care expenses are essentially non discretionary expenditures. Spending more on these items by an extra 5% or so of after-tax incomes puts a serious dent in discretionary spending budgets. This holds especially true given the double-digit declines in real average household income for the lion’s share of households since the turn of the century (USCO Essentials, October 2015).

In the context of this structural squeeze on family budgets, the current cyclical downturn in consumer spending growth is unwelcome news for anyone relying on the U.S. consumer to power economic growth in 2016.

In any event, it should be evident that the case for a full-blown Fed rate hike cycle cannot reasonably rest on the presumption of robust consumer spending, notwithstanding the decline in the unemployment rate to what the Fed considers “full employment.”

Looks like imports up and exports down- not good for GDP:
er-2-15-4
er-2-15-5

Retail Sales, Import and Export prices, Business inventories, Consumer sentiment, Japan

Retail Sales
er-2-12-1
Highlights
Vehicles are back on top, helping to lift retail sales to a 0.2 percent gain in January. Excluding vehicles and pulled down by falling gas prices, sales inched only 0.1 percent higher. But retail sales excluding gasoline stations — which is a central reading given the price fall — are up 0.4 percent for a very respectable year-on-year gain of 4.5 percent. The reading excluding both autos and gasoline is also up 0.4 percent in the month for a year-on-year rate of plus 3.8 percent.

General merchandise sales, which have been soft reflecting price contraction for imports, rose a sharp 0.8 percent in January. Building materials rose 0.6 percent as did vehicles where the year-on-year rate is at plus 6.9 percent. Non-store retailers, reflecting building strength for e-commerce, are once again a standout, up 1.6 percent for a year-on-year 8.7 percent gain.

But there are soft spots in January including restaurants, down 0.5 percent but following a very strong run in prior months, and also furniture, also down 0.5 percent. Sporting goods, a discretionary but still small component, were also weak though the year-on-year rate is leading all the data at 9.1 percent.

A positive are upward revisions to December, now at plus 0.2 percent overall with ex-auto ex-gas now at plus 0.1 percent. Though many readings are modest, this report — especially the ex-gasoline reading — points to a healthy U.S. consumer and should lift confidence in first-quarter growth.

Doesn’t look all that strong to me. And there’s been an conspicuous flattening since July:
er-2-12-2
Just an fyi on light weight truck sales- growth has been falling off:
er-2-12-3
DOE gasoline output implied demand, year over year, 8 week moving average.

Growth rate has gone negative:
er-2-12-4
Deflationary bias continues:

Import and Export Prices
er-2-12-5
Highlights
Import price pressures are negative and severe but are increasingly centered in oil-based goods. Import prices fell 1.1 percent in January but fell only 0.2 percent when excluding petroleum imports. Year-on-year, total import prices are down 6.2 percent, which is steep but still an improvement from prior months. When excluding petroleum, import prices are down a year-on-year 3.1 percent (perhaps modest by comparison) which is also an improvement. But petroleum deflation is severe, with import prices down 13.4 percent in January for a year-on-year minus 35.3 percent.

Export prices fell 0.8 percent in January and reflect, in bad news for the farming sector, a 1.1 percent decline in prices of agricultural exports. Year-on-year, export prices are down 5.7 percent with agricultural products down 12.7 percent.

Price contraction for finished goods is easing though only incrementally. Import prices for both vehicles and consumer goods inched higher in the month with contraction in year-on-year rates narrowing, to only minus 0.3 percent for consumer goods. The export side also shows price improvement.

By countries, import prices with Canada, reflecting fuel prices, continue to fall severely, down 2.8 percent in the month for a year-on-year minus 12.6 percent. Latin America is next, down 1.2 percent and 7.8 percent on the year. Other regions are much narrower with China at minus 0.1 percent in the month and minus 1.6 percent on the year.

This report does fit in with FOMC expectations for an easing downward pull from import prices, at least excluding oil with prices for the latter, sooner or later as policy makers argue, certain to firm. An immediate plus is ongoing strength in the dollar which is pointing to easing import-price contraction for the February report.

er-2-12-6
Inventories still too high and climbing as sales continue to fall short of expectations:

Business Inventories
er-2-12-7

er-2-12-8
More softening of buying plans:

Consumer Sentiment
er-2-12-9

er-2-12-10

Japan Finance Minister says will take necessary steps to deal with FX volatility

Mtg purchase apps, Distillates, Goldman, Investment, C & I non performing loans, Baltic dry index

No bounce this week for purchase apps:
er-2-10-1
er-2-10-2


Goldman Sachs Abandons Five of Six ‘Top Trade’ Calls for 2016

By Rachel Evans and Andrea Wong

Feb 9 (Bloomberg) — Goldman Sachs to clients: whoops. Just six weeks into 2016, the New York-based bank has abandoned five of six recommended top trades for the year.

The dollar versus a basket of euro and yen; yields on Italian bonds versus their German counterparts; U.S. inflation
expectations: Goldman Sachs Group Inc. was wrong on all that and more.

er-2-10-4
er-2-10-5
er-2-10-6

Euro banks, Fed’s labor market index, NFIB chart

Getting more obvious it’s ‘spreading’ much like during the sub prime days, as previously discussed?

European banks face major cash crunch

European banks may have to pare down assets to bolster capital reserves as cheap oil is taking a toll on portfolios of energy-exposed loans.

It’s slowing, whatever it is…
;)

Labor Market Conditions Index
er-2-9-5
Highlights
Payroll growth slowed in Friday’s employment report as did the Fed’s labor market conditions index, to plus 0.4 in January from a downward revised plus 2.3 in December (2.9 initially) and an upward revised plus 2.9 in November (2.8 initially). January’s reading indicates the lowest level of labor market expansion since April last year and also reflects the climbing trends in jobless claims. One big positive for the labor market, however, is the falling unemployment rate, at a recovery low 4.9 percent in January.

er-2-9-6

Wholesale inventories, Small business index, Redbook retail sales

And another bad one as sales are falling just as fast as inventories:

Wholesale Trade
er-2-9-1
Highlights
Wholesale inventories fell an as-expected 0.1 percent in December with November revised 1 tenth lower to minus 0.4 percent. Wholesalers have been liquidating inventories as sales have been falling, down 0.3 percent in the latest month following a 1.3 percent sales decline in November. And they’ve been successful, keeping down the stock-to-sales ratio at 1.32 the last two reports which is still however up noticeably from 1.24 in December 2015. The factory sector hasn’t been as successful keeping down inventories, showing a 0.2 percent rise in December. This sets the stage for December retail inventories which will be released with the business inventories report on Friday following the retail sales report.

er-2-9-2
Been heading south ever since oil capex collapsed:
er-2-9-3

Small business optimism index fell back sharply in January, to 93.9 from December’s 95.2 and reflecting deepening pessimism over both the economic outlook and sales expectations. Plans to increase employment also came down but nevertheless remain solidly in the plus column. And two important components remain exceptionally positive, jobs hard to fill and plans to increase capital outlays with the latter pointing to future hiring and belying the negative expectations for the economy. But key negatives also include pessimism over earnings, a trend that doesn’t support hiring or business investment. The details are mixed to downbeat in this report, one that falls in line with the general tenor so far of January’s economic data.

This keeps getting worse even as comps with last year get ‘easier’:
er-2-9-4

Inventories, Payrolls, Trade

This is getting out of control.

Sales are slowing faster than inventories are being sold.
er-2-5-2
er-2-5-3
er-2-5-4
A weak print and year over year growth continues to decelerate as per the chart:

Employment Situation
er-2-5-5
Highlights
Headline weakness masks an otherwise solid employment report for January. Nonfarm payrolls rose 151,000 vs expectations for 188,000. December was revised 30,000 lower to 262,000 but November was revised 28,000 higher to 280,000. Now the signs of strength as the unemployment rate fell 1 tenth to 4.9 percent while the participation rate rose 1 tenth to 62.7 percent. In another sign of strength, the average workweek rose to 34.6 hours to end a long run at 34.5 hours. Average hourly earnings rose a very sharp 0.5 percent though the monthly gain didn’t make for any change in the year-on-year rate which holds steady at a still moderate 2.5 percent.

Manufacturing stands out in the industry data pointing to a strong January for the sector. Manufacturing hours rose in the month while payrolls jumped 29,000 for the best showing since November 2014. Retail trade, up 58,000, also posted its best gain since November 2014. Transportation & warehousing, in a sign of strength for the supply chain, rose 45,000 for the strongest showing since December 2012. On the negative side are temporary help services, down 25,000 but following strong gains in prior months. Government payrolls fell 7,000 as did mining where employment, hit by the drop in oil and commodity prices, was in contraction throughout 2015.

The labor market may be backing off slightly so far this year but it continues to approach full employment, a factor underscored by the month’s jump in hourly earnings and which offers support for further Federal Reserve rate hikes. Note that the big snow storm that hit the East Coast during the month came after the sample week and was not a factor in the data.

er-2-5-6
Yes, there was a monthly gain in the household survey, but on a year over year basis it decelerated from last month and the downtrend remains intact:
er-2-5-7
Wage growth remains well below prior lows and is only back to where it peaked in 2014:
er-2-5-8
The trade gap continues to widen even as the price of oil remains low, as exports weaken:

International Trade
er-2-5-9
Highlights
The nation’s trade deficit widened in December to $43.4 billion from a revised $42.2 billion in November. Exports have been extremely weak and weakened further, down 0.3 percent to $181.5 billion in the month. Exports of civilian aircraft fell sharply with exports of industrial supplies and foods/feeds/beverages also down. Imports rose 0.3 percent to $224.9 billion led by autos and industrial supplies and offsetting a decline for non-auto consumer goods.

Country balances show a $3.4 billion narrowing with China to a $27.9 billion monthly gap and little change with the E.U. at $13.7 billion. The gap with Japan widened by $0.9 billion to $6.6 billion while the gap with Mexico narrowed by $0.7 billion to $4.6 billion. The gap with Canada widened sharply by $1.7 billion to $2.2 billion.

The decline in exports is the latest hard evidence of global effects made more severe for U.S. exporters by the strength of the dollar, but the rise in imports, despite the decline in consumer goods, offers a positive indication on domestic demand, strength underscored this morning by the January employment report.

er-2-5-10