Wholesale inventories and sales, Trump comments

20901

Highlights

Inventories have been on the climb raising the risk of unwanted overhang. But overhang isn’t the story of the December wholesale trade report where a large 1.0 percent build is far outmatched by a 2.6 percent surge in sales. The results pull the stock-to-sales ratio down sharply to 1.29 from 1.31. Wholesale auto inventories rose 2.0 percent in December, a month that proved very strong for retail auto sales and was also very strong for wholesale sales where autos jumped 5.5 percent in the month. Watch for business inventories on Wednesday of next week’s calendar which will wind up the year-end inventory picture.

Interesting that dips in sales like we’ve experienced over the last couple of years previously happened only during recessions:

20902
This chart was updated Jan 13, and even with the drop to 1.29 reported today inventories remained elevated:

20903

Trump lashes out at Sen. John McCain again, this time for criticizing Yemen mission

The Arizona Republican, who was briefed on last month’s mission, told NBC News on Wednesday that he cannot call it a success “when you lose a $75 million airplane and, more importantly, an American life is lost.” In a series of tweets Thursday, Trump argued that McCain “talking about the success or failure of a mission” only “emboldens the enemy.”

20904

McCain’s office in a statement: “Senator McCain will continue to execute his oversight duties as Chairman of the Senate Armed Services Committee and support brave men and women serving our nation in uniform.”

McCain, who was a prisoner of war during the Vietnam War, came under attack by then-candidate Trump in July. “He’s not a war hero. He’s a war hero because he was captured. I like people who weren’t captured,” Trump said.

GDP, Trade, Personal income and outlays, Consumer sentiment, China deficit spending, 7DIF, US surveys, German business morale

Revised up but for the worst reasons possible- unsold inventories were higher. Also, consumption expenditures were a bit lower, and note the deceleration of GDP growth on the chart. And in all likelihood Q1 GDP is now being reduced by inventory liquidation substituting for production:

GDP
er-2-26-1
Highlights
An upward revision to inventory growth made for an upward revision to the second estimate of fourth-quarter GDP, to an annualized plus 1.0 percent rate for a 3 tenths increase from the initial estimate. But, given slowing in demand during the quarter, the gain for inventories, at $81.7 billion vs an initial estimate of $68.6 billion, very likely reflects a build in unwanted inventories.

A clear negative in today’s report is a downgrade for personal consumption expenditures, to an annualized plus 2.0 percent in the quarter vs an initial estimate of 2.2 percent. Otherwise, revised readings are steady to unchanged with non-residential investment, hit by the mining and energy sectors, down at a 1.9 percent rate and exports down at an even steeper 2.7 percent rate. Residential investment remains the big plus, rising at an 8.0 percent rate. But final sales were slow in the quarter, up only 1.2 percent.

The economy, held down by weak exports and weak business investment, fumbled into year-end 2015, but the early outlook for the first quarter calls for a turn higher to trend growth, perhaps as much as 3 percent. Key data for the first quarter will be posted later this morning with the January personal income and expenditures report.

er-2-26-2
Worse than expected which means GDP is running that much less then expected:

International Trade in Goods
er-2-26-3
Highlights
In a report pointing to economic weakness, the nation’s trade gap in goods widened 1.2 percent in January to $62.2 billion as exports fell 2.9 percent to offset a 1.5 percent fall in imports (imports are a subtraction in the national accounts). Exports fell across the board including industrial supplies at minus 3.0 percent in the month and capital goods down 2.3 percent. The decline in imports included a steep 6.8 percent drop in industrial supplies and a 2.4 percent decline for capital goods. The declines in industrial supplies are tied in part to low prices for oil and petroleum products while the declines in capital goods points to lack of global confidence in the business climate and lack of business investment in global productivity. This report represents the goods portion of the monthly international trade report which will be posted next Friday.

Better than expected, as spending was up from a very low December and a weak q4 that was today further revised down. And note that these number as well are subject to revisions over the coming months, with the spending numbers somewhat at odds with sales reports.

Personal Income and Outlays
er-2-26-4
Highlights
There’s plenty of life in the consumer. Personal income jumped 0.5 percent in January as did consumer spending, both readings higher than expected. Also higher than expected are the report’s inflation readings especially the core PCE which rose 0.3 percent for a year-on-year plus 1.7 percent.

Details are solidly positive with components on the income side led by wages & salaries, up a very strong 0.6 percent for the third large gain of the last four months. And consumers didn’t draw from savings on their January shopping spree, with the savings rate unchanged at a very solid 5.2 percent.

Components on the spending side are led by durable goods which jumped 1.2 percent and reflect strong vehicle sales in the month. Spending on services rose 0.6 percent in the month.

But the big story of the report is the core PCE, especially the year-on-year rate which is up from 1.4 percent to 1.7 percent and is pointing confidently toward the Fed’s 2 percent line. Total prices, which include food and energy, rose only 1 percent but the year-on-year rate for this reading has been on a tear, moving from about zero late last year to plus 1.3 percent in January.

Economic news outside of the consumer has been soft but today’s report is a reminder that the nation’s most important supporter is alert and in the driver’s seat. A strong consumer, who is benefitting from a strong labor market, together with the upward pivot for inflation will not make policy makers comfortable at next month’s FOMC where a rate hike, though long dismissed, may be a serious topic of discussion.

er-2-26-5
er-2-26-6

China considers itself bound by that treaty too??? Good luck to them. 4% isn’t near high enough to replace the lost private sector credit growth needed to sustain output and employment:

China could raise budget deficit to 4% of GDP:central bank official

Feb 25 (China Daily) — China could raise its budget deficit to 4 percent of GDP or even higher to offsetthe impact of reduced fiscal revenue and to support broader reforms, a central bank official said. In an article published by “The Economic Daily,” director of the central bank’s surveys andstatistics department Sheng Songcheng said the deficit increase would not incur biginsolvency risks for the government. China raised its budget deficit to 2.3 percent of GDP in 2015, up from 2.1 percent in 2014. A3-percent deficit ratio, as stated in the 1992 Maastricht Treaty, is normally considered a redline not to be crossed.

My book intro talk in Germany:


er-2-26-7
er-2-26-8

Inventories, Payrolls, Trade

This is getting out of control.

Sales are slowing faster than inventories are being sold.
er-2-5-2
er-2-5-3
er-2-5-4
A weak print and year over year growth continues to decelerate as per the chart:

Employment Situation
er-2-5-5
Highlights
Headline weakness masks an otherwise solid employment report for January. Nonfarm payrolls rose 151,000 vs expectations for 188,000. December was revised 30,000 lower to 262,000 but November was revised 28,000 higher to 280,000. Now the signs of strength as the unemployment rate fell 1 tenth to 4.9 percent while the participation rate rose 1 tenth to 62.7 percent. In another sign of strength, the average workweek rose to 34.6 hours to end a long run at 34.5 hours. Average hourly earnings rose a very sharp 0.5 percent though the monthly gain didn’t make for any change in the year-on-year rate which holds steady at a still moderate 2.5 percent.

Manufacturing stands out in the industry data pointing to a strong January for the sector. Manufacturing hours rose in the month while payrolls jumped 29,000 for the best showing since November 2014. Retail trade, up 58,000, also posted its best gain since November 2014. Transportation & warehousing, in a sign of strength for the supply chain, rose 45,000 for the strongest showing since December 2012. On the negative side are temporary help services, down 25,000 but following strong gains in prior months. Government payrolls fell 7,000 as did mining where employment, hit by the drop in oil and commodity prices, was in contraction throughout 2015.

The labor market may be backing off slightly so far this year but it continues to approach full employment, a factor underscored by the month’s jump in hourly earnings and which offers support for further Federal Reserve rate hikes. Note that the big snow storm that hit the East Coast during the month came after the sample week and was not a factor in the data.

er-2-5-6
Yes, there was a monthly gain in the household survey, but on a year over year basis it decelerated from last month and the downtrend remains intact:
er-2-5-7
Wage growth remains well below prior lows and is only back to where it peaked in 2014:
er-2-5-8
The trade gap continues to widen even as the price of oil remains low, as exports weaken:

International Trade
er-2-5-9
Highlights
The nation’s trade deficit widened in December to $43.4 billion from a revised $42.2 billion in November. Exports have been extremely weak and weakened further, down 0.3 percent to $181.5 billion in the month. Exports of civilian aircraft fell sharply with exports of industrial supplies and foods/feeds/beverages also down. Imports rose 0.3 percent to $224.9 billion led by autos and industrial supplies and offsetting a decline for non-auto consumer goods.

Country balances show a $3.4 billion narrowing with China to a $27.9 billion monthly gap and little change with the E.U. at $13.7 billion. The gap with Japan widened by $0.9 billion to $6.6 billion while the gap with Mexico narrowed by $0.7 billion to $4.6 billion. The gap with Canada widened sharply by $1.7 billion to $2.2 billion.

The decline in exports is the latest hard evidence of global effects made more severe for U.S. exporters by the strength of the dollar, but the rise in imports, despite the decline in consumer goods, offers a positive indication on domestic demand, strength underscored this morning by the January employment report.

er-2-5-10

Japan, China, Fed comment, Capex cutbacks, South Korea

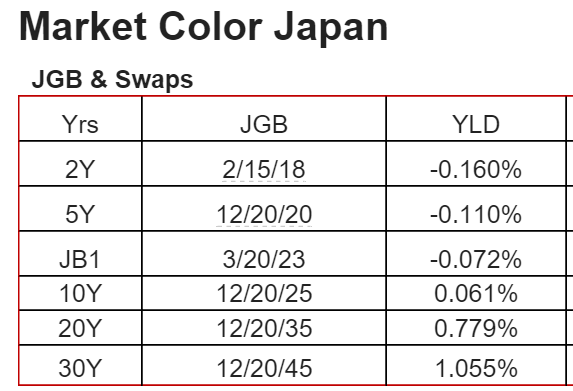
This is the yen yield curve after over 20 years of a 0 rate policy, massive QE, and now negative overnight rates. Maybe now the economy will finally respond.
:(

(And how good can the BOJ think the economy is?)
er-2-1-1

The western educated kids/monetarists who’ve taken control don’t seem to be doing all that well, as China begins to look like the other countries they’ve taken over, like the EU, US, etc. etc. etc. What they learned is that it’s about balancing the federal budget and using monetary policy to support growth and employment as needed, allowing ‘free markets’ to ‘clear’ as per their general equilibrium models that earned them advanced degrees. Unfortunately they fail to recognize the currency itself is a (simple) public monopoly which obviates all those ‘market clearing’ assumptions in their models:

China official PMI misses in January, Caixin PMI shows contraction

Jan 31 (CNBC) — China’s factory activity skidded to a three-year low point in January, adding to further gloom about the state of the world’s second-largest economy.

The government-compiled January manufacturing purchasing manager’s index (PMI) came in at 49.4, slightly missing Reuters consensus estimates for a 49.6 reading and ticking down from December’s 49.7 figure. It was the weakest result since 2012 and marked the sixth straight month in contraction territory.

The mood was worsened by a private survey by Caixin and Markit that showed January manufacturing activity shrinking for the eleventh straight month. Caixin’s survey, which tracks smaller firms than the official indicator, came in at 48.4, compared to December’s reading of 48.2.

Does this read like an executive who’s organization has a $200 million per year research budget?

They just hiked rates in December with every chart I’ve seen having been heading south for a year or so?

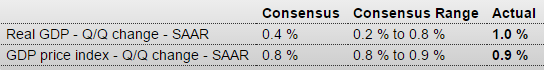
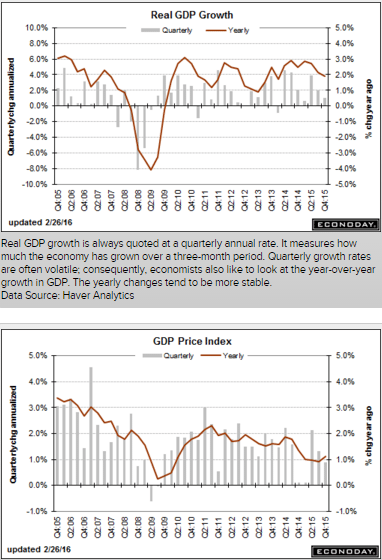
And GDP was right on forecast.

Seems to me this ‘kind of tells him’ the fundamental assumptions behind his models needs a rethink?

Fed’s Williams says sees ‘smidgen’ slower rate hikes

Jan 29 (Reuters) — “Standard monetary policy strategy says a little less inflation, maybe a little less growth … argue for just a smidgen slower process of normalizing rates,” San Francisco Fed President John Williams said. “We got a little stronger dollar, some mixed data on the economy, some weakness in Q4 GDP, all of those coming together kind of tell me that we probably need a little bit more monetary accommodation this year than I was thinking in the middle of December.” Williams said his “modal” forecast, remains fundamentally unchanged for 2016 and 2017. “The thing that has changed is that commodity prices keep coming down,” he said.

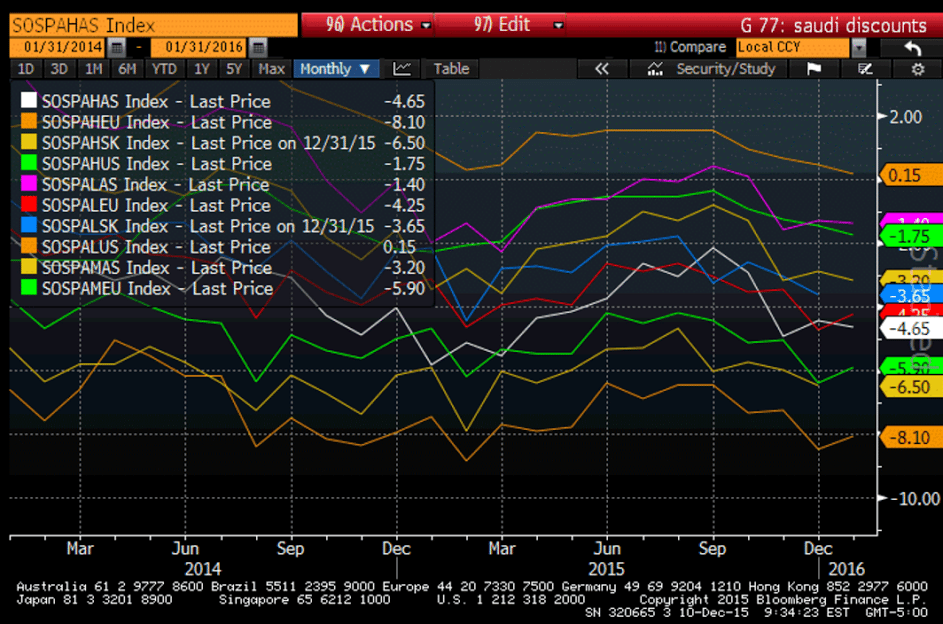
The hits keep on coming with no replacement spending in sight:

Chevron Posts Loss, Readies More Layoffs

Jan 29 (WSJ) — Chevron is slashing its capital spending by more than $9 billion this year. Chevron plans to sell up to $10 billion in oil fields and other assets through 2017. A $26.6 billion spending plan detailed in December will have to be reduced given how much oil-market conditions have since deteriorated, he company said. Chevron reported a loss of $588 million, or 31 cents a share, in the fourth quarter, down from a profit of $3.47 billion, or $1.85 a share, in the year-earlier period. Revenue tumbled 37% to $29.25 billion. In Chevron’s refining division profits were cut nearly in half, falling to $496 million.

For Mining Chiefs, Doomsday Scenarios Could Become Reality

Jan 29 (WSJ) — Refined-copper supply jumped 36% to 22.5 million tons from 2005 to 2014, according to ICSG data. Over that same period, annual copper consumption increased 38% to 22.9 million tons. Total Chinese copper imports fell to 8.6 million tons in 2015, down 2.2% from the year before. Global refined supply rose 1.8% over the same period, largely because of a 4% increase in refined production from China. China imports of unfinished copper and products in December rose 26% in annual terms to 530,000 tons. More than 600,000 tons of copper supply have been taken out of the market over the past 12 months, according to Morgan Stanley.

Not the worst indicator for global growth:

South Korean Exports Fall at Fastest Pace Since Financial Crisis

Jan 31 (WSJ) — Korean exports, the first shipments data released each month in Asia, slid 18.5% to $36.74 billion in January, the steepest fall since August 2009. The decline extended a run of monthly falls into a 13th month. Imports plunged 20.1% from a year earlier to $31.42 billion in January. For all of 2015, Korean shipments overseas contracted 8%—the steepest fall in six years and the first 12-month contraction in three years, the government said. The Nikkei PMI reading for January came in at 49.5, down from 50.7 in December.

Apartment market tightness, Euro area trade surplus, Spain

er-1-15-1

This just keeps going up, which fundamentally tends to drive up the euro which tends to continue to be subject to said upward pressure until the trade picture reverses:

Euro Area Balance of Trade

The Eurozone trade surplus increased to €23.6 billion in November of 2015 compared to a €20.2 billion surplus a year earlier. Exports recorded the highest annual gain in four months and imports rebounded.
er-1-15-12

Potential showdown that could drive up Spanish rates:

Guindos Ditches Pledge on Spain Deficit to Push Growth

By Maria Tadeo

Jan 14 (Bloomberg) — Spanish finance chief Luis de Guindos ditched his promise to meet European Union budget goals saying shoring up economic growth is more important for his country’s future.

De Guindos said worrying about whether the budget deficit comes in a few tenths of a percentage point above the country’s 4.2 percent target for 2015 would be a distraction from the fundamental challenge of protecting the economic recovery.

“What is important is to maintain the pace of growth of the Spanish economy,” he told reporters on Thursday before meeting euro-area finance ministers for the first time since December’s general election left the parliament divided between four major parties.

“The biggest risk for budget policy is that the Spanish economy slows down,” de Guindos added.

Spain risks being drawn into a clash with the European Commission which has been warning since October that the spending plans acting Prime Minister Mariano Rajoy pushed through ahead of the election don’t do enough to curb the currency union’s biggest budget shortfall. Eurogroup chief Jeroen Dijsselbloem, who saw off a challenge from de Guindos to hang on to his job last year, said this month that Spain won’t be allowed any more flexibility over its target, according to El Pais newspaper.

Speaking to reporters on Thursday, Dijsselbloem said Brussels would “wait for the outcome of the domestic political process,” before taking further action.

Jobs, Wholesale trade, China, Rail traffic

Anyone notice that the annual growth rate of employment continues the deterioration that began with the collapse in oil capex?
Or that, once again, it looks like most all the new jobs were taken by people previously considered out of the labor force?
And the anemic wage growth also contributes to the narrative of a continuously deteriorating plight for people trying to work for a living:

Employment Situation
er-1-8-1
Highlights
The labor market is stronger than most assessments with December results well outside top-end estimates and big upward revisions underscoring the strength of prior months. Nonfarm payrolls jumped 292,000 in December which is 92,000 above the consensus and 43,000 above Econoday’s high forecast. The gain importantly is led by professional & business services which is considered a leading component for future hiring and which rose 73,000 for the second outsized gain of the last three months. Construction, boosted by the nation’s unseasonable weather, has also been adding workers, up 45,000 in December. Upward revisions to the two prior months total 50,000 with November now at 252,000 and October over 300,000 at 307,000.

Despite payroll strength, the unemployment rate held steady at 5.0 percent as more people looked for work in the month. The labor force participation rate improved 1 tenth to 62.6 percent as did the employment-to-population ratio, to 59.5 percent. Wages, also despite the payroll strength, came in unchanged though the year-on-year rate, boosted by an easy year-ago comparison, rose 2 tenths to 2.5 percent which, however, is lower than many expected. The average workweek held unchanged at 34.5 hours while manufacturing hours slipped 0.1 percent which will pull down estimates for next week’s industrial production report.

Turning back to industry payrolls, the bureau of labor statistics is highlighting a 34,000 rise in temporary help services. This is a subcomponent of professional & business services and is considered an especially sensitive barometer for future hiring. Other industries posting gains include trade & transportation at 31,000, government at 17,000, and manufacturing at a modest 8,000. Mining payrolls, hurt by low commodity prices, continue to contract, down 8,000 and are one of the few industries in the minus column.

This report is strong and should confirm confidence that the U.S. economy is, or at least was in December, largely insulated against global weakness. The strength of this report is certain to grab global attention though the lack of wage punch underscores the two-track economy and the Fed’s dilemma — strong job growth but weak inflation.

er-1-8-2
Also decelerating since the oil capex collapse:
er-1-8-3
So 10 million + people decided all at once they didn’t ever want to work anymore in 2008? That is, we still have massive ‘slack’ in the ‘labor market’ best I can tell:
er-1-8-4
er-1-8-5
er-1-8-6
And this is still higher than it was in the prior recession:
er-1-8-7
Earnings continue to grow only at depressed rates, maybe because of all the ‘slack’ in the ‘labor market?’
er-1-8-8
er-1-8-9
Inventories fell, but sales fell even more, so the inventory to sales ratio went up.
Not good!!!

Wholesale Trade
er-1-8-10
Highlights
Wholesale inventories fell a sizable 0.3 percent for a second straight month in November. Sales at the wholesale level fell an even sharper 1.0 percent in the month and, despite the decline in inventories, drove the stock-to-sales ratio up to 1.32 vs 1.31 in the two prior months. A year-ago, the ratio was at 1.23 in what is confirmation that inventories in the sector remain heavy. Inventories of farm products and petroleum rose due to weak sales while inventories of furniture and metals fell on strong sales. Previously released data on the factory sector show a 0.3 percent inventory contraction in November. The missing piece, retail inventories, will be posted following next week’s retail sales report.

er-1-8-11
‘Monetary Policy’ in this case means currency management. So we called China a currency manipulator and predator when they bought fx reserves to keep their currency from getting too strong too fast from FDI flows, etc., and then when they let their currency float as FDI flows reversed we criticized them.

And we had a ‘strong dollar policy’ while at the same time telling China their currency needed to appreciate when they were buying fx to moderate the appreciation. It’s all be continuous ‘talking out of both sides of the mouth’

And with a large trade and current account surplus it’s only a matter of time until China is again accumulating fx reserves to keep their currency from appreciating. But in light of the current criticism of their weakening currency, maintaining ‘stability’ when it’s back in appreciation mode may be applauded.

China central bank to maintain prudent monetary policy, keep yuan stable

Bank of China, Port traffic, Redbook retail sales, Car sales early indication

This does nothing apart from supporting their policy rate:
er-1-5-1

Port Traffic Grew at Slowest Rate Since Recession in 2015

Container traffic rose only 0.8% last year at the 30 busiest ports worldwide, the smallest increase since 2009, according to an estimate by Alphaliner

By Robbie Whelan

Jan 4 (WSJ) — Container traffic at the world’s busiest ports grew last year at its slowest rate since the recession, according to an estimate by Alphaliner, a shipping industry data provider.

Demand was held back by a lack of “peak season,” the months heading into the holidays when manufacturers normally ship large quantities of goods to retailers globally. This year, traffic in the top 30 ports sank 0.9% in the third quarter, the first decline over those months since 2009, Alphaliner said.

For the full year, Alphaliner projects container traffic rose 0.8%, the smallest increase since 2009. Weak demand has left carriers struggling to find customers to fill their ships, even as new vessels hit the seas at a record pace. Last year, ships with a combined capacity of 1.7 million twenty-foot containers entered the global fleet. To combat the lower ocean freight rates resulting from excess capacity, ship owners and operators have idled more than 1.3 million TEUs of capacity.

Doing better as year over year comps get easier:
er-1-5-2

The Big Three are in and December sales are running below expectations down about 5 percent from November vs expectations for a 1 to 2 percent decline. Car sales are especially weak with sales of light trucks down only slightly. The Big Three account for roughly half of all sales. Foreign brands will be posting their results through the session.

Atlanta Fed, US current account, Philly Fed

Blue chip consensus dropping quickly now, and today won’t help any:
er-12-17-5
Remember a year ago when they said the oil price drop would be an unambiguous positive for the trade balance?
;)

Anyway, this is weak dollar stuff, vs the euro area current account surplus, which is strong euro stuff:

Current Account
er-12-17-1
Highlights
The nation’s current account deficit widened sharply in the third quarter, to $124.1 billion from a revised $111.1 billion in the second quarter. This is the widest gap of the recovery, since the troubles of fourth-quarter 2008. A greater deficit in goods trade, at $0.8 billion in the quarter, is the smallest factor in the widening. A narrowing in the surplus for primary income, at $6.6 billion, and a widening in the gap for secondary income, at $5.8 billion, are the main factors behind the quarter’s deficit. The gap relative to GDP rose 1 tenth in the third quarter to a still manageable 2.7 percent.

er-12-17-2
Bad. Fed rate hike already have an effect…
;)

Philadelphia Fed Business Outlook Survey
er-12-17-3
Highlights
The negative headline, below Econoday’s low-end estimate, isn’t even half of story for the December Philly Fed report which is pointing to another rough month for the nation’s factory sector. The headline index came in at minus 5.9 for its third negative reading in four months. New orders have been in the negative column for the last three months, at a steep minus 9.5 in today’s report. Unfilled orders, which popped up slightly in November, are back in the minus column and deeply in the minus column at 17.7.

Manufacturers in the Philly Fed’s sample worked down their backlogs to keep up shipments which came in on the plus side at 3.7. But without new orders coming in, shipments are bound to fall. Employment, likewise, is bound to fall though it did hold in the plus column for a second month in a row at 4.1 in December. Ominously, price data are beginning to turn deeply negative, at minus 9.8 for inputs and minus 8.7 for final goods — the latter an indication of weakening demand.

Another ominous detail in the report is a breakdown in the 6-month outlook, down more than 20 points to 23.0 which is low for this reading. Expectations for future orders are especially weak. Today’s report falls in line with Tuesday’s Empire State report and are both reminders that weak global demand, together with the breakdown in the energy and commodity sectors, are pulling down the nation’s factory sector.

er-12-17-4

Saudi oil pricing, import and export prices, Japan Manufactures’ sentiment

Not a lot of change for January, most ‘discounts’ still at or near the wides, so price action likely to be more of same:
er-12-10-1
Something the Fed takes into consideration:

Import and Export Prices
er-12-10-12
Highlights
Cross-border price pressures remain negative with import prices down 0.4 percent in November and export prices down 0.6 percent. Petroleum fell 2.5 percent in the month but is not an isolated factor pulling prices down as non-petroleum import prices fell 0.3 percent in the month. Agricultural exports are the wildcard on the export side and they fell a sizable 1.1 percent but here too, the deflationary pull is widespread with non-agricultural export prices down 0.6 percent.

Year-on-year contraction is perhaps less severe than prior months but not by much. Import prices are down a year-on-year 9.4 percent with non-petroleum import prices at minus 3.4 percent. Import prices from Canada are down the heaviest, at minus 18.0 percent on the year, with Latin America next at minus 12.7 percent. Showing the least price weakness are imports from China at minus 1.5 percent. Export prices are down 6.3 percent on the year with non-agricultural prices down 5.7 percent.

Of special concern are continuing incremental decreases for prices of finished goods, both imports and exports. Federal Reserve policy makers have been waiting for an easing drag from low import prices, not to mention oil prices as well, with neither yet to appear. Contraction in import prices not only reflects low commodity prices but also the strength of the dollar which has been giving U.S. buyers more for their dollars.

Japan big manufacturers’ mood worsens in Q4

Dec 10 (Reuters) — Big Japanese manufacturers’ sentiment worsened in October-December, a government survey showed. The business survey index (BSI) of sentiment at large manufacturers stood at plus 3.8 in October-December, compared with plus 11.0 in July-September, according to the joint survey by the Ministry of Finance and the Economic and Social Research Institute, an arm of the Cabinet Office, released on Thursday. The BSI measures the percentage of firms that expect the business environment to improve from the previous quarter minus the percentage that expect it to worsen.

Payrolls, Trade

The growth rate continues to decelerate (see chart):

NFP

er-12-4-1

Highlights
Payroll growth is solid and, though wages aren’t building steam, today’s employment report fully cements expectations for December liftoff. Nonfarm payrolls rose a very solid 211,000 in November which is safely above expectations for 190,000. And there’s 35,000 in upward revisions to the two prior months with October now standing at a very impressive 298,000. The unemployment rate is steady and low at 5.0 percent with the participation rate less depressed, up 1 tenth to 62.5 percent.

But earnings data are not impressive, up a monthly 0.2 percent vs October’s outsized 0.4 percent gain. And the year-on-year rate for average hourly earnings is down 2 tenths to 2.3 percent.

Payroll data show a 46,000 jump in construction where activity right now is very strong. This follows construction gains of 34,000 and 19,000 in the two prior months. Trade & transportation, reflecting activity in the supply chain, is also very strong with November and October gains of 49,000 and 46,000. Payrolls are also on the rise in retail trade, up 31,000 and 41,000 the last two months to indicate that retailers are gearing up aggressively for this holiday season. One negative, however, is a 12,000 dip in temporary help services which nearly cuts in half the prior month’s 28,000 gain. Demand for temporary services is considered a leading indicator for permanent hiring.

And weekly hours slipped in the month, down 1 tenth to 34.5 hours. Data on manufacturing are flat and point to little change for November production. And one negative in the report is a 1 tenth uptick to 9.9 percent for the broadly defined U-6 unemployment rate which had, however, dropped sharply in the prior months.

Despite soft spots and though earnings are flat, this report confirms that the nation’s labor market is solid and growing and, for the Fed, it supports arguments for the beginning of policy normalization.
er-12-4-2

U6 still well above pre recession levels:
er-12-4-3
Export weakness- much of it, as previously discussed, is oil related as oil exporting states cut back on spending and foreign oil capex declines as well- is beginning to dominate. Also, as previously discussed, falling US oil production and rising gasoline consumption are beginning to increasingly offset the drop in price for oil related imports.

In other words, all considered, the drop in oil prices is causing the negative trade gap to widen rather than narrow as most expected.

This makes the oil price collapse fundamentally a negative for the $US rather than a positive.

International Trade
er-12-4-4
Highlights
The nation’s trade deficit came in at the high end of expectations in October, at $43.9 billion with details reflecting oil-price effects but also soft foreign demand. Exports fell 1.4 percent in the month while imports, pulled down by oil, fell 0.6 percent. The decline for goods exports, at 2.5 percent, is in line with last week’s advance data but not for imports where goods declined 0.6 percent, vs the advance reading of minus 2.1 percent. Exports of services are once again solid at plus 0.7 percent.

Low prices for oil held down imports of both crude and industrial supplies. Imported crude averaged $40.12 per barrel in the month vs $42.72 in September and, in a reminder of the commodity price collapse, vs $88.47 a year ago. Turning to finished goods, however, imports do show gains with capital goods up as well as autos and consumer goods. Country data show a narrowing with China to $33.0 billion, which ends five straight months of widening, and a widening with the EU to $13.4 billion.

This report is mixed, confirming weakness abroad but showing some life at home. But, with exports down, the data do point to a slow start for fourth quarter GDP.