Auto sales, Deficit news, Budget news, Germany news, Japan news

Looks like a weak start for 2017:

From WardsAuto: Forecast: January Forecast Calls for Low Sales, High Inventory

The U.S. automotive industry is expected to a have a slow start in the new year, with January light-vehicle sales down 4.4% from like-2016. … The resulting seasonally adjusted annual rate is 17.0 million units, well below the 18.3 million in the previous month and 17.4 million year-ago.

December inventory was 9.2% above same-month 2015, the biggest year-over-year gap since the summer of 2014. Weak sales in January will keep inventory levels high, 16.0% greater than year-ago. A 93-day supply is expected to be available at the end of the month, a major jump from 62 days in December and 77 in January 2016.
emphasis added

Read more at http://www.calculatedriskblog.com/2017/01/vehicle-sales-forecast-sales-around-17.html#tsmvSK1MApIVDcKE.99

The positive, surprise zig up last month is now forecast to zag back down into negative territory, as previously discussed:

12503

The federal deficit remains far to small meaning the deceleration of the growth of output and employment we’ve seen over the last two years is likely to continue. That said, looks to me like tax revenues will continue to decline over the course of the next year due to earnings and employment weakness and therefore the federal deficit will be larger than this forecast indicates:

U.S. deficit forecast to shrink in 2017 but climb over next decade (Reuters) The CBO projected the deficit to fall slightly to $559 billion in fiscal year 2017, which ends on Sept. 30, compared to $587 billion a year earlier, and it was seen lower still in 2018 at $487 billion. After that, according to the CBO, deficits are expected to grow steadily over the next decade to $1.4 trillion by fiscal 2027. The CBO forecast that $8.6 trillion will be added to the federal debt over the next 10 years. The CBO also forecast U.S. real gross domestic product growth in calendar year 2017 at 2.3 percent, slowing to 2 percent in 2018.

As previously discussed, spending cuts are contractionary/deflationary, and far more potent than the proposed tax cuts:

Conservatives Try to Shape Donald Trump’s Budget Priorities (WSJ) President Donald Trump is expected to release next month the outlines of his first budget that will then be fleshed out later in March or April. Budget experts tasked to oversee the transition at OMB have been using pieces of a budget blueprint advanced by the Heritage Foundation. Altogether, the Heritage plan offers about $97 billion in discretionary spending cuts for the current year, equal to about 8% of discretionary spending and 2% of total spending. It proposed even larger cuts to automatic spending programs, including entitlements, for a combined $10.5 trillion in savings over a decade, or around 20% of all government spending.

More euro friendly news here:

Germany raises growth forecast for 2017 exports, imports (Reuters) Germany expects both exports and imports to grow faster this year than previously forecast, a government source told Reuters on Tuesday, providing an optimistic outlook despite fears of protectionism under U.S. President Donald Trump. The source in the right-left ruling coalition said the government expected exports to grow 2.8 percent in 2017, up from a previous forecast of 2.1 percent. Imports are forecast to grow by 3.8 percent, up from a previous estimate of 3 percent.

Yen friendly news here:

Japan exports up for first time in 15 months, U.S. protectionism poses risks (Reuters) Ministry of Finance data showed on Wednesday that exports rose 5.4 percent year-on-year in December. It followed an annual 0.4 percent decline in November. Shipments in terms of volume also rose 8.4 percent from a year earlier. In December, the value of exports to the United States rose 1.3 percent year-on-year. Exports to China rose 12.5 percent in December to 1.3 trillion yen ($11.44 billion). The data showed Imports fell 2.6 percent in the year to December, resulting in a trade surplus of 641.4 billion yen.

Retail hiring, Alaska

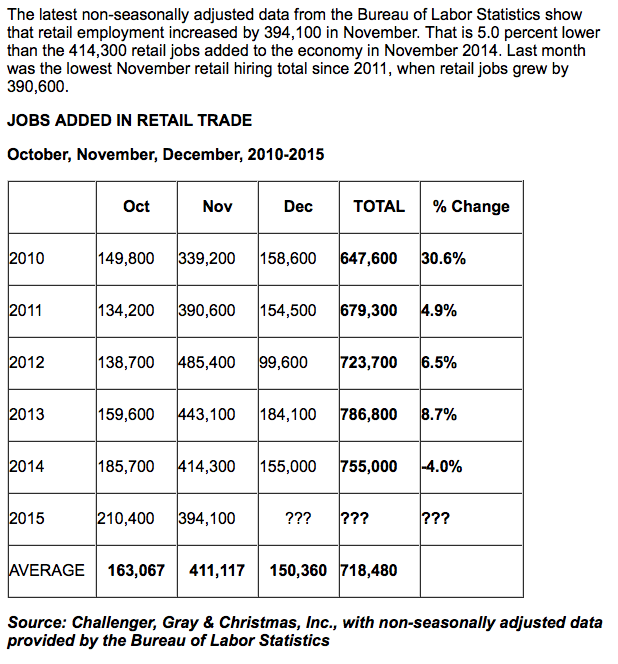
November Retail Hiring Falls To 4-Year Low – 5% Fewer Than One Year Ago

er-12-9-5
As it says, Alaska is not alone, as spending cuts and tax increases due to the oil price collapse continue into next year:

Alaska governor proposes first income tax in 35 years

Dec 9 (AP) — Alaska Gov. Bill Walker is proposing instituting a personal income tax for the first time in 35 years as the oil-dependent state looks to plug a multibillion-dollar budget deficit amid chronically low prices.

In laying out his budget plan Wednesday, Walker also proposed using the fund that provides annual checks to most Alaskans to generate a stream of cash to help finance state government. The plan would change how dividends are calculated and mean lower checks, at least initially — with 2016 payouts about $1,000 less than this year’s.

Alaska isn’t alone among oil-producing states to experience hard times as oil prices stay low. But unlike states like Texas or Louisiana, Alaska has few other industries to make up the difference.

Walker’s proposal also includes:
—Adding a dime to every drink of alcohol and $1 per pack of cigarettes.

—Additional budget cuts.

—Changes to the oil tax credit system, a big budget item.

—Increases to industry taxes including mining, fishing and oil.

Mtg Purchase Apps, Saudi Pricing History, China

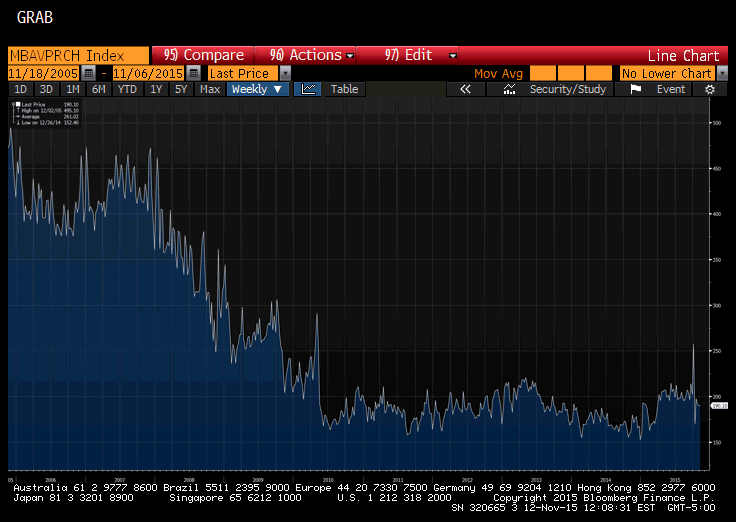
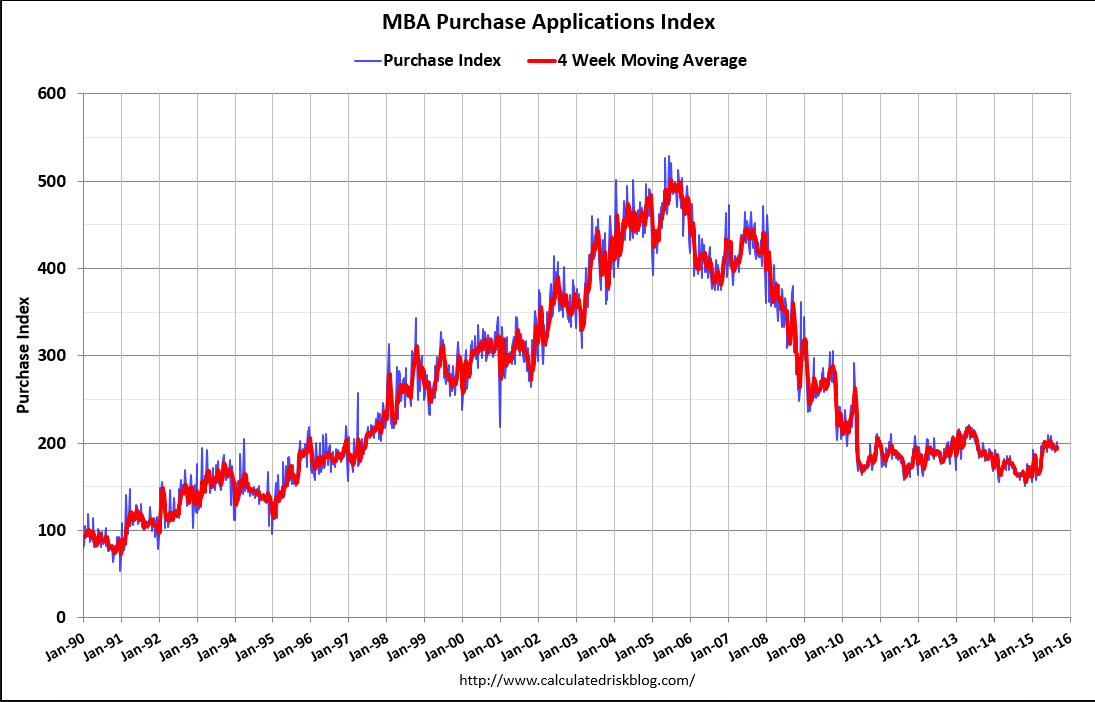
So much for housing leading the way up- looks to have gone from flat to down:

MBA Mortgage Applications
er-11-12-1

sg2015111243711
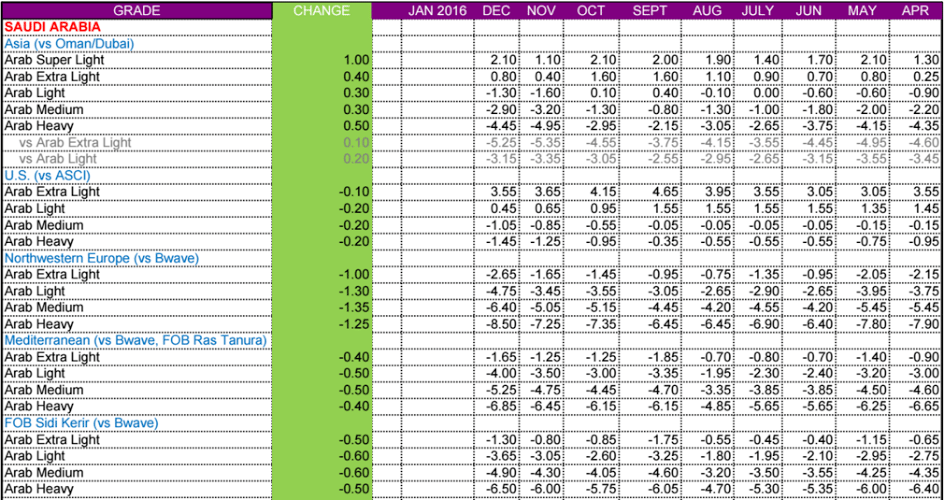
For the most part Saudis have been lowering premiums and increasing discounts which causes prices to fall to get their sales up to their pumping capacity:
er-11-12-2

Not without a bit of pain, which they may have come to believe inevitable due to long term supply/demand dynamics:

Saudi Arabia risks destroying Opec and feeding the Isil monster

(Telegraph) &#8212 The rumblings of revolt against Saudi Arabia and the Opec Gulf states are growing louder. The International Energy Agency (IEA) estimates that the oil price crash has cut Opec revenues from $1 trillion a year to $550bn. US output has dropped by 500,000 b/d since April, but the fall in October slowed to 40,000 b/d. Total production of 9.1m b/d is roughly where it was a year ago when the price war began. A confidential order from King Salman has frozen new hiring by the state, stopped property contracts and purchases of cars, and halted a long list of projects.

We’ll see what this means in actual practice:

Li promises full use of fiscal weapons

(Xinhua) — To lead to a major lift in the nation’s productivity, the government will ensure a steady business environment for all major sectors of the market, the president said. The government will make full use of fiscal policies, reduce taxes properly and help companies to overcome their difficulties and upgrade structure, Li told the meeting. The government will invest more to improve infrastructure in central and western China to achieve balanced development, and private companies are welcome to invest in such projects, Li said.

Mtg Purchase Apps, Arch. Billings, Japan Exports, Bernie Article

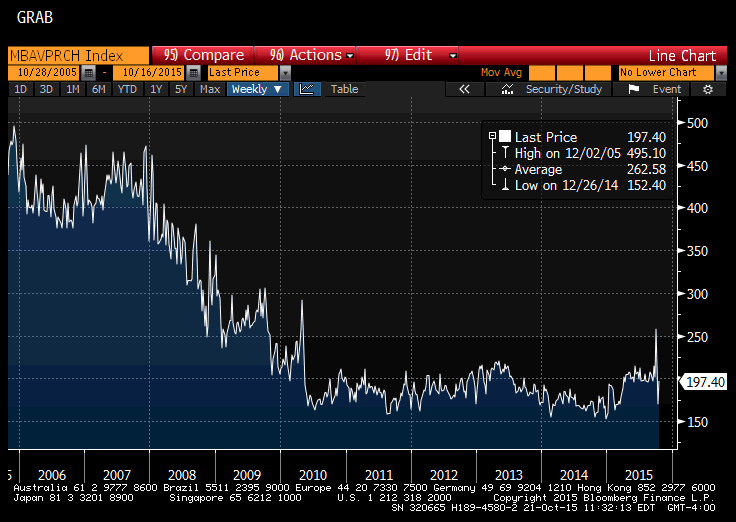
After the up and down in front of the change in regulations new purchase apps are, so far, lower than before:
sg2015102141533 (1)

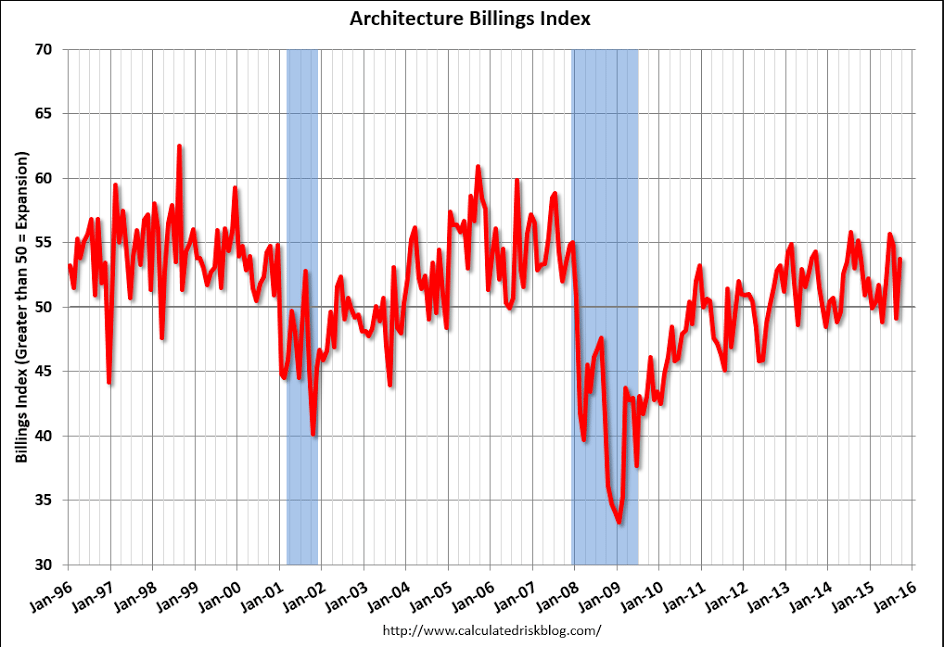
Fits with the permit spike/decline story, and there was also this note:

The multi-family residential market was negative for the eighth consecutive month – and this might be indicating a slowdown for apartments – or at least less growth.
er-10-21-5

Japan export growth slows sharply, raising fears of recession

By Tetsushi Kajimoto

Oct 21 (Reuters) — Japan’s annual export growth slowed for the third straight month in September, a worrying sign that overseas sales continued to drag on growth last quarter, adding to fears of a recession.

Ministry of Finance data showed exports rose just 0.6 percent in the year to September, against a 3.4 percent gain expected by economists in a Reuters poll.

That was the slowest growth since August last year and followed a 3.1 percent gain in August 2015. Compared with last month seasonally-adjusted shipments declined 1.7 percent.

Wednesday’s data is the first major indicator for September and is part of the calculation of third quarter gross domestic product. A third quarter contraction would put Japan into recession, given the second quarter’s negative GDP data.

China’s slowdown and soft domestic demand weighed on factory output and the broader economy, although the Bank of Japan saw the effects of China’s slowdown were limited for now, as it sticks to its rosy growth outlook, but that may change at the BOJ’s monetary policy review on Oct. 30.

The author is on the right track- it’s about aggregate demand and ‘inflation’ from excess demand.

But it’s not about rates per se, which are about the Fed’s reaction function, which does happen to include inflation, so to that extent it’s sort of ok…

Bernie Sanders doesn’t need to pay for his socialist utopia

By Jeff Spross

Without a doubt, presidential contender Bernie Sanders boasts the most ambitious policy proposals of anyone on the Democratic side. And sooner or later, the same question always comes up:

“Yeah, those are lovely ideas, but how’s he gonna pay for all this?”

For people who oppose Sanders’ program, it makes for a nice “gotcha.” But Sanders’ supporters bring it up sometimes too. Comedian Bill Maher pressed the senator on this last Friday, and Sanders dutifully listed off various ideas. They might bring in enough revenue or they might not; like his fellow candidates, Sanders’ proposals are still in their protean stage. What’s interesting is that Sanders and his fans are implicitly conceding that, yes, we would need to pay for this stuff.

May I humbly suggest this is wrong?

Not only do we not need to pay for Sanders’ programs, we shouldn’t pay for them. In fact, the federal government’s budget deficit is much too low.

How could I possibly suggest anything so loony? Contrary to popular belief, smaller deficits are not always better. How big or small the deficit should be is determined by how it interacts with the rest of the U.S. economy and other international economies. And there are two key metrics to look for there: interest rates and inflation.

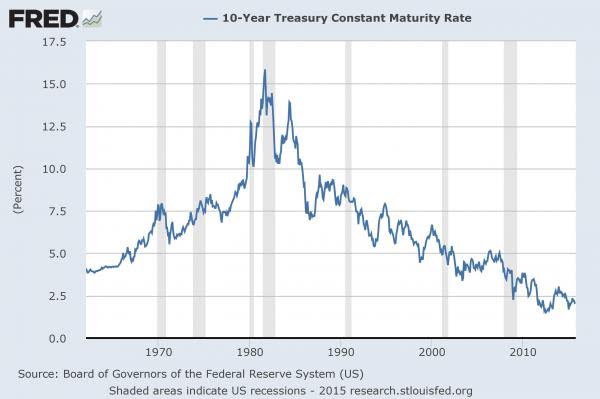
Like you or me or any company, when the U.S. government borrows money, it pays its lenders interest. This is an investment by the lender based on how much risk they want to take. So if they consider you a safe investment, they’ll demand low interest rates, and if they consider you a risky investment, they’ll demand higher rates. And interest rates on U.S. debt are currently the lowest they’ve been in at least half a century:
er-10-21-6
Equally important is why. If investors consider government debt unusually safe, it’s because they aren’t seeing lots of other places in the economy worth investing in. This shouldn’t be surprising: Our economic growth and job creation remain sluggish, there are no signs of wage growth, work force participation isdown, and economic insecurity remains high. There’s just not a lot of exciting economic ferment going on out there.

One big reason for this is that the government itself has pulled way back from spending money in the economy and hiring people. Economic ferment breeds economic ferment. More government aid, investment and hiring would mean more people with incomes to spend, creating more jobs in the private sector. So there should be a natural corrective here: Interest rates on government debt fall because it’s the only safe investment, so government borrows more and spends it, the economy picks up, and interest rates on the debt rise as investors find other places to park their cash.

But American policymakers moralize debt and deficits and think they should always be smaller, so that doesn’t happen.

Which brings us to the other key metric: inflation. Unlike you or me or any company, the U.S. government can print (or, in the digital age, create) money. At the end of the day, if you’re worried that government borrowing will drive up interest rates, you can always just have your central bank print more money and buy up government debt. One of the big reasons investors view the debt of advanced governments as safe is because, at the end of the day, they can always pay you back with money creation. And the central bank buying debt raises the demand for it, which brings interest rates back down.

But it also adds to the money supply, which threatens inflation — except that, as with interest rates, inflation is only going to rise once we’ve attained full employment. That’s when the new money stops being soaked up by new economic activity, and starts going into price increases instead. But the Federal Reserve has actually been creating a ton of new money recently, and it hasn’t really goosed the economy. That’s probably because the normal ways the Fed injects money into the economy don’t work as well as going in via government hiring and state aid.

So at the highest conceptual level, money printing and borrowing — monetary policy and fiscal policy — collapse into one another. This makes inflation, even more than interest rates, the key upper limit to government borrowing.

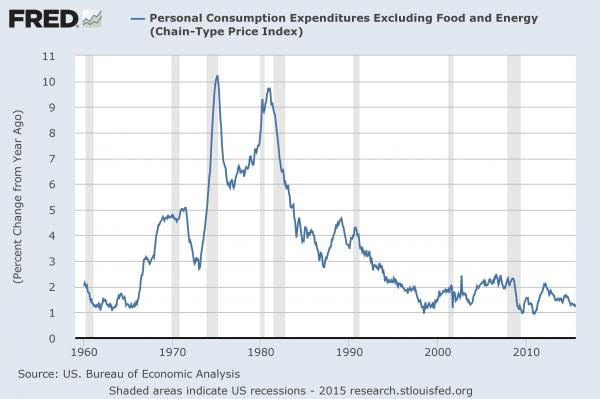
And the inflation rate is, well, about as low as it’s been in half a century:
er-10-21-7
The conclusion, by now, should be obvious: Government deficits are too low, and have been too low for agood long while.

Once you realize all this, it actually upends a lot of conventional wisdom. People usually talk about taxes and spending as being in balance with one another, but they’re actually both in balance with two other forces: the money supply and the overall health of the economy. You really can’t think of the government as just another economic actor, like an individual person or a business. It’s a unique thing unto itself: a hub or ballast tank for the overall flow of money and activity through the economy. No, its capacities to borrow and print money aren’t infinitely elastic. But it’s perfectly plausible that we could enter periods, like the current global doldrums, where government should run really big deficits and print lots of money for extended periods.

Take Bernie Sanders’ own favored example of Denmark: The Danes run a very generous welfare state, and have taxes high enough to pay for it. But Denmark is also facing a sluggish economy and rock-bottom inflation. So it’s actually being much too fiscally responsible. Denmark should expand its deficit — in this case, given the size of its deficit, by cutting its tax rates — and loosen up its monetary policy to buy up all that new debt. Taxes, under this logic, aren’t really about bringing in revenue — rather, they’re just another dial for managing this flow. And it’s conceivable that they would never need to balance with spending.

What’s funny is that Sanders might be gearing up to make this very argument. His chief economic adviser, University of Missouri-Kansas City economist Stephanie Kelton, is a fan of something called modern monetary theory: a batch of ideas that sketches out a very similar case to the one above.

Of course, Sanders hasn’t done this yet. And maybe he won’t.

But if he ever chose to throw down in favor of bigger deficits and more money-printing — on the national stage of a presidential election, no less — he’d be doing the country a tremendous service.

Producer Prices, Retail sales, Business inventories, Atlanta Fed, Debt Ceiling Comment

Gives the Fed another dovish data point:

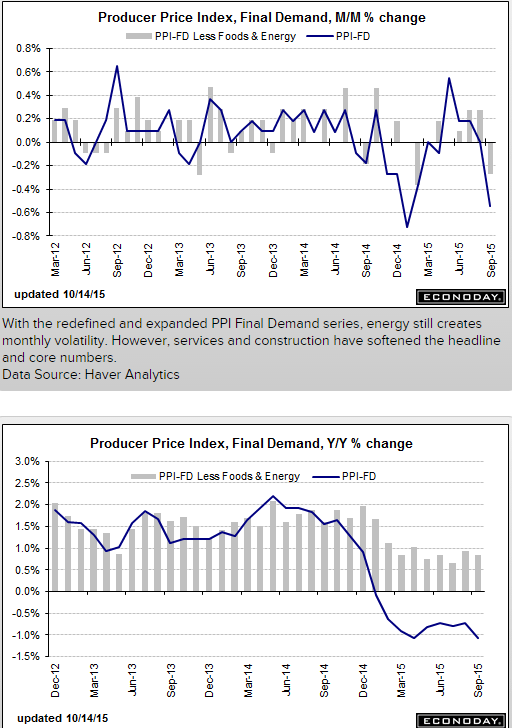
PPI-FD
er-10-14-4
Highlights
Producer prices show wide weakness and may raise talk that deflationary pressures are building, not easing. The PPI-FD fell 0.5 percent in September which is just below Econoday’s low estimate for minus 0.4. Year-on-year, producer prices are falling deeper into the negative column at minus 1.1 percent. And it’s not all due to energy excluding which and also excluding food, prices fell 0.3 percent though the year-on-year rate is still in the plus column, at plus 0.8 percent but down 1 tenth from August. Excluding food, energy and services, where the latter had been showing price traction, prices still fell 0.3 percent with the year-on-year rate at only plus 0.5 percent.

The services weakness, down 0.4 percent in the month, follows two prior gains of 0.4 percent that had been cited as evidence of resilience in domestic demand. Exports remain very weak at minus 0.8 percent in the month following August’s 0.4 percent decline. September energy prices fell 5.9 percent and are down 23.7 percent year-on-year. Gasoline fell a monthly 16.6 percent for a 42.8 percent year-on-year decline.

Other readings include a 1.3 percent decline for finished goods where the year-on-year rate, following a long string of monthly declines, is down 4.1 percent. This is an important reading that points to pass through of low raw material prices.

Hawks at the Fed are saying that the negative price effects from oil and low import prices will prove temporary. That may be, but the depth of ongoing price weakness continues to sink. Watch for the consumer price report on tomorrow’s calendar.
er-10-14-5

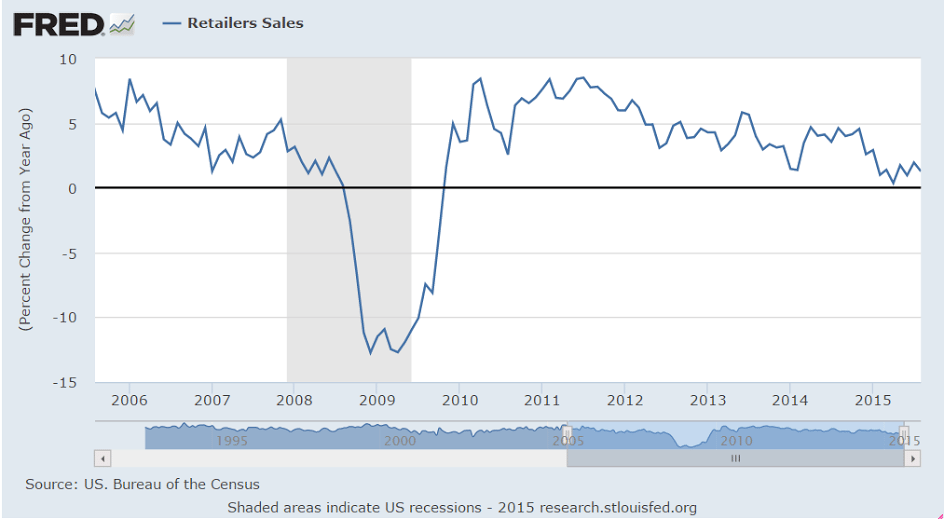
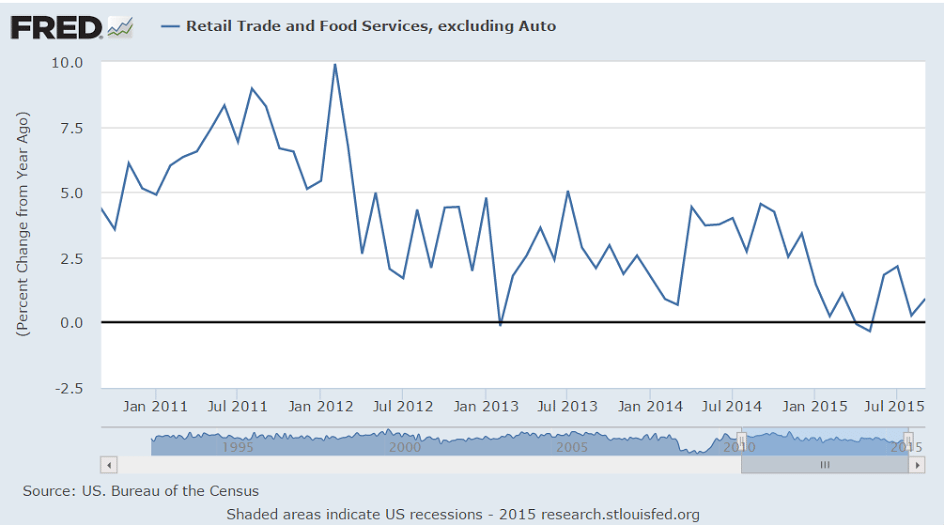
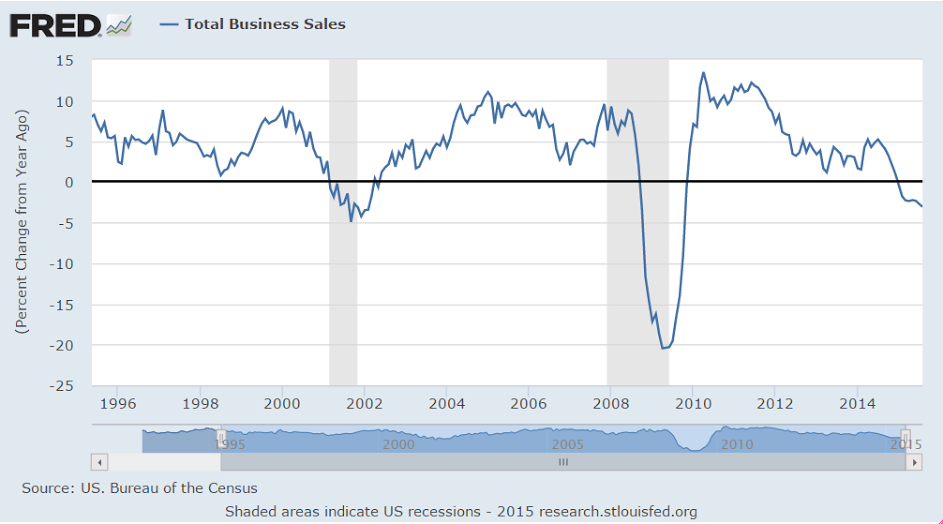
This continues to disappoint, no matter how they try to spin it. And total sales do count, as they are also the total income for the sellers, so that’s been slowing as well:

Retail Sales
er-10-14-6
Highlights
Weakness at gasoline stations, where low prices are depressing sales totals, continues to exaggerate weakness in retail sales where the headline inched only 0.1 percent higher in September. Gasoline sales fell 3.2 percent in the month, excluding which the headline looks far more respectable at plus 0.4 percent.

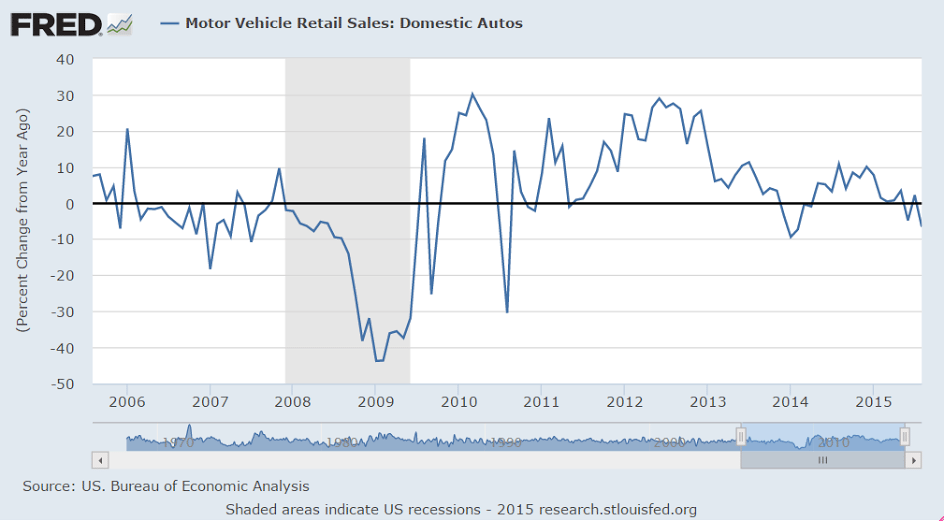
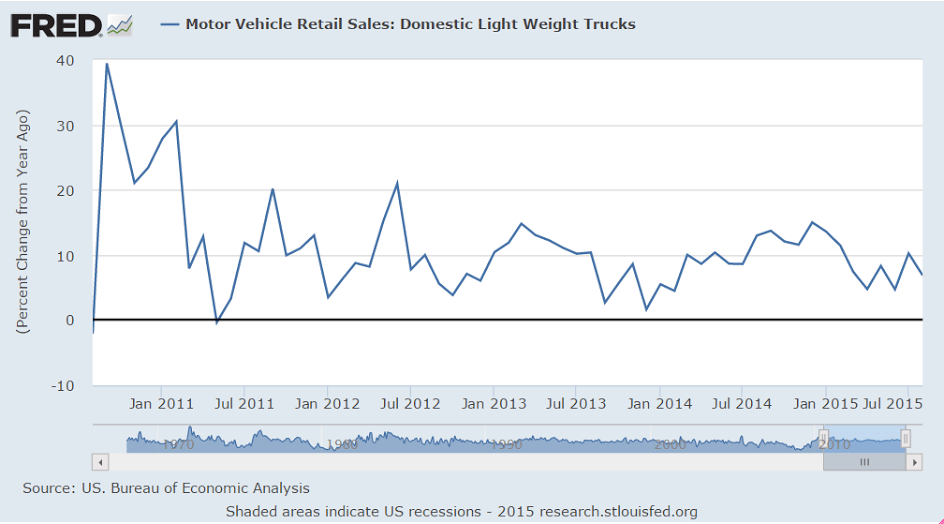
And there are plenty of tangible positives in the data including a third straight solid gain for motor vehicles, at plus 1.7 percent in September, and a second straight outsized gain of 0.9 percent for restaurants. Both of these are discretionary categories and point to underlying consumer strength. Clothing stores are also posting strong gains, up 0.9 percent despite negative price effects from lower import prices.

Price weakness is not only pulling down gasoline sales but also sales at food & beverage stores which fell 0.3 percent. But there are signs of consumer retracement in the September report with the general merchandise category, which is very large, down 0.1 percent, and with health & personal care stores unchanged. Building materials fell 0.3 percent with electronics & appliance stores down 0.2 percent.

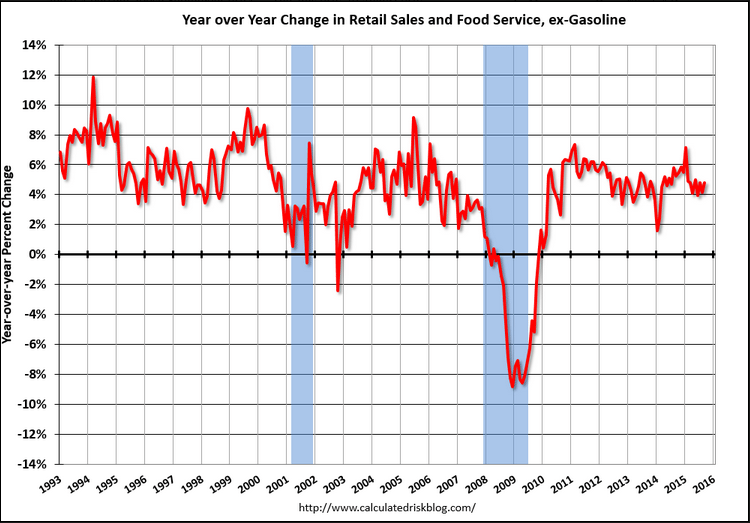
Looking at adjusted year-on-year rates helps clarify the trends. Excluding gasoline stations, retail sales are up a very respectable 4.9 percent which is well above the less impressive 2.4 percent gain for total sales. Sales at gasoline stations are down a year-on-year 19.7 percent. Leading the positive side are motor vehicles, up 8.8 percent, and restaurants, up 7.9 percent — both robust gains. Core sales, that is ex-auto ex-gas, the year-on-year rate is a moderate plus 3.8 percent for a 1 tenth decline from August.

One of the very biggest positives for the consumer right now, aside from strength in labor demand, is the weakness in pump prices, which however in this report, where dollar totals are tracked and not sales volumes, turns into a negative. Still, the headline is weak and will likely lower third-quarter GDP estimates — but for Fed policy, because the weakness is skewed due to gas prices, the results are harder to assess and may prove neutral.

er-10-14-7
Imports have a much lesser effect on the economy:
er-10-14-8
This is where the domestic growth has been, which has been about the same growth rate for the last few years:
er-10-14-9
er-10-14-10

And even this is low vs prior cycles:
er-10-14-11
Yet another big negative here. Again, it’s the same unspent income story. If agents spent less than their incomes others must have spent more than their incomes or inventory went unsold, which is exactly what’s been happening. And unsold inventory = cuts in output and employment = less income = less spending etc. until some agent starts spending that much more than his income. Most often that’s govt, spending more than its income (deficit spending) on rising unemployment benefits, and experiencing reduced tax revenues in the slow down:

Business Inventories
er-10-14-12
Highlights
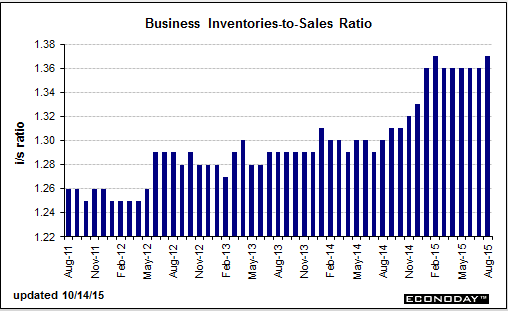
There’s evidence of economic weakness coming from inventory data where inventories are being kept down but are still building relative to sales. Business inventories were unchanged for a second month in August while sales fell a sizable 0.6 percent, driving up the inventory-to-sales ratio to 1.37 from 1.36.

Inventory downscaling is underway in manufacturing which is being hurt by weak exports. Manufacturing inventories fell 0.3 percent in both August and July against a major sales decline of 0.7 percent in August and a 0.2 percent dip in July. There’s less inventory downscaling, at least right now, among wholesalers where inventories rose 0.1 percent but sales at wholesalers are even weaker, down 1.0 percent in the month. Retail, the third component, is not immune with sales down 0.1 percent but inventories up 0.3 percent.

Inventories are looking heavy which could limit production and employment growth and could emerge as a new concern for the doves at the Fed.

er-10-14-13
er-10-14-14
Revised down again:
er-10-14-15
Applying leverage here is, functionally, subversive:

McConnell’s Last Stand: He Wants Medicare, Social Security Cuts to Raise Debt Limit

By Rob Garver

Oct 13 (Fiscal Times) — In case anyone thought things couldn’t get more chaotic on Capitol Hill, Senate Majority Mitch McConnell appears ready to set them straight. McConnell, according to a report first published by CNN, plans to make several major demands of the White House, including changes to Medicare, Social Security, and EPA regulations as his price for raising the nation’s debt limit.

China trade, WRKO interview

Total trade is down, but the surplus is still high and holding, which ultimately supports the currency:

China : Merchandise Trade Balance
er-10-13-5
Highlights
Every month China’s trade data are reported in both the renminbi and U.S. dollars by the National Bureau of Statistics. The renminbi report comes out first, followed about an hour later by the more closely-watched U.S. dollar report. Since the August 11 devaluation of the renminbi there is a wider discrepancy between the two sets of data and it has taken on added significance.

September imports, in renminbi terms, fell 17.7 percent from a year ago after dropping 14.3 percent in August. This is the 11th consecutive decline and the worst pace since May. But, exports fell just 1.1 percent, holding up much better than expected. This is third straight decline and points to some stabilization. As a result of weakening imports but improving exports, the trade surplus surged to a record high. The surplus was Rmb376 billion. That was almost 30 percent higher than the August surplus.

Low commodity prices, compounded by deteriorating domestic demand, are cutting the import bill. Exports have performed comparatively better but are also weak and are falling in year-on-year terms.

The trade surplus in U.S. dollar terms was $60.3 billion. On the year, exports were down a less than anticipated 3.7 percent while imports plunged 20.4 percent.
er-10-13-6

Short interview on recession possibility:

Mtg purchase applications, UK industrial production, Saudi visit, US budget deficit

Purchase apps came in 41% higher than a year ago, but have been going nowhere for several months and now look to be drifting lower, as in any case they remain at seriously depressed levels:

MBA Mortgage Applications
er-9-9-1
Highlights
After jumping 17.0 percent in the prior week on a rate-related surge in refinancing applications, the refinance index fell back 10 percent in the September 4 week. The purchase index continues to show much less volatility, down 1.0 percent in the week. Rates were little changed in the week with the average 30-year mortgage for conforming loans ($417,000 or less) up 2 basis points to 4.10 percent.
er-9-9-2

Blow up of the last few years. Note the recent decline:
er-9-9-3

Great Britain : Industrial Production
er-9-9-4
Highlights
The UK goods producing sector significantly underperformed expectations in July. Overall industrial production fell 0.4 percent on the month, matching its June decline, while the key manufacturing sector contracted a hefty 0.8 percent, easily eclipsing a 0.2 percent rise last time.

The monthly fall in manufacturing output reflected decreases in seven of the thirteen reporting subsectors. Within this, the steepest drop was posted by basic metals and metals products (5.7 percent), mainly due to weakness in weapons production which can be very volatile and this alone accounted for half of the overall decline. The second largest negative impact came from transportation equipment which subtracted 0.3 percentage points from monthly growth. However, outside of these categories performances were rather better and in particular there was a solid 5.8 percent gain in pharmaceuticals, in part courtesy of surprisingly buoyant export demand.

Total industrial production found some support from a 0.4 percent monthly increase in the volatile mining and quarrying subsector together with rises in electricity, gas, steam and air conditioning (1.3 percent) as well as in water and waste management (0.5 percent).

The latest data leave overall goods production in July 0.6 percent below its second quarter average and, on the same basis, manufacturing output down some 0.9 percent. The August manufacturing PMI (51.5) was less than bullish and while last month probably saw kind of a rebound, it looks as if industrial production will not provide much of a boost to real GDP growth this quarter. Whether the Fed tightens or not this month, there is still little pressure on the BoE MPC to hike any time soon.

er-9-9-5

What little growth we do get only tightens the noose further as govt’s net contribution to aggregate demand is further reduced. For 2014 the US economy was supported by oil related capital expenditures that ended when prices collapsed late last year, and so far year I’ve seen nothing stepping up to replace it, apart from increases in unsold inventories and accounting for the new health care premiums as an increase in personal consumption. With the federal deficit now below that of the euro area the rest of the US economy is likely heading in that direction as well:

CBO: Fiscal 2015 Federal Deficit through August more than 10% below Last Year

More good news … the budget deficit in fiscal 2015 will probably decline more than 10% compared to fiscal 2014.

From the Congressional Budget Office (CBO) today: Monthly Budget Review for August 2015

The federal government’s budget deficit amounted to $528 billion for the first 11 months of fiscal year 2015, the Congressional Budget Office estimates. That deficit was $61 billion smaller than the one recorded during the same period last year. Revenues and outlays were both higher than last year’s amounts, by 8 percent and 5 percent, respectively. Adjusted for shifts in the timing of certain payments (which otherwise would have fallen on a weekend), the deficit for the 11-month period decreased by $42 billion.

In its most recent budget projections, CBO estimated that the deficit for fiscal year 2015 (which will end on September 30, 2015) would total $426 billion, about $59 billion less than the shortfall in fiscal year 2014. …
The Treasury will run a surplus in September, and it appears the deficit for fiscal 2015 (ends in September) will be below 2.4% of GDP.

The Treasury will run a surplus in September, and it appears the deficit for fiscal 2015 (ends in September) will be below 2.4% of GDP.

Krugman on debt

Debt Is Good

By Paul Krugman

Aug 21 (NYT) — Rand Paul said something funny the other day. No, really — although of course it wasn’t intentional. On his Twitter account he decried the irresponsibility of American fiscal policy, declaring, “The last time the United States was debt free was 1835.”


Which consequently was followed by the worst depression in US history.

Wags quickly noted that the U.S. economy has, on the whole, done pretty well these past 180 years, suggesting that having the government owe the private sector money might not be all that bad a thing. The British government, by the way, has been in debt for more than three centuries, an era spanning the Industrial Revolution, victory over Napoleon, and more.

But is the point simply that public debt isn’t as bad as legend has it? Or can government debt actually be a good thing?

Believe it or not, many economists argue that the economy needs a sufficient amount of debt out there to function well.


Yes, to offset desires to not spend income (save) when private sector borrowing to spend isn’t sufficient, as evidenced by unemployment.

And how much is sufficient? Maybe more than we currently have. That is, there’s a reasonable argument to be made that part of what ails the world economy right now is that governments aren’t deep enough in debt.


Yes, it’s called unemployment, which is the evidence that deficit spending is insufficient to offset desires to not spend income. Something economists have known by identity for at least 300 years.

I know that may sound crazy. After all, we’ve spent much of the past five or six years in a state of fiscal panic, with all the Very Serious People declaring that we must slash deficits and reduce debt now now now or we’ll turn into Greece, Greece I tell you.

But the power of the deficit scolds was always a triumph of ideology over evidence, and a growing number of genuinely serious people — most recently Narayana Kocherlakota, the departing president of the Minneapolis Fed — are making the case that we need more, not less, government debt.

Why?


This is the right answer- because the US public debt, for example, is nothing more than the dollars spent by the govt that haven’t yet been used to pay taxes. Those dollars constitute the net financial dollar assets of the global economy (net nominal savings), as actual cash, or dollar balances in bank accounts at the Federal Reserve Bank called reserve accounts and securities accounts. Functionally, it is not wrong to call these dollars the ‘monetary base’. And a growing economy that generates increasing quantities of unspent income likewise needs an increasing quantity of spending that exceeds income- private or public- for a growing output to get sold.

One answer is that issuing debt is a way to pay for useful things, and we should do more of that when the price is right.


Wrong answer. It’s never about ‘when the price is right’. It is always a political question regarding resource allocation between the public sector and private sector.

The United States suffers from obvious deficiencies in roads, rails, water systems and more; meanwhile, the federal government can borrow at historically low interest rates.


Wrong answer. Yes, there is a serious infrastructure deficiency. The right question, however, is whether the US has the available resources and whether it wants to allocate them for that purpose.

So this is a very good time to be borrowing and investing in the future, and a very bad time for what has actually happened: an unprecedented decline in public construction spending adjusted for population growth and inflation.


I agree it’s a good time to fund infrastructure investment, due to said deficiencies.

However, whether or not it’s a good time to increase deficit spending is a function of how much slack is in the economy, as evidenced by the unemployment rates, participation rates, etc. And not by infrastructure needs.

And my read based on that criteria is that it’s a good time for proactive fiscal expansion.

Nor in any case is deciding whether or not to increase deficit spending rightly about whether or not to increase borrowing per se for a government that, under close examination, from inception necessarily spends or lends first, and then borrows. As Fed insiders say, ‘you can’t do a reserve drain without first doing a reserve add.’

Beyond that, those very low interest rates are telling us something about what markets want.


Wrong, they are telling is something about what level market participants think the fed will target the Fed funds rate over time.

I’ve already mentioned that having at least some government debt outstanding helps the economy function better. How so?


Right answer- deficit spending adds income and net financial assets to the economy to support sufficient spending to get the output sold.

The answer, according to M.I.T.’s Ricardo Caballero and others, is that the debt of stable, reliable governments provides “safe assets” that help investors manage risks, make transactions easier and avoid a destructive scramble for cash.


Wrong answer. Net govt spending provides in the first instance provides dollars (tax credits) in the form of dollar deposits in reserve accounts at the Federal Reserve Bank. Treasury securities are nothing more than alternative deposits in securities accounts at the Federal Reserve Bank for those dollars. Both are equally ‘safe’.

Now, in principle the private sector can also create safe assets, such as deposits in banks that are universally perceived as sound. In the years before the 2008 financial crisis Wall Street claimed to have invented whole new classes of safe assets by slicing and dicing cash flows from subprime mortgages and other sources.

But all of that supposedly brilliant financial engineering turned out to be a con job: When the housing bubble burst, all that AAA-rated paper turned into sludge. So investors scurried back into the haven provided by the debt of the United States and a few other major economies. In the process they drove interest rates on that debt way down.


Rates went down in anticipation of future rate setting by the fed.

What investors did was reprice financial assets. Investors can’t change total financial assets. The total only changes with new issues and redemptions/maturities.

And those low interest rates, Mr. Kocherlakota declares, are a problem. When interest rates on government debt are very low even when the economy is strong, there’s not much room to cut them when the economy is weak, making it much harder to fight recessions.


True, but cutting rates doesn’t fight recessions. In fact low rates reduce interest income paid by govt to the economy, thereby weakening it.

There may also be consequences for financial stability: Very low returns on safe assets may push investors into too much risk-taking — or for that matter encourage another round of destructive Wall Street hocus-pocus.


That would be evidenced by an increase in the issuance of higher risk securities, but there has been no evidence of that. In fact, it was $100 oil that at the margin drove the credit expansion that supported GDP growth, as evidenced by the collapse when prices fell.

What can be done? Simply raising interest rates, as some financial types keep demanding (with an eye on their own bottom lines), would undermine our still-fragile recovery.


It would more likely very modestly strengthen it from the increase in the govt deficit due to the increased interest income paid by govt to the economy. However, I’d prefer a tax cut and/or spending increase to support GDP, rather than an interest rate increase. But that’s just me…

What we need are policies that would permit higher rates in good times without causing a slump. And one such policy, Mr. Kocherlakota argues, would be targeting a higher level of debt.


Mr. K isn’t wrong, but again I’d rather just have a larger tax cut to get to the same point, but, again, that’s just me…

In other words, the great debt panic that warped the U.S. political scene from 2010 to 2012, and still dominates economic discussion in Britain and the eurozone, was even more wrongheaded than those of us in the anti-austerity camp realized.


True, and this author…

Not only were governments that listened to the fiscal scolds kicking the economy when it was down, prolonging the slump; not only were they slashing public investment at the very moment bond investors were practically pleading with them to spend more; they may have been setting us up for future crises.


True but for differing reasons. It’s never about investors pleading. It’s always about the public purpose behind the policies.

And the ironic thing is that these foolish policies, and all the human suffering they created, were sold with appeals to prudence and fiscal responsibility.


The larger problem with this editorial is that the wrong reasons it gives for what’s largely the right policy are out of paradigm reasons that the opposition routinely shoots down and shouts down, easily convincing the electorate that they are correct and the ‘headline left’ is wrong.

Feel free to distribute
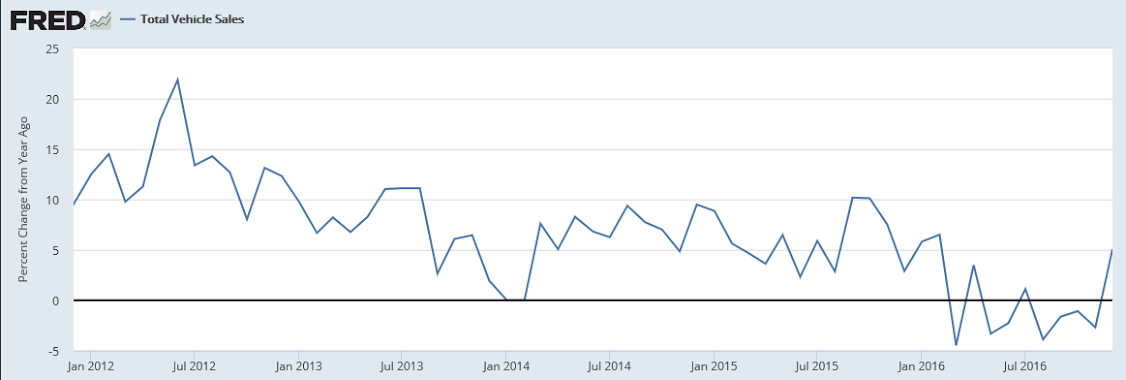
Federal Deficit below last year

The budget deficit is now looking too small to sustain growth, as evidenced by the incoming data over the last 6 months. The problem is, as always, unspent income- aka demand leakages- must be offset by agents spending more than their incomes or the output goes unsold. And collapsing GDP growth and rising inventory ratios are telling me that’s it’s been happening ever since the price of oil collapsed, ending the shale related capex, with nothing yet stepping up to fill that spending gap.

At the same time, the Federal govt is going the other way as, reducing the amount that it’s spending in excess of taxation. Additionally, with the current tax structure, if there is any pick up in growth from private sector credit expansion it will cause the federal deficit to further decline, which will require that much more private sector deficit spending to support growth. That’s why the tax structure and transfer payment structure are called ‘automatic fiscal stabilizers’. And, of course, if the economy does stall, the Fed will get the blame for ending QE and more recently allowing longer term rates to rise…

CBO: Fiscal 2015 Federal Deficit through May about 10% below Last Year