PMI services index, KC Fed

Much lower than expected from the service that tends to run much higher than the others.

Fed rate hike already working! ;)

PMI Services Flash
er-12-18-6
Highlights
The services PMI is slowing sharply this month, to 53.7 vs 56.1 for the final November reading and vs 56.5 for the flash reading. This is the lowest reading in a year reflecting the slowest growth in new orders since January and a fifth straight month of contraction in backlog orders. Optimism over future growth is understandably down, reflecting what the report says is a subdued global outlook, election uncertainty and softer demand in the energy sector. Price readings remain subdued with inputs at their weakest pace since February. Despite weakness in orders and the downcast outlook, hiring is described as “resilient”. Given weakness in global demand, the service economy is the nation’s bread and butter and today’s report, though only one data point, hints at slowing for the economy.

Bad! Fed rate hike already working here too! ;)

United States : Kansas City Fed Manufacturing Index
er-12-18-7
Highlights
Kansas City’s emergence above water didn’t last long, only one month in fact. The December index came in at minus 8 for the eighth contraction in nine months with only November’s modest plus 1 reading the exception. Production is in contraction as are both new orders and backlog orders with employment in severe contraction at minus 17. Price data are also in contraction. With oil prices continuing to move lower, the worst may not yet be over for the Kansas City economy.

From Calculated Risk:

According to Chad Wilkerson, vice president and economist at the Federal Reserve Bank of Kansas City, the survey revealed that Tenth District manufacturing activity declined moderately, although expectations for future activity remained solid.

“After two months of mostly steady activity, regional factories pulled back again in December,” said Wilkerson. “The weakest activity was in energy-concentrated states.”

Tenth District manufacturing activity declined moderately in December, reversing gains from the last several months, while producers’ expectations for future activity remained solid. Most price indexes continued to ease further.

The month-over-month composite index was -9 in December, down from 1 in November and -1 in October

The employment index dropped from -8 to -14, and the capital expenditures index posted its lowest level since August 2010. …

Future factory indexes were mixed, but remained at generally solid levels. The future composite index was basically unchanged at 7, while the future production, shipments, and new orders for exports indexes increased modestly.

Posted in Fed

Rate hike comment, Container traffic, Employment comment

So a Fed rate hike is nothing more than the federal government deciding to pay more interest on what’s called ‘the public debt’.

By immediately paying more interest on balances in reserve accounts at the Fed the cost of funds to the banking system is supported at that higher level, all of which influences the interest paid on securities accounts at the Fed as well, which influences the term structure of rates.

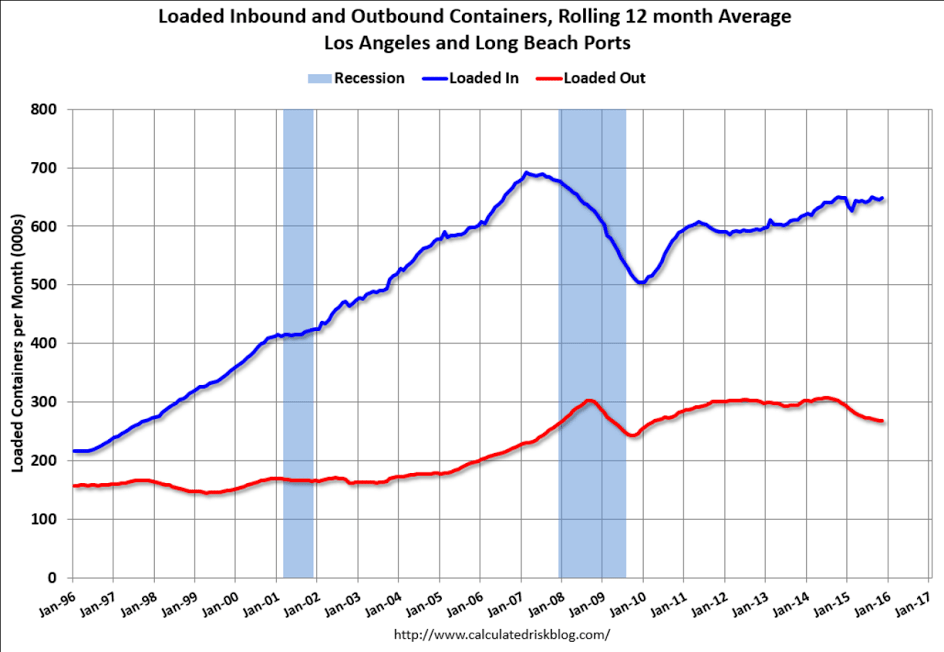
Imports up, exports down:
er-12-18-1
Seems to me there’s a substantial number of people who can ‘get by’ without a job, but would work if they could get a meaningful paycheck to allow them to, for example, remodel a room, or take a nicer vacation, etc. but won’t take a minimum wage job that doesn’t ‘move the needle’ in that respect. And they are not considered to be part of the labor force as defined, and therefore not unemployed. And this includes older people as well. However, as macro economic forces cause a certain amount of ‘desperation’ some do ‘trickle down’ to the lower paying jobs out of necessity, which accounts for quite a bit of the reported employment growth.

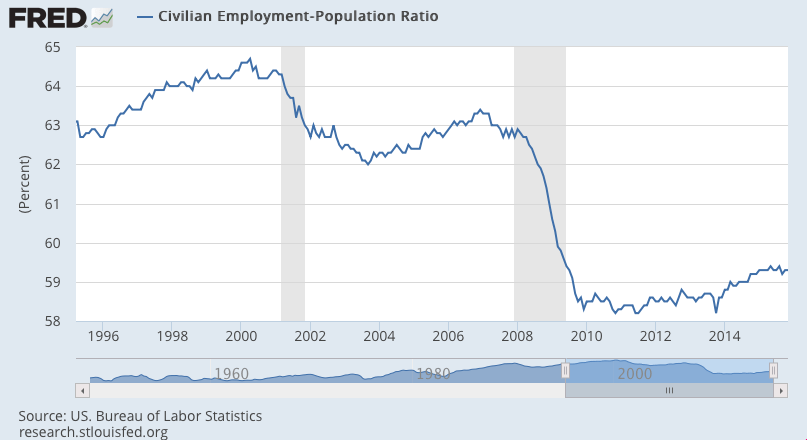
Comes back to the same thing- a whopping shortage of aggregate demand vs pre 2008 and pre 2001 levels, where people who can ‘get by’ were able to get good enough paying jobs to justify working:
er-12-18-2
er-12-18-3
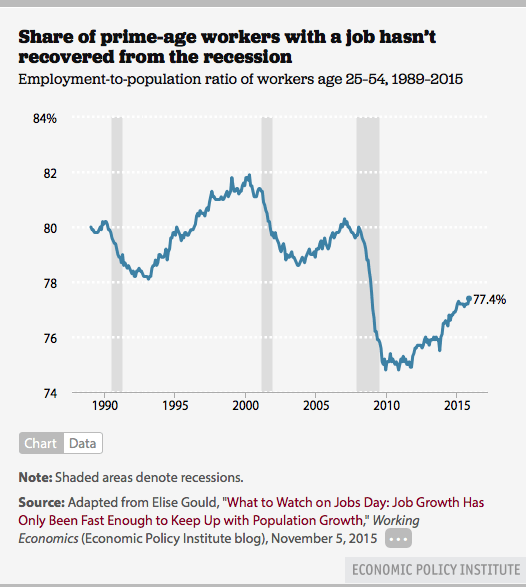
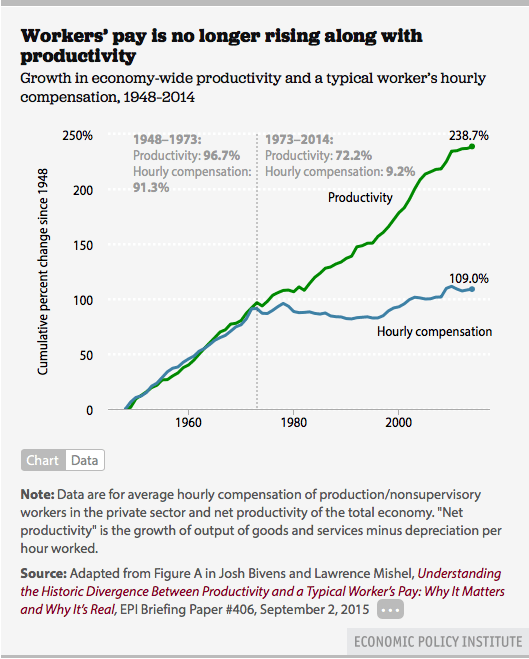
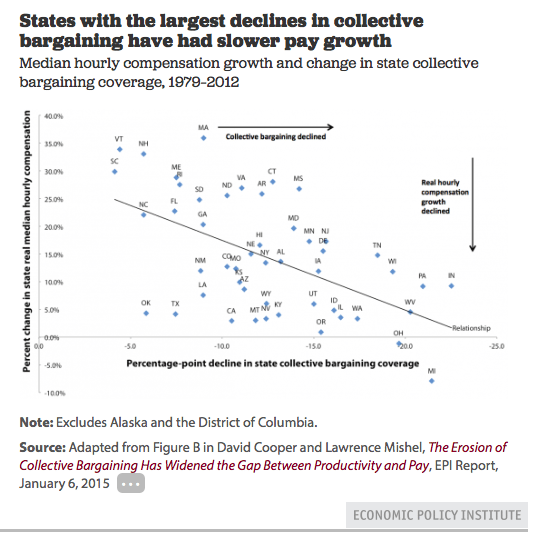
As previously discussed, mainstream game theory says the ‘labor market’ isn’t a ‘fair game’ as workers need to work to eat, and business hires only if it ‘wants to.’ The charts show what happened as support for labor was phased out:
er-12-18-4

er-12-18-5

Atlanta Fed, US current account, Philly Fed

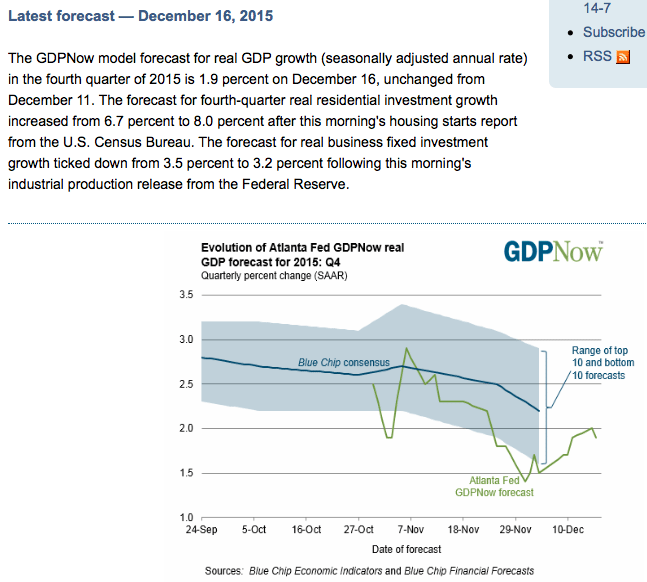
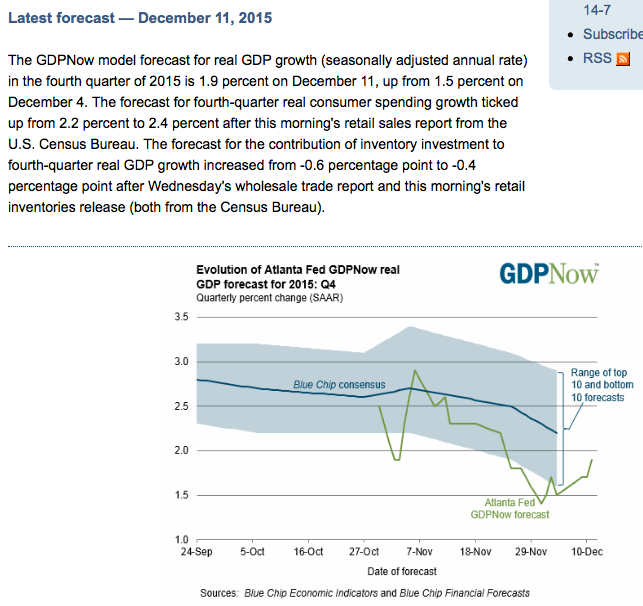
Blue chip consensus dropping quickly now, and today won’t help any:
er-12-17-5
Remember a year ago when they said the oil price drop would be an unambiguous positive for the trade balance?
;)

Anyway, this is weak dollar stuff, vs the euro area current account surplus, which is strong euro stuff:

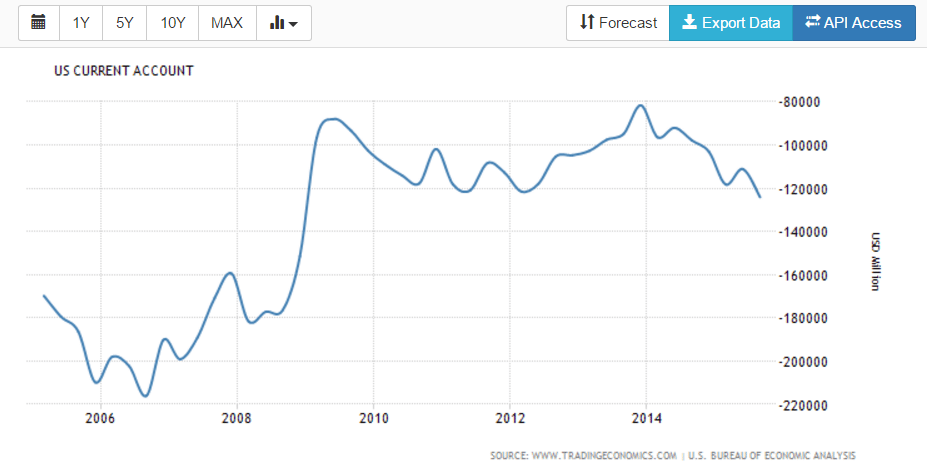
Current Account
er-12-17-1
Highlights
The nation’s current account deficit widened sharply in the third quarter, to $124.1 billion from a revised $111.1 billion in the second quarter. This is the widest gap of the recovery, since the troubles of fourth-quarter 2008. A greater deficit in goods trade, at $0.8 billion in the quarter, is the smallest factor in the widening. A narrowing in the surplus for primary income, at $6.6 billion, and a widening in the gap for secondary income, at $5.8 billion, are the main factors behind the quarter’s deficit. The gap relative to GDP rose 1 tenth in the third quarter to a still manageable 2.7 percent.

er-12-17-2
Bad. Fed rate hike already have an effect…
;)

Philadelphia Fed Business Outlook Survey
er-12-17-3
Highlights
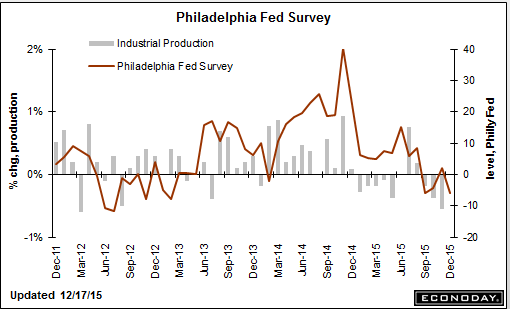
The negative headline, below Econoday’s low-end estimate, isn’t even half of story for the December Philly Fed report which is pointing to another rough month for the nation’s factory sector. The headline index came in at minus 5.9 for its third negative reading in four months. New orders have been in the negative column for the last three months, at a steep minus 9.5 in today’s report. Unfilled orders, which popped up slightly in November, are back in the minus column and deeply in the minus column at 17.7.

Manufacturers in the Philly Fed’s sample worked down their backlogs to keep up shipments which came in on the plus side at 3.7. But without new orders coming in, shipments are bound to fall. Employment, likewise, is bound to fall though it did hold in the plus column for a second month in a row at 4.1 in December. Ominously, price data are beginning to turn deeply negative, at minus 9.8 for inputs and minus 8.7 for final goods — the latter an indication of weakening demand.

Another ominous detail in the report is a breakdown in the 6-month outlook, down more than 20 points to 23.0 which is low for this reading. Expectations for future orders are especially weak. Today’s report falls in line with Tuesday’s Empire State report and are both reminders that weak global demand, together with the breakdown in the energy and commodity sectors, are pulling down the nation’s factory sector.

er-12-17-4

Architecture Billings Index, Fed comments

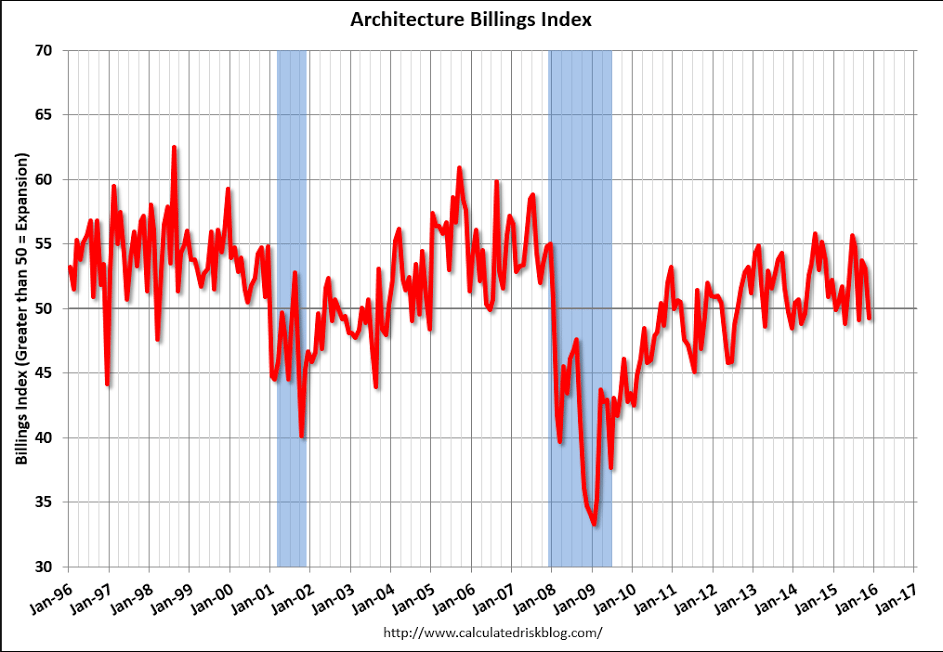
Another setback for economic forecasters as this index falls below 50, indicating contraction:
er-12-16-13
Seems to me the Fed has gotten lost in its own confused rhetoric, but that’s another story.

Point here is fed funds are a quarter point higher which will will make no discernible difference to macroeconomic outcomes, including the Fed’s employment and inflation mandates.

FED RAISES RATES BY 25 BASIS POINTS, FIRST SINCE 2006

Mtg prch apps, Housing starts, Industrial production, Euro trade

Yes, up vs last year’s dip, but remain depressed and have been
heading south since early this year:

MBA Mortgage Applications
er-12-16-12
Highlights
Application activity was little changed in the December 11 week, up 1 percent for refinancing and down 3.0 percent for home purchases. Year-on-year, purchase applications remain very high, up 34 percent in a gain that in part reflects a pulling forward of demand ahead of what is expected to be a rate hike at today’s FOMC. Rates were little changed in the week with the average 30-year fixed loan for conforming loan balances ($417,000 or less) unchanged at 4.14 percent. The rise in purchase applications points to strength for today’s housing starts and permits data.

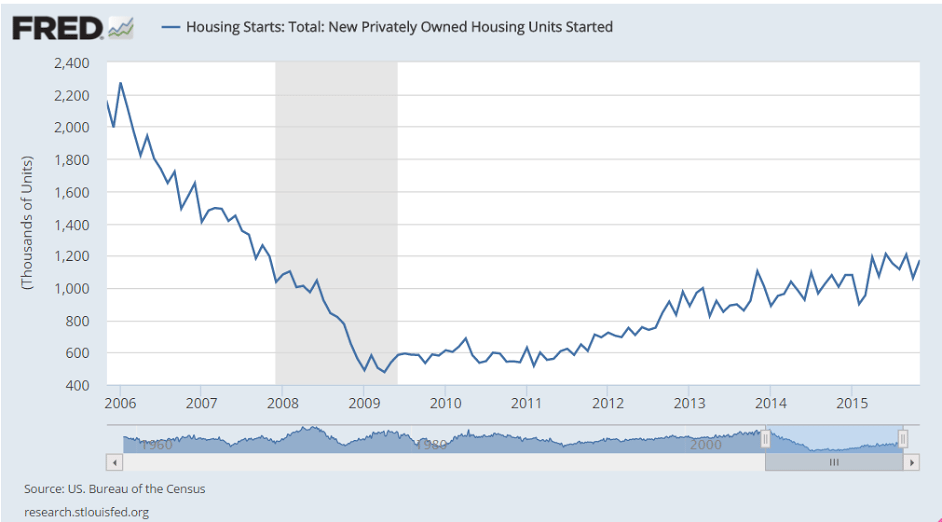
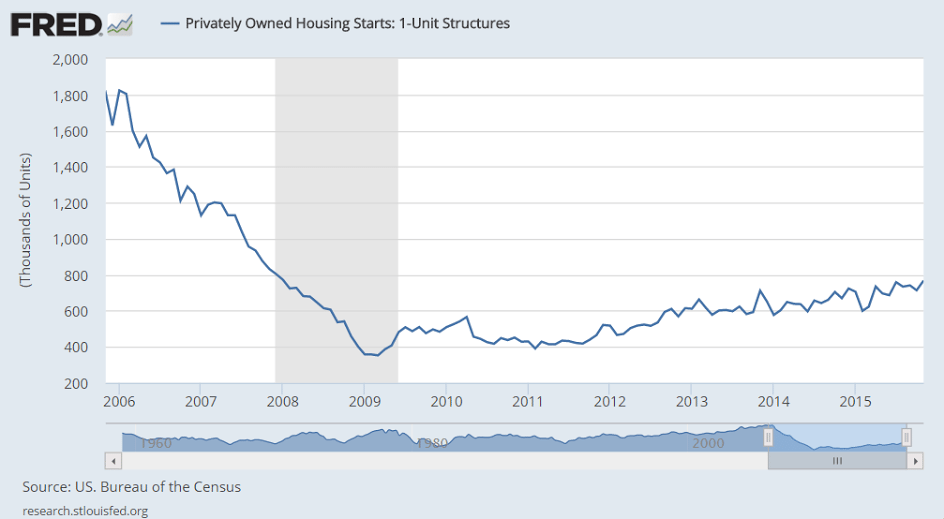
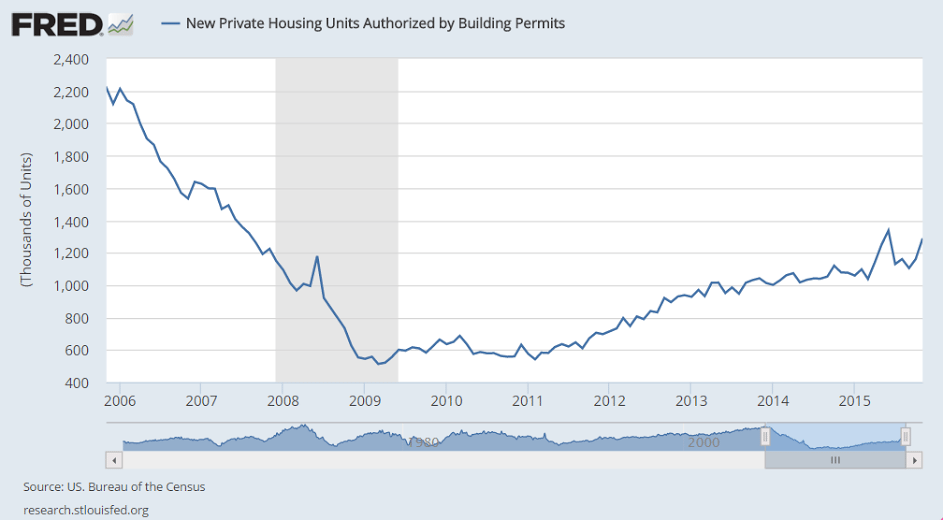
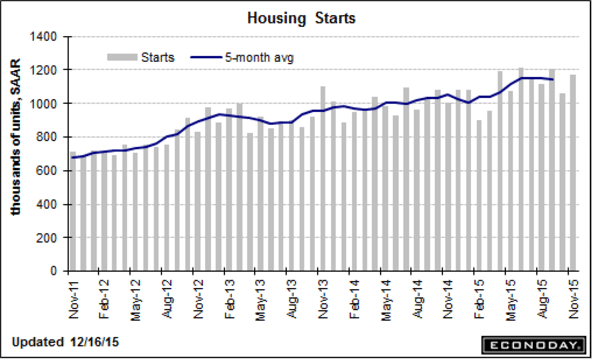
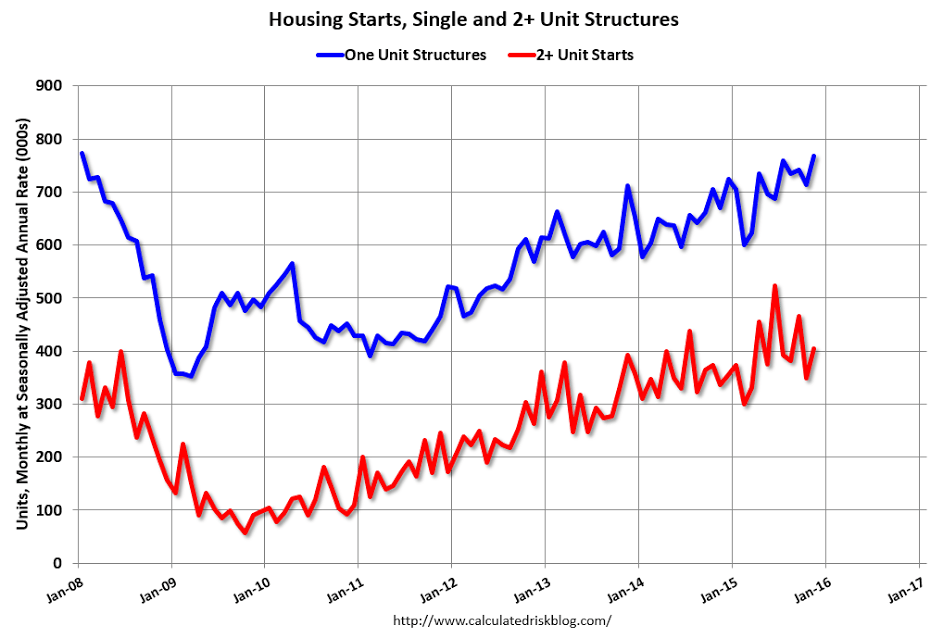
Up, which may give the Fed an excuse to hike rates, but remains severely depressed and gains again are in lower cost multifamily units, and even then the chart shows it’s all only been going sideways since February, with multifamily starts decelerating since the NY tax break expired in June:

Housing Starts
er-12-16-11

Highlights
Housing permits surged in November, up 11.0 percent to a far higher-than-expected annualized rate of 1.289 million and reflecting a 27 percent monthly jump for multi-family units though permits for single-family homes also increased, up 1.1 percent. Starts were also very strong, up 10.5 percent to a 1.173 million rate with multi-family homes again leading the way, up 16.4 percent with single-family homes up 7.6 percent.

Year-on-year rates are robust, up 19.5 percent for permits (single-family up 9.0 percent, multi-family up 36 percent) and up 16.5 percent for starts (single-family up 14.6 percent, multi-family up 20 percent).

Homes under construction offer more good news, up a monthly 2.2 percent to a recovery best rate of 965,000 and up a very strong 18.3 percent year-on-year. Housing completions fell back for a second month in November, down 3.2 percent to a 947,000 to indicate that there’s still plenty of building underway. Year-on-year, completions are up 9.2 percent.

Strength for starts is certainly getting a boost from this winter’s mild weather while the gain in permits points in part to speculative demand, especially for multi-family units. Housing readings have been inconsistent but this report is very constructive for the new home and construction outlooks.
er-12-16-10

er-12-16-9

er-12-16-8

er-12-16-7

er-12-16-6

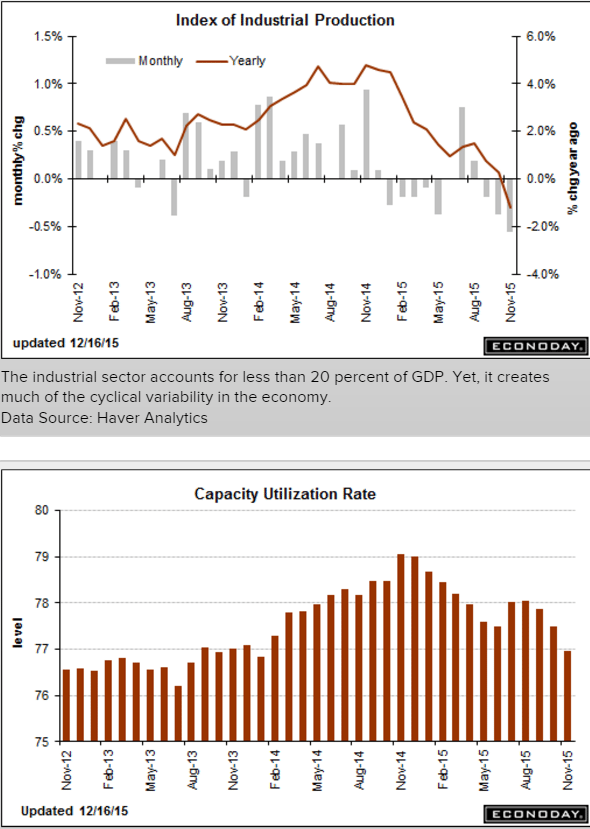
Yet another abysmal report from the industrial sector, which continues the tumble that began when oil capex collapsed about a year ago, and has yet to be ‘replaced’ by some other sector. And lost sales and output also means that much lost income in a downward spiral that can only be reversed by some sector ‘dipping into savings’ to spend that much more. And declining capacity utilization is one measure of slack for the Fed to consider:

Industrial Production
er-12-16-5
Highlights
November was another weak month for the industrial economy, in part reflecting unusually warm temperatures that are driving down utility output. Industrial production came in at the Econoday low forecast, down a very sharp 0.6 percent in November. This is the biggest drop in 3-1/2 years. Utility output fell a monthly 4.3 percent after falling 2.8 percent in October. Mining, reflecting low commodity prices and contraction in energy extraction, has also been week, down 1.1 percent for a third straight decline.

This brings us to the most important component, manufacturing where October’s 0.3 percent bounce higher (revised downward from 0.4 percent) now unfortunately looks like an outlier. Manufacturing production came in unchanged in November reflecting weakness in motor vehicles, down 1.0 percent in the month, and also a dip back for construction supplies which fell 0.2 percent after a weather-related surge of 2.3 percent in October. One positive is a slight snapback for business equipment which, after declines in the two prior months, rose 0.2 percent.

All the weakness is pulling down capacity utilization, to 77.0 percent in November for a heavy 5 tenths dip. Utilization is running more than 3 percentage points below its long-term average. Mining utilization is now under 80 percent, down 1.1 points in the month to 79.4 percent. Utility utilization fell 3.4 points in the month to 74.5 percent with manufacturing utilization down 1 tenth to 76.2 percent. Excess capacity, though not cited as a major factor behind the lack of inflation in the economy, does hold down the cost of goods.

Year-on-year rates confirm the weakness, down 1.2 percent overall with utilities down 7.6 percent and mining down 8.2 percent. Manufacturing is in the plus column but not by much at plus 0.9 percent.

Weather factors are skewing utility output but otherwise, readings are fundamentally soft and reflect the downturn in global demand made more severe for U.S. producers by strength in the dollar.
er-12-16-4
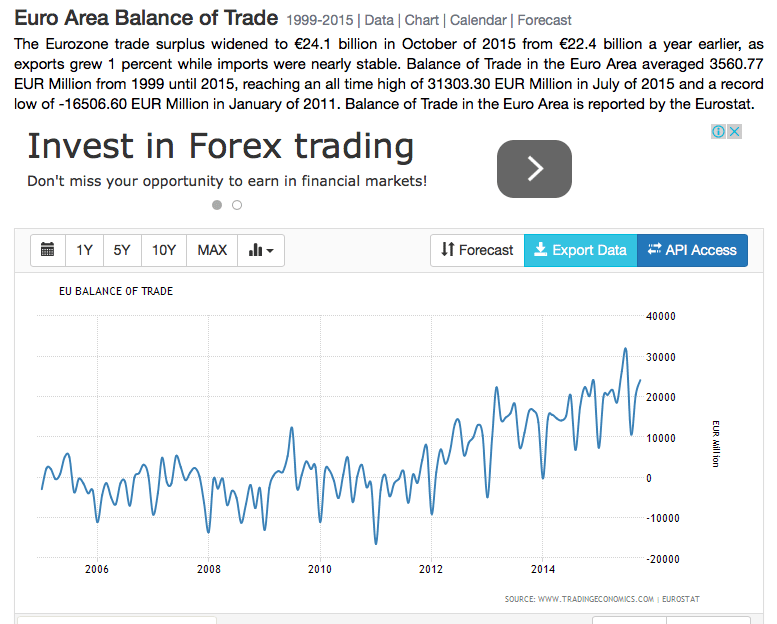
Euro area surplus high and continues to trend higher.

This is super strong currency stuff:
er-12-16-3
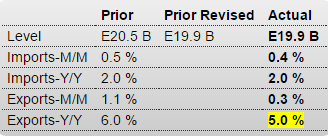
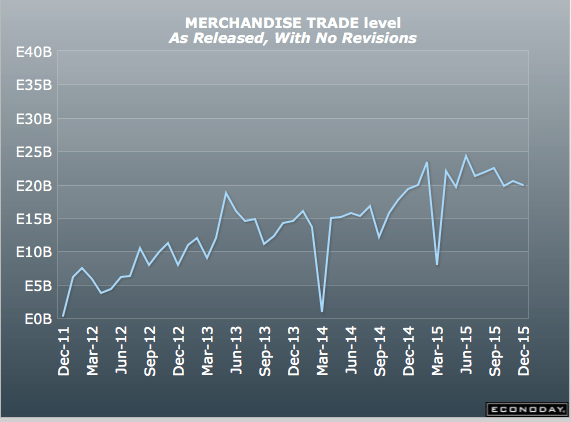
Different aggregate than the above, same message. And note exports growing with a weak global economy:

European Union : Merchandise Trade
er-12-16-2
Highlights
The seasonally adjusted trade balance returned a E19.9 billion surplus in October, matching the downwardly revised outturn in September.

The stability of the headline reflected a 0.3 percent monthly increase in exports and a 0.4 percent gain in imports. Exports stood at their highest level since July and were 5.0 percent above their year-ago level. Imports also recorded a 3-month peak and now show a yearly increase of 2.0 percent.

The October black ink was 3.1 percent below the average level in the third quarter when net exports subtracted 0.2 percentage points from quarterly GDP growth. Lower oil prices are helping to bias down nominal imports but the weakness of the euro should help to ensure a stronger performance from the real external trade sector moving through 2016.
er-12-16-1

CPI, Empire survey, Redbook retail sales, Housing index

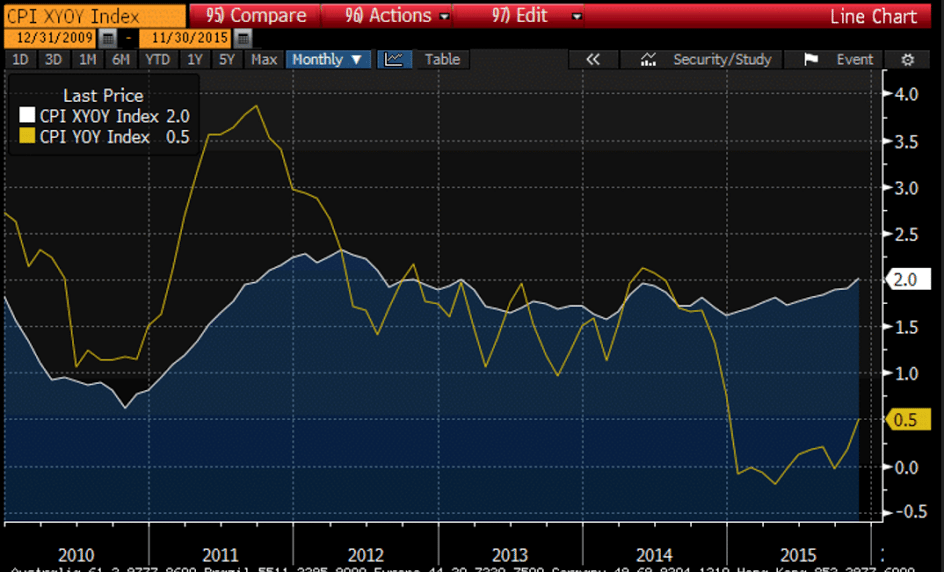
One of the Fed’s mandates. The ‘headline’ number is below target due to the energy impulse, but the ‘core’ rate, led by services, is on target. The question is whether energy prices, if they remain at current levels, will ‘pull down’ other prices. And the comparisons with last year are now vs the lower numbers that were released after the oil price collapse.
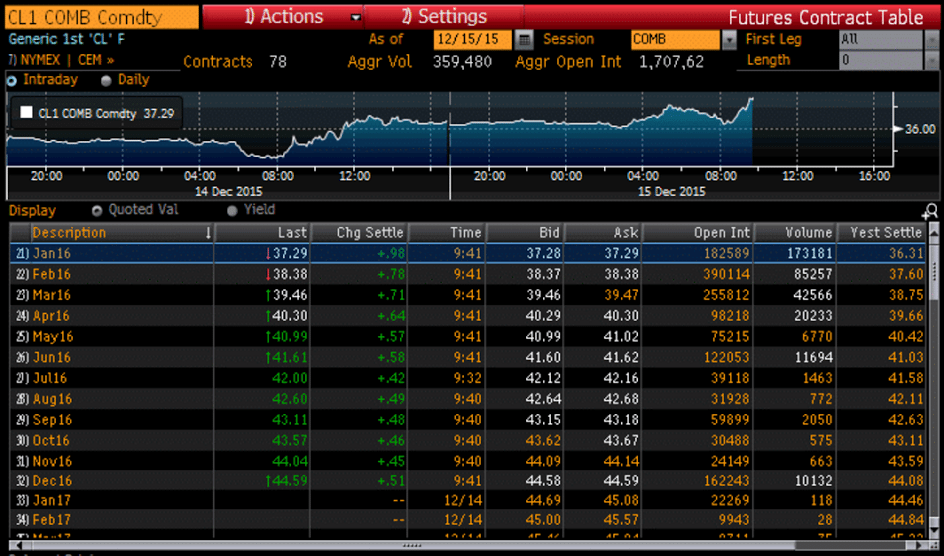
And not to forget that the Fed uses futures prices as indications of future spot prices, even for non perishables, which technically only represent ‘storage prices’.

So with oil futures prices substantially higher than spot (due to elevated storage costs which have been supported by Iran storing oil in anticipation of being able to sell it next year) the Fed’s forecasts will use those elevated prices to forecast that much more inflation.

United States : Consumer Price Index
er-12-15-1
Highlights
Consumer price inflation is very low though the deflationary thrust may be clearing. The CPI came in as expected with no change in November with the core rate, which excludes food and energy, also coming in at expectations with a moderate 0.2 percent gain.

Many components show declines in the month including transportation, apparel (where low import prices are still at play), and recreation. Food prices also fell in the month, which is the first drop since March, while energy prices really fell, down 1.3 percent in November reflecting a 2.4 percent decline for gasoline in a dip that continues to extend through December as well. But there are areas showing pressure including medical care for a second month in a row. Housing is also up but only at a moderate 0.2 percent with owner’s equivalent rent also up 0.2 percent.

Year-on-year prices are showing lift but reflect easy comparisons with price weakness this time last year. The overall rate is up 0.5 percent, 3 tenths higher in the month, with the core rate up 1 tenth to 2.0 percent which hits the Fed’s target.

This report is in line with the Fed’s outlook, showing an easing, at least to a degree, in deflationary pressures. But still falling fuel prices are definitely a live risk to the Fed’s inflation hopes.

Core vs. headline CPI:
er-12-15-2
The Fed uses the prices in green when forecasting inflation:
er-12-15-3
More bad stuff here. Employment is the Fed’s other mandate:

Empire State Mfg Survey
er-12-15-4
Highlights
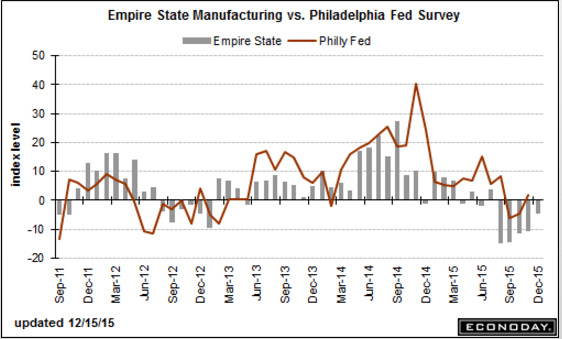
Factory activity continues to contract in the New York manufacturing region and especially, unfortunately, employment and the workweek. The Empire State index posted its fifth negative reading in a row, minus 4.59 for December which however is the least weak reading of the run. New orders, at minus 5.07, are down for a seventh month in a row but here to the degree of contraction is easing. Not easing, however, is employment which is deeply negative at minus 16.16 for the fourth contraction in a row and the deepest since July 2009. The workweek is another disappointment, at minus 27.27 for the worst reading since even further back, to April 2009.

But there are pluses in this report led by a big gain for the six-month outlook, to 38.51 from 20.33. The gain reflects greater optimism for new orders and shipments but no greater optimism for employment where hiring is expected to be no more than moderate.

Turning back to negatives, prices received are down for a fourth month in a row, at minus 4.04. Contraction in prices for finished goods points to price concessions and lack of demand.

The recovery worst readings for employment and the workweek are definitely worrisome signs. Yes, this report has been running lower than other regional manufacturing reports but today’s results do not point to any year-end lift for the factory sector which is being hit by low exports and low prices.

er-12-15-5
Down again, not good:
er-12-15-6
And housing indicators continue to slow, contrary to all forecasts:

Housing Market Index
er-12-15-7

Retail sales, Business inventories, Consumer Sentiment

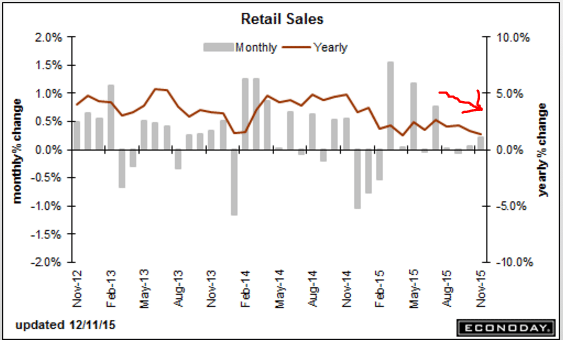
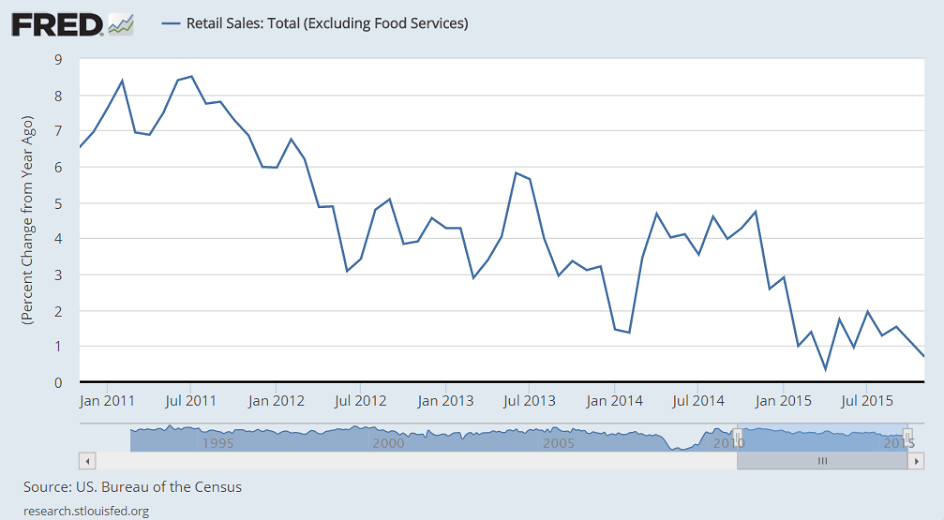
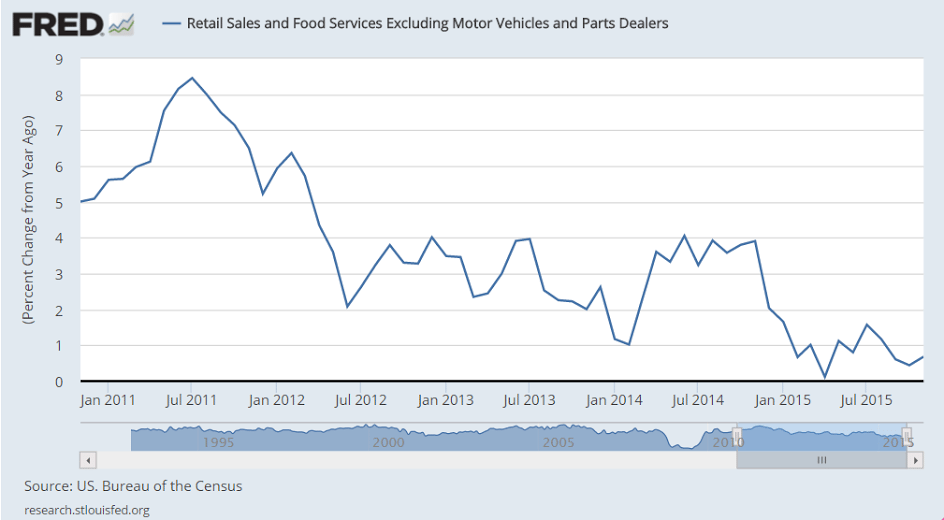
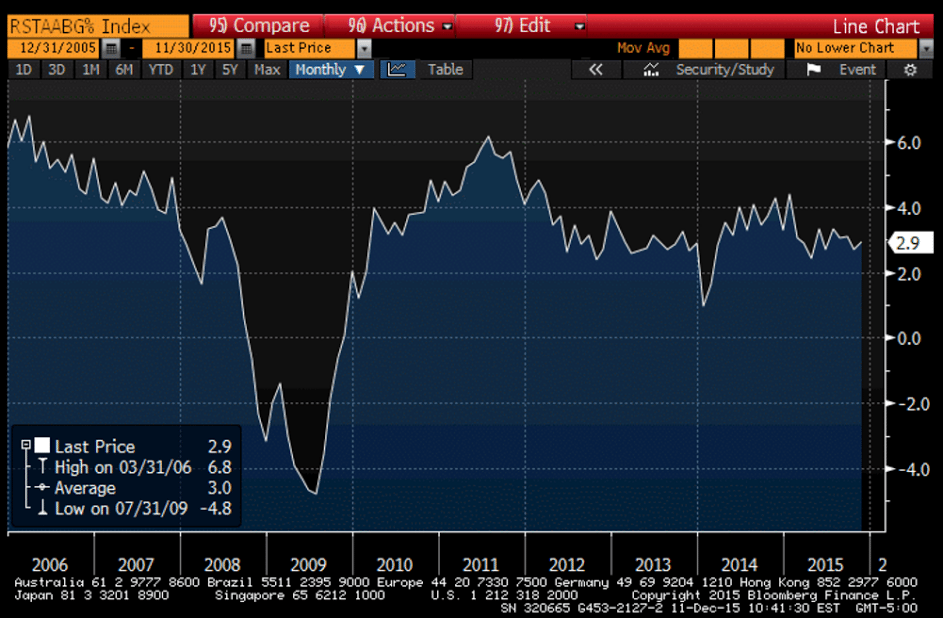
Retail sales = retail (gross) income and growth is still way down year over year, as per the charts.

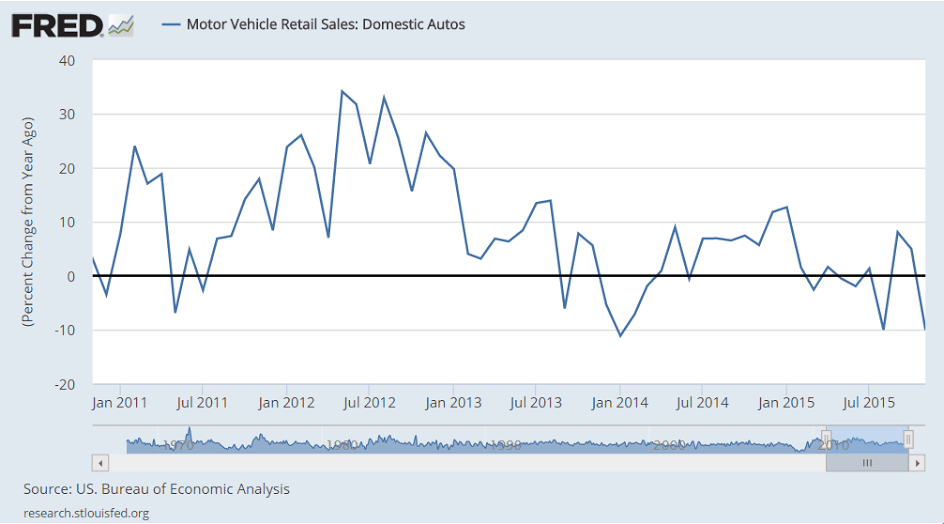
Also declining vehicle sales are highly problematic, as they were what was keeping a bad story from being that much worse. And not to forget when looking at year over year change oil and gas prices were already down quite a bit by this time last year:

Retail Sales
er-12-11-1
Highlights
Once again the headline for the retail sales report understates underlying strength. Total retail sales rose only 0.2 percent in November which is just under the Econoday consensus. But weakness here came from vehicles of all places which otherwise have been one of this year’s standout component for this report. Excluding vehicles, sales rose 0.4 percent which is 1 tenth above expectations. Excluding both vehicles and gasoline, core sales rose a very solid 0.5 percent which is 2 tenths above expectations. A key discretionary category, restaurants, shows yet another very strong gain, this at 0.7 percent in the month. Also showing sizable gains are electronics & appliances, clothing & accessories, non-store retailers (once again), and the general merchandise category where, despite a deflationary pull from falling import prices, sales jumped 0.7 percent in the month.

Vehicle sales fell 0.4 percent in the month on top of October’s 0.3 percent decline. These declines are a bit of a surprise given steady readings in unit sales of vehicles which have been holding firmly at 12-year highs. Whether there’s a rebound ahead for vehicle sales, which had been so strong through the year, will be key to consumer spending going into the new year. Sales at gasoline stations continue to contract, at minus 0.8 percent in the month. Furniture sales, which have been strong, fell back as did sales of building materials & garden supplies, which have been soft.

Year-on-year rates show nonstore retailers out in front, at plus 7.3 percent to confirm acceleration for online sales. Restaurants are right behind at plus 6.5 percent year-on-year followed by furniture and by sporting goods, both at plus 5.4 percent. All together, core retail sales are up a moderate 3.6 percent year-on-year held down by contraction in electronics & appliances and soft readings for grocery stores and general merchandise. Outside the core, motor vehicles are still in the thick of things, at plus 4.0 percent year-on-year, with gasoline stations down 19.9 percent. Total retail sales are up only 1.4 percent but the gain goes up to 3.6 percent (the same as the core) when excluding just gas.

Taken together, rates of growth are no more than moderate but certain areas are posting eye-catching results, results that point to what must have been a successful Black Friday sales push. The consumer, boosted by a solid labor market and having more money to spend because of low gas prices, is definitely alive and spending going into the final weeks of the holiday season. In a methodology note, the November data reflect a new sample and prior levels have been revised (mostly lower).

er-12-11-2
er-12-11-3
er-12-11-4
This one’s call the ‘control group’ (excludes auto dealers, gas stations, food services, building materials) and sure doesn’t look to me like it’s part of a rate hike story:
er-12-11-5
These came out Dec 3:
er-12-11-6
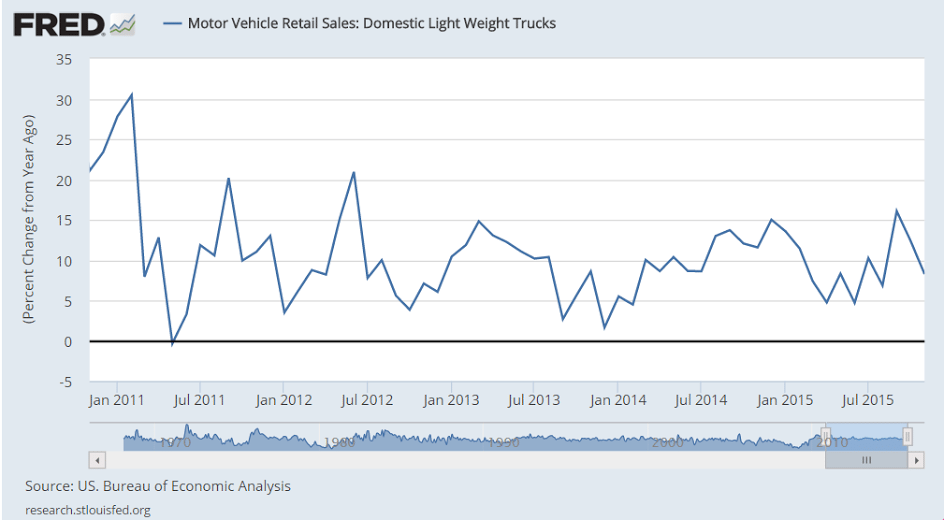
Trucks doing better:
er-12-11-7
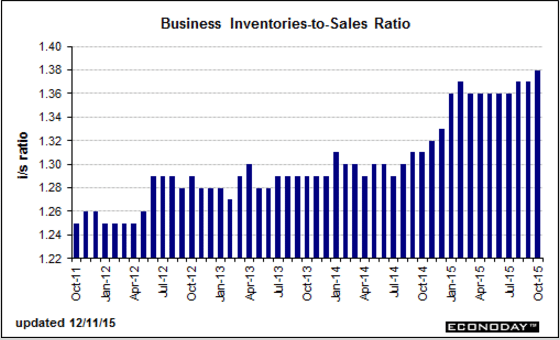
Inventory building stops but slow sales hike the inventory/sales ratio:

Business Inventories
er-12-11-8
Highlights
Businesses appear to be putting the brakes on inventories which however are still rising a bit relative to sales. Business inventories were unchanged in October with September revised down 2 tenths to plus 0.3 percent in readings that will pull down the GDP outlook slightly. Sales came in unchanged which is just enough to drive up the stock-to-sales ratio to 1.38 from 1.37. This time last year, this reading was at 1.31.

All three components show only the most minimal change in inventories, up 0.1 percent for retailers and down 0.1 percent for both manufacturers and for wholesalers. And sales tell the story, unchanged in October for both retailers and wholesalers and down 5 tenths for manufacturers.

The lack of punch in the economy, the result of weak foreign demand, continues to put upward pressure on inventories. But businesses are successfully keeping their stocks as low as possible, thereby limiting future corrections in production and employment.
er-12-11-9
er-12-11-10

Saudi oil pricing, import and export prices, Japan Manufactures’ sentiment

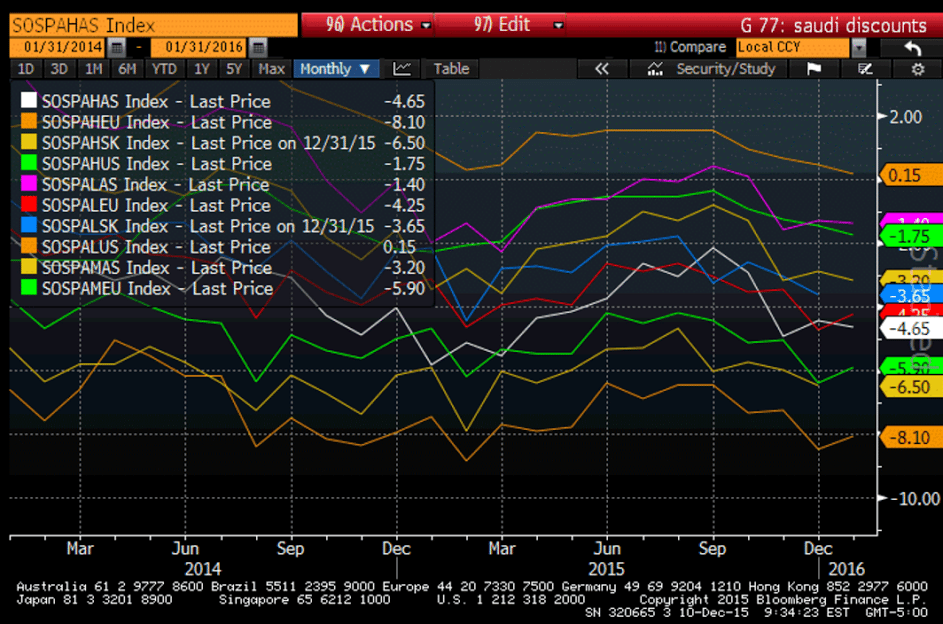
Not a lot of change for January, most ‘discounts’ still at or near the wides, so price action likely to be more of same:
er-12-10-1
Something the Fed takes into consideration:

Import and Export Prices
er-12-10-12
Highlights
Cross-border price pressures remain negative with import prices down 0.4 percent in November and export prices down 0.6 percent. Petroleum fell 2.5 percent in the month but is not an isolated factor pulling prices down as non-petroleum import prices fell 0.3 percent in the month. Agricultural exports are the wildcard on the export side and they fell a sizable 1.1 percent but here too, the deflationary pull is widespread with non-agricultural export prices down 0.6 percent.

Year-on-year contraction is perhaps less severe than prior months but not by much. Import prices are down a year-on-year 9.4 percent with non-petroleum import prices at minus 3.4 percent. Import prices from Canada are down the heaviest, at minus 18.0 percent on the year, with Latin America next at minus 12.7 percent. Showing the least price weakness are imports from China at minus 1.5 percent. Export prices are down 6.3 percent on the year with non-agricultural prices down 5.7 percent.

Of special concern are continuing incremental decreases for prices of finished goods, both imports and exports. Federal Reserve policy makers have been waiting for an easing drag from low import prices, not to mention oil prices as well, with neither yet to appear. Contraction in import prices not only reflects low commodity prices but also the strength of the dollar which has been giving U.S. buyers more for their dollars.

Japan big manufacturers’ mood worsens in Q4

Dec 10 (Reuters) — Big Japanese manufacturers’ sentiment worsened in October-December, a government survey showed. The business survey index (BSI) of sentiment at large manufacturers stood at plus 3.8 in October-December, compared with plus 11.0 in July-September, according to the joint survey by the Ministry of Finance and the Economic and Social Research Institute, an arm of the Cabinet Office, released on Thursday. The BSI measures the percentage of firms that expect the business environment to improve from the previous quarter minus the percentage that expect it to worsen.

Retail hiring, Alaska

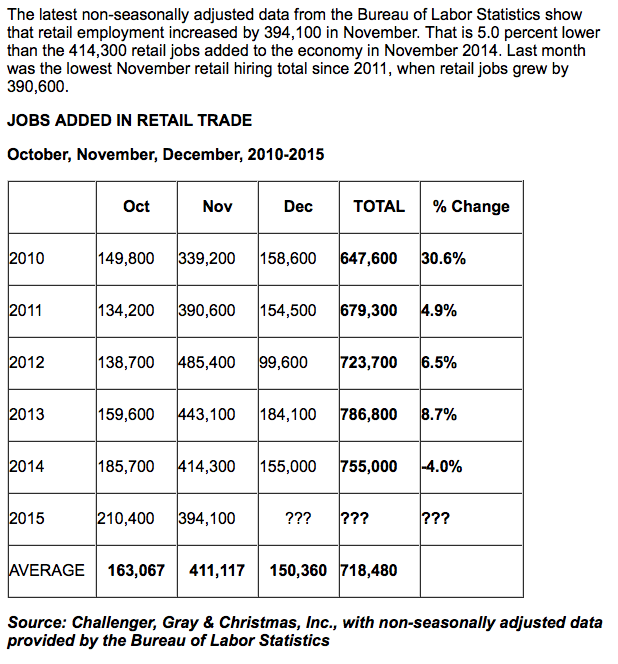
November Retail Hiring Falls To 4-Year Low – 5% Fewer Than One Year Ago

er-12-9-5
As it says, Alaska is not alone, as spending cuts and tax increases due to the oil price collapse continue into next year:

Alaska governor proposes first income tax in 35 years

Dec 9 (AP) — Alaska Gov. Bill Walker is proposing instituting a personal income tax for the first time in 35 years as the oil-dependent state looks to plug a multibillion-dollar budget deficit amid chronically low prices.

In laying out his budget plan Wednesday, Walker also proposed using the fund that provides annual checks to most Alaskans to generate a stream of cash to help finance state government. The plan would change how dividends are calculated and mean lower checks, at least initially — with 2016 payouts about $1,000 less than this year’s.

Alaska isn’t alone among oil-producing states to experience hard times as oil prices stay low. But unlike states like Texas or Louisiana, Alaska has few other industries to make up the difference.

Walker’s proposal also includes:
—Adding a dime to every drink of alcohol and $1 per pack of cigarettes.

—Additional budget cuts.

—Changes to the oil tax credit system, a big budget item.

—Increases to industry taxes including mining, fishing and oil.