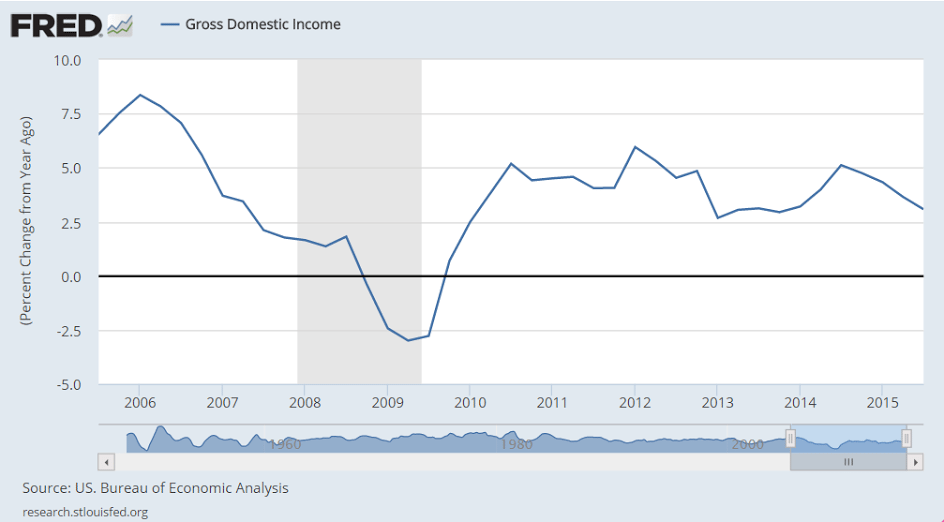
Sales = gross income, and profits are net income:
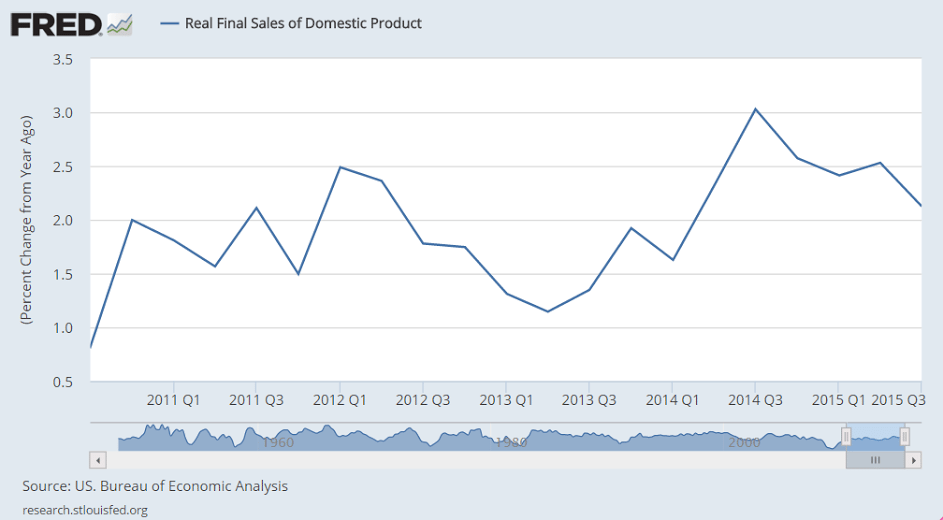
Still down:
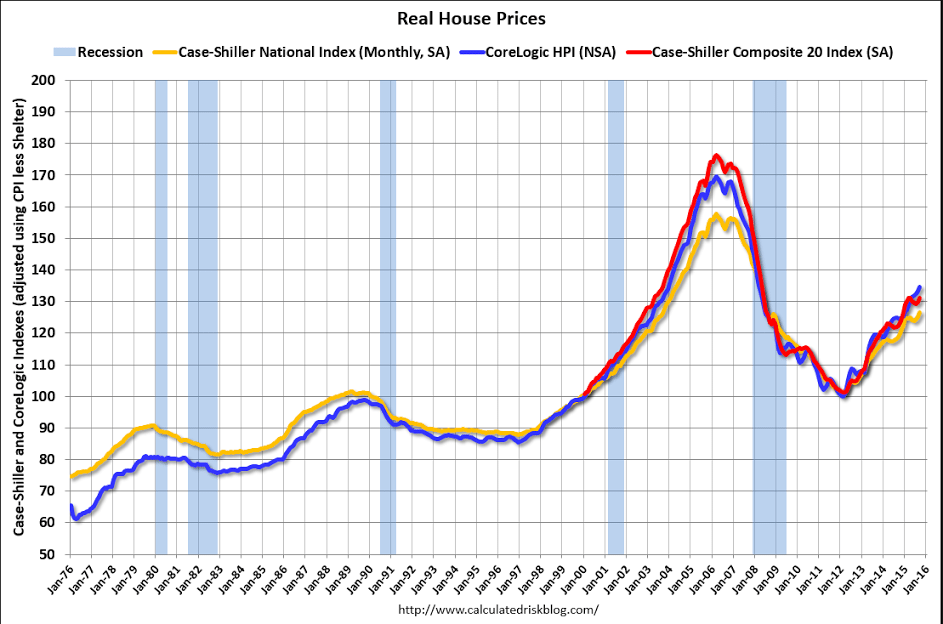
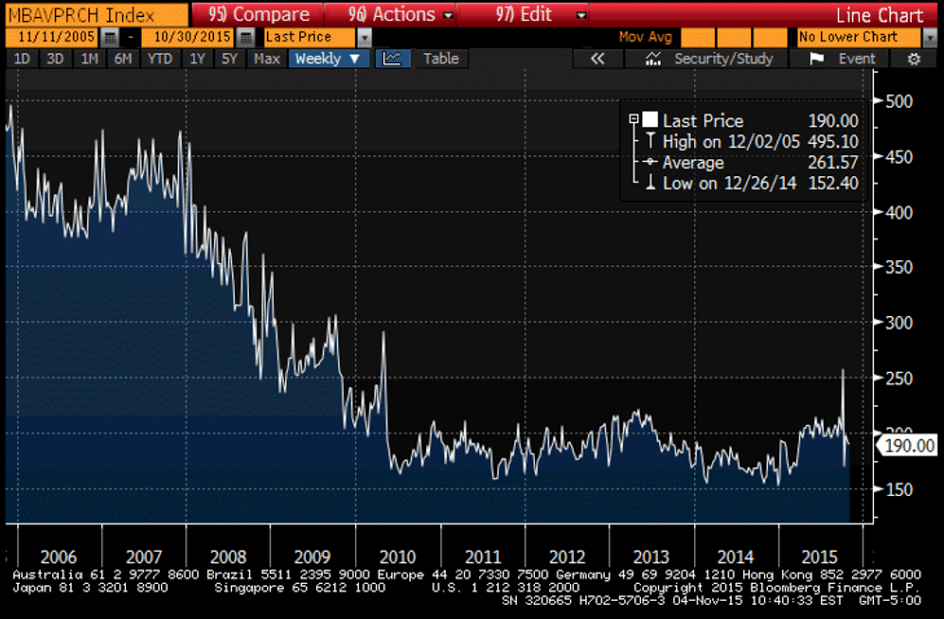
Adjusted for inflation housing prices are about where they were 10 years ago:

Sales = gross income, and profits are net income:
Still down:
Adjusted for inflation housing prices are about where they were 10 years ago:
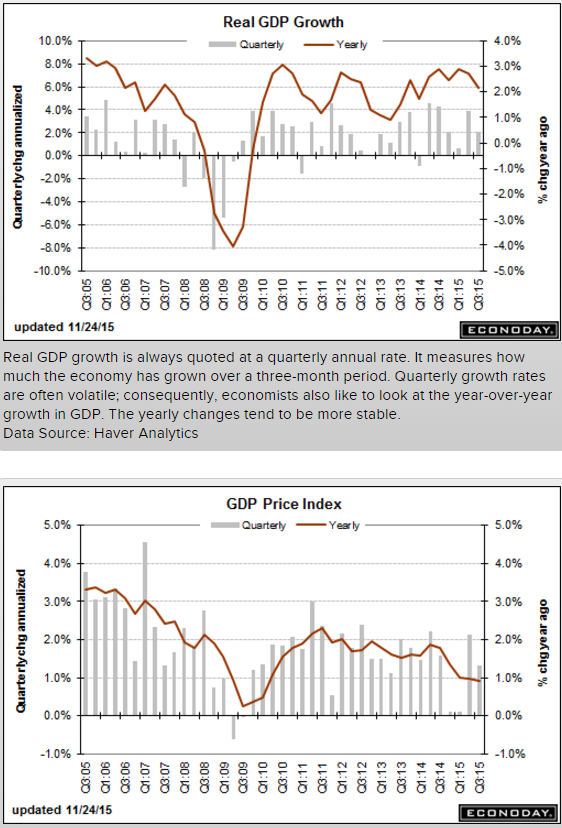
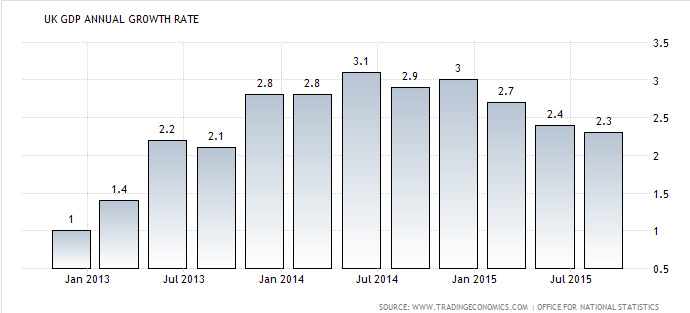
Output was revised up, but mainly due to growing unsold inventory, with other spending revised lower and showing more deceleration than the first release:
GDP
Highlights
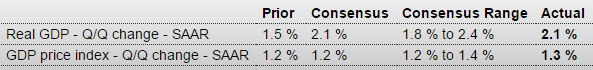
Third-quarter GDP is revised to an annualized plus 2.1 percent, up 6 tenths from the initial estimate but showing less strength by the consumer with final sales now at plus 2.7 from plus 3.0 percent. Higher inventories are a big factor in the upward revision, subtracting 6 tenths from GDP vs an initial 1.4 percent subtraction.
Net exports pulled GDP down by 2 tenths vs only a small negative effect in the first estimate. Exports rose only 0.9 percent in the quarter, down 1 percentage point from the initial reading. Readings on residential investment, adding 2 tenths to GDP, and nonresidential fixed investment, adding 3 tenths, are little changed.
Turning back to the consumer, personal consumption expenditures are revised to plus 3.0 percent, down 2 tenths from the initial estimate and reflecting less strength for durable goods and also services on lower spending for communications and natural gas.
The gain in inventories is not a positive for the fourth quarter, posing headwinds for businesses which may limit production and employment to pull down their inventories. Still, the readings on the consumer are a positive and a reminder that the nation’s economy is being driven by domestic demand. Other details include a tame plus 1.3 percent rise in the GDP price index, up 1 tenth from the initial reading.
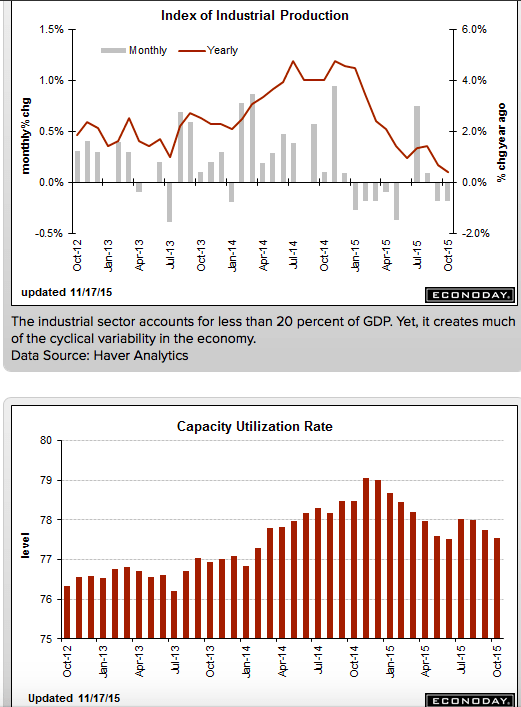
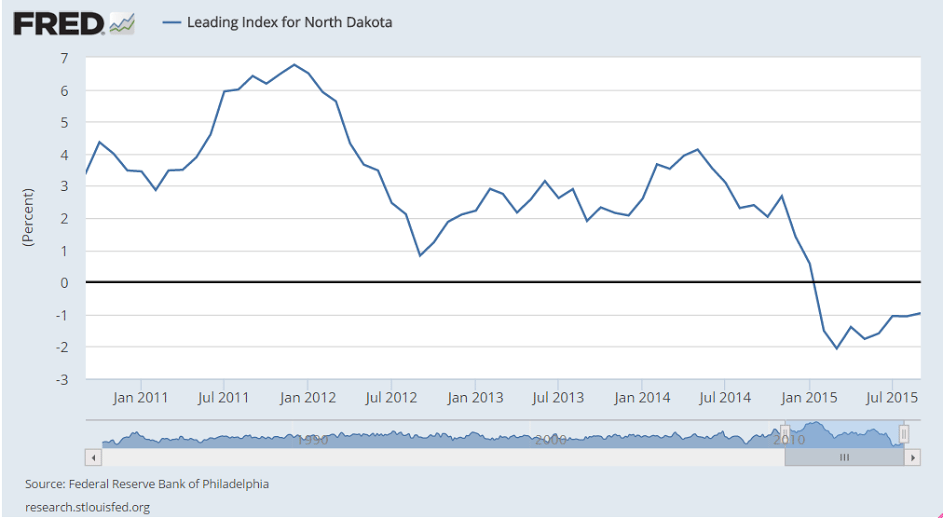
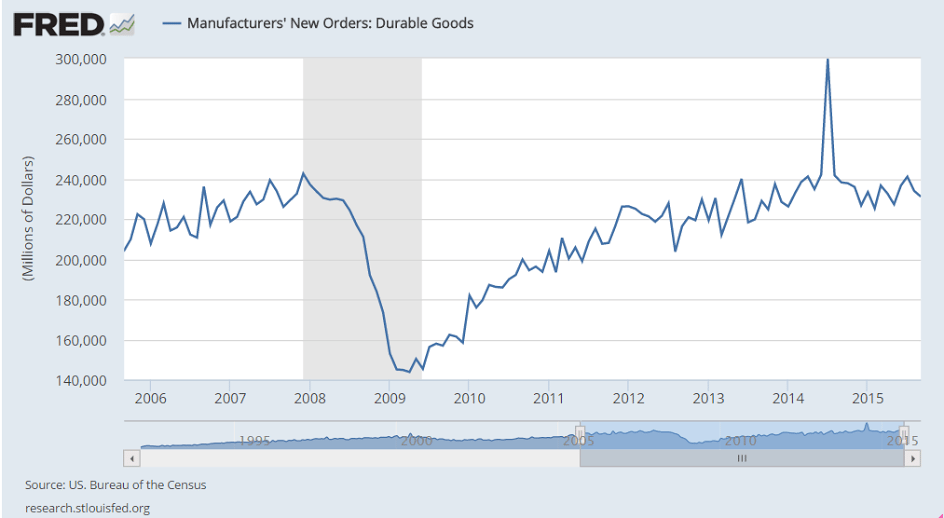
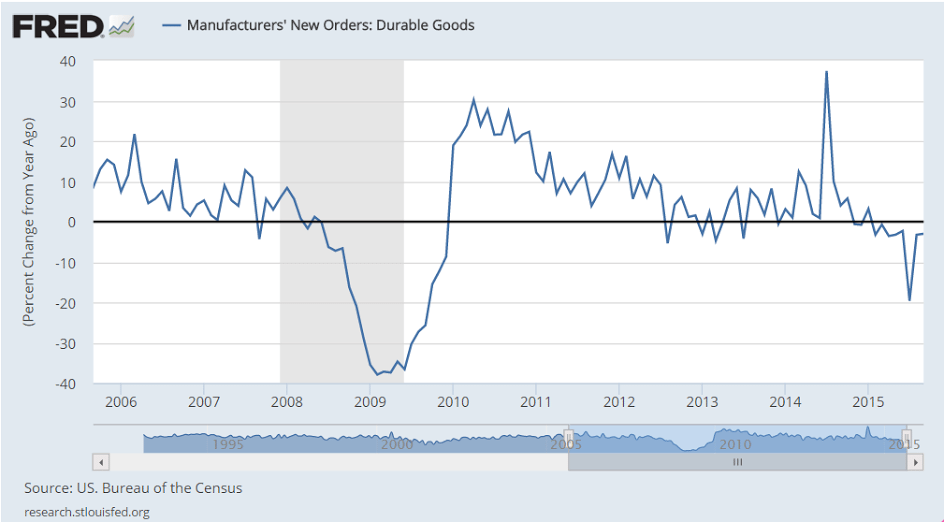
Note the decelration over the last year as oil prices and capital expenditure collapsed:
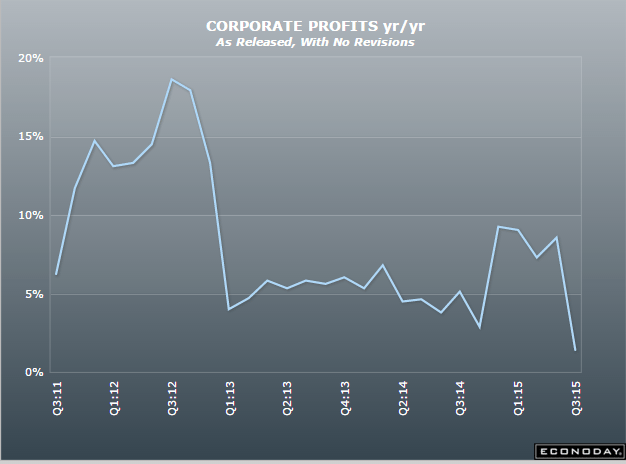
Collapsing?
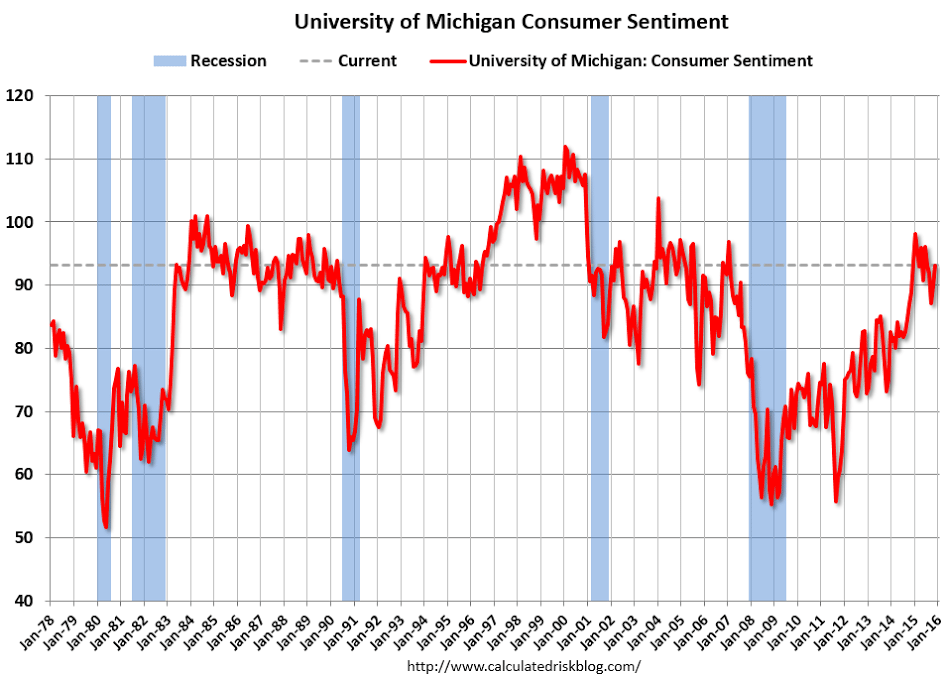
Consumer Confidence
Highlights
Lack of confidence in the outlook for the jobs market sank the consumer confidence index in November, which fell to 90.4 vs a revised 99.1 in October. The November reading is far under expectations and is the lowest since September last year. Expectations, one of two main components in this report, fell more than 10 points to 78.6 which is the lowest reading since February last year. The employment subcomponent here shows fewer consumers seeing jobs opening up six months from now and more seeing fewer jobs ahead.
The present situation component shows less weakness, down 6.5 points to 108.1 which is the lowest reading since only July. Here the employment subcomponent also shows weakness but nothing dramatic, with 26.2 percent saying jobs are hard to get which is up from October’s 24.6 percent but still respectable. But those describing jobs as currently plentiful showed more noticeable deterioration, at 19.9 percent vs October’s 22.7 percent.
A plus in the report is a jump in buying plans for autos, at 12.4 percent vs October’s 9.8 percent in a reading that hints at renewed acceleration for the motor vehicle component of the government’s retail sales report. A negative is a dip in home buying plans, to 5.6 percent from 6.2 percent. Other readings include a 1 tenth dip in inflation expectations to 5.0 percent which, for this particular reading, is actually subdued but nothing dramatic.
But the decline in job expectations is dramatic and raises the question whether global effects, which have been negative for the U.S., are beginning to weigh on the American consumer — which would not be a positive for the holiday spending outlook.
Corporate Profits
Highlights
Corporate profits in the third quarter came in at a revised $1.786 trillion, up a year-on-year 1.4 percent. Profits are after tax without inventory valuation or capital consumption adjustments.
Richmond Fed Manufacturing Index
Highlights
Early indications for the November factory sector are soft right now after Richmond Fed reports a much lower-than-expected minus 3 headline for its manufacturing index. Order data are very negative with new orders at minus 6, down from zero in October, and backlog orders at minus 16 for a 9-point deterioration. Shipments are also in contraction, at minus 2, with the workweek at minus 3. Employment, at zero, shows no monthly change but the declines for backlog orders and the workweek don’t point to new demand for workers. Price data are subdued but do show some constructive upward pressure.
This report along with Empire State, as well as yesterday’s manufacturing PMI, are pointing to a downbeat month for the factory sector which is being held down by weak foreign demand, as evidenced in the decline for goods exports in this morning’s advance release of international trade data.
International trade in goods
Highlights
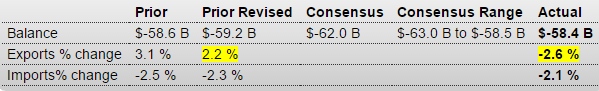
The nation’s trade gap in goods came in at a lower-than-expected deficit of $58.4 billion in October vs $59.2 billion in September. Though the month-to-month comparison points to improvement for the trade deficit, the details are not positive with exports down 2.6 percent and imports, in a sign perhaps of softening domestic demand, down 2.1 percent and following weakness also in September. Weak categories for imports include foods/feeds/beverages, industrial supplies and also capital goods as well as consumer goods with the latter hinting at weak business expectations for the holidays. Export categories showing weakness include foods/feeds/beverages and also industrial supplies.
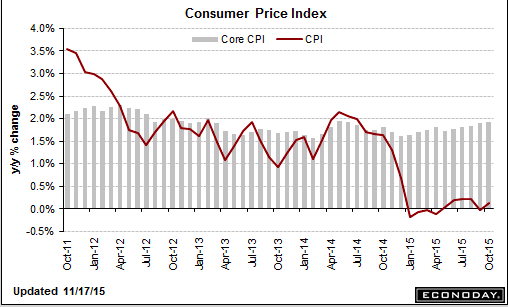
Part of the Fed’s mandate is to hit it’s 2% inflation target:
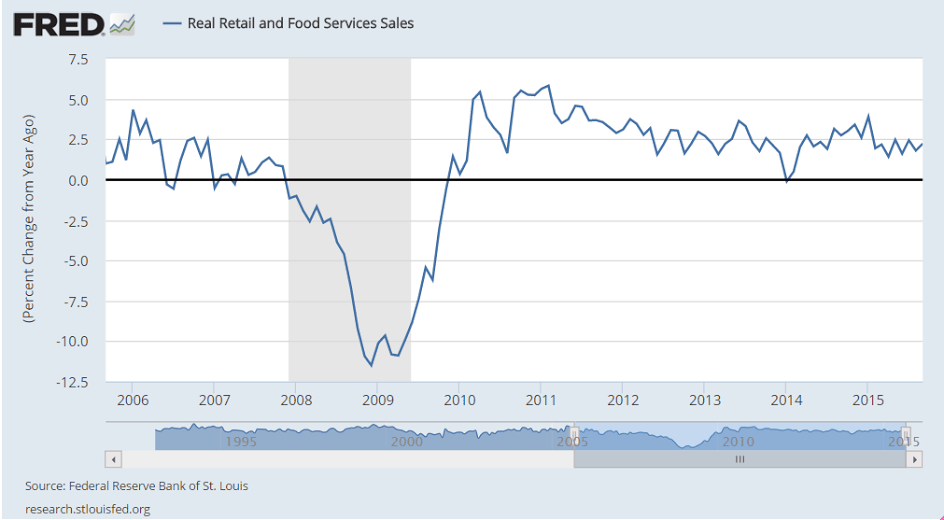
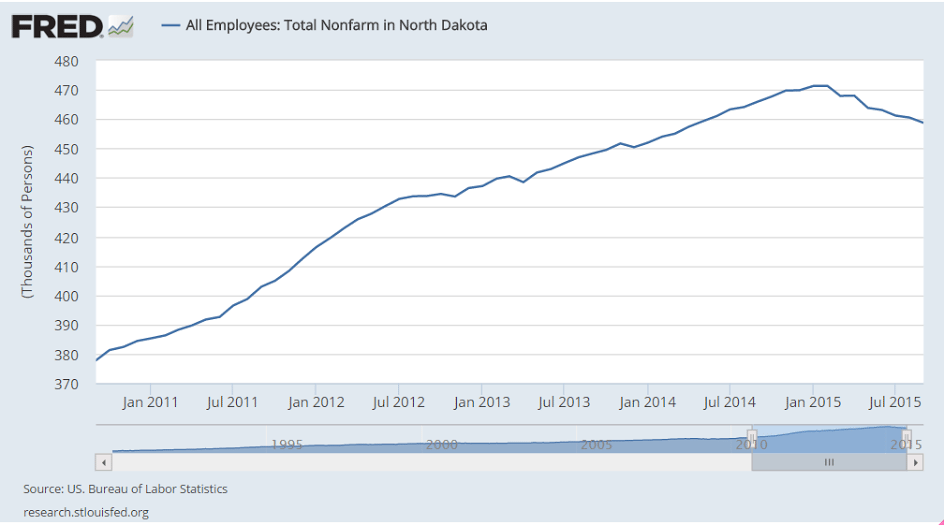
Still at recession type levels:
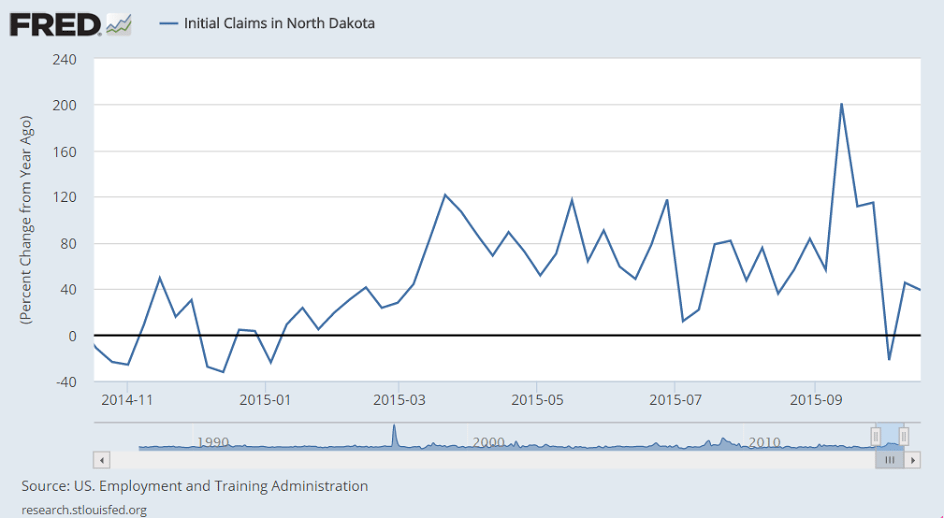
This is also what recession looks like:
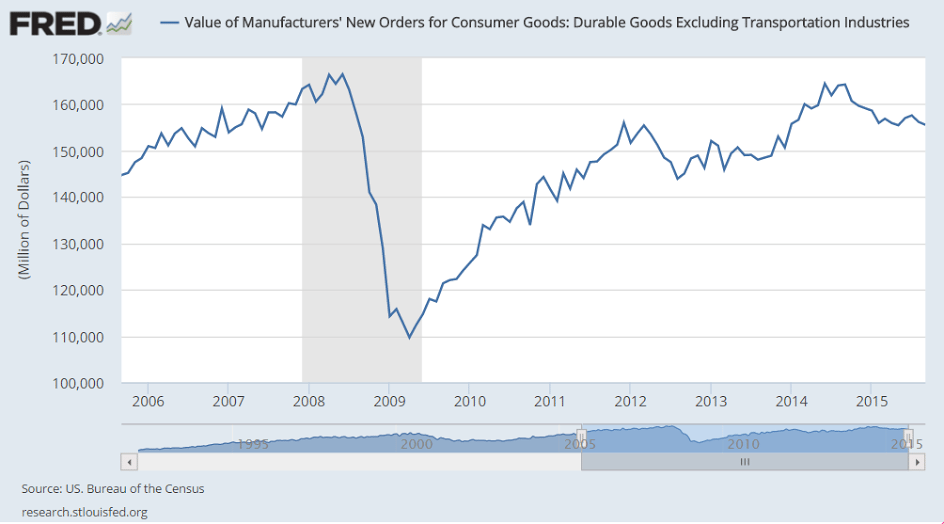
The anointed ‘driver of the economy’ continues to falter as previously discussed:
Housing Market Index
Highlights
The housing market index from the nation’s home builders shows weakness, at 62 for November and missing the Econoday consensus by 2 points. And compared to a revised October, the index is down 3 points. Yet readings in the report, though slowing, remain solid and one important detail is favorable.
Of the report’s three components, future sales are down a sizable 5 points but the level is still in the seventies, exactly at 70. Present sales, which is the most heavily weighted component, fell 3 points to 67, also still a strong level.
The positive in the report is a 1 point rise in traffic, a component which, at 48 in the latest report, has been lagging badly but is getting closer to the breakeven 50 mark. Weakness in this reading has been reflecting lack of first-time buyers in the market.
Turning to regional data, the highest composite score goes to the West, at an enormously strong 77, followed by the South, at 62. Two less watched regions for new homes, the Midwest and North, trail at 59 and 52.
There are positives in this report but the decline in both future and present sales is a reminder that both starts and permits for single-family homes have been slowing. Despite the rise in traffic, this report probably pulls back the housing outlook by a degree.
October 2015 Sea Container Counts Continue to Show Trade Recession Continues
By Steven Hansen
The data for this series continues to be in contraction. The year-to-date volumes are contracting for both exports and imports. The trade sector remains in a recession.
Federal agencies don’t need ‘capital’ to function.
This is simply unspent income that reduces aggregate demand:
FHA Meets Minimum Reserve Requirement for First Time Since 2009
(WSJ) — The Federal Housing Administration, which backs low-down-payment mortgages popular with first-time home buyers, said its insurance fund’s net worth at the end of September was $23.8 billion, up from a year-earlier level of $4.8 billion. Its capital reserve ratio, which by law is required to stay above 2%, rose to 2.07%, the first time it met the threshold since the start of the agency’s 2009 fiscal year. With the private subprime-mortgage market largely gone, the agency offers some of the easiest terms available, letting borrowers with a credit score as low as 580 make a down payment of as little as 3.5%.
Passenger car registrations: +8.2% over ten months; +2.9% in October
(ACEA) — In October 2015, the EU passenger car market continued its upward trend, despite a slower rate of increase (+2.9%), marking the 26th consecutive month of growth. Demand for new passenger cars saw momentum slowing down in all major markets. Registrations in Italy (+8.6%), Spain (+5.2%), Germany (+1.1%) and France (+1.0%) kept growing, even though less strong than in past months, while the UK market declined in October (-1.1%). Across the region, new passenger car registrations totalled 1,104,868 units, also supported by growth in the EU’s new member states (EU-12).
Can’t admit fiscal works and monetary doesn’t:
Abe to call for supplementary budget topping 3tn yen
(Nikkei) — Prime Minister Shinzo Abe will direct the Japanese government to put together a supplementary budget totaling more than 3 trillion yen ($24.2 billion) next week to help shore up a flagging economy. The government is set to compile measures to cope with the Trans-Pacific Partnership trade pact on Nov. 25 and steps for promoting active civic engagement on Nov. 26, with both to be incorporated into the extra budget for fiscal 2015. The prime minister declined to characterize the supplementary budget as a stimulus measure, since doing so could be seen as admitting defeat on Abenomics.
Capital spending delays took toll on July-September GDP
(Nikkei) —Weak capital investment led Japan’s economy to shrink by an annualized 0.8% in the three months ended September. A 1.3% drop in capital investment was the main cause of the decline. Corporations had planned to invest a good deal this fiscal year, though the follow-through has been lacking. Machinery orders, which typically lead capital investment by three to six months, slipped 10% for the July-September quarter. But if the outlook for economic growth overseas remains hazy, more companies could put investment on hold.

More deflation news here:
PPI-FD
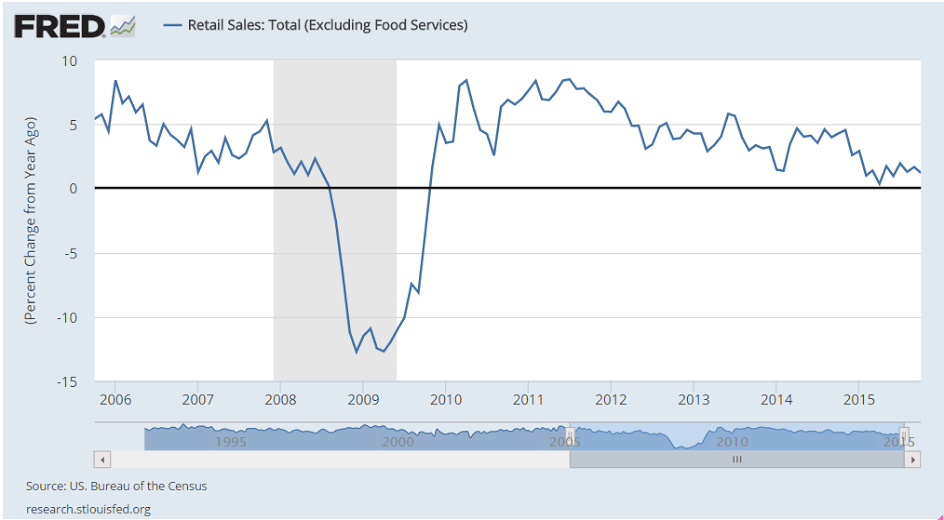
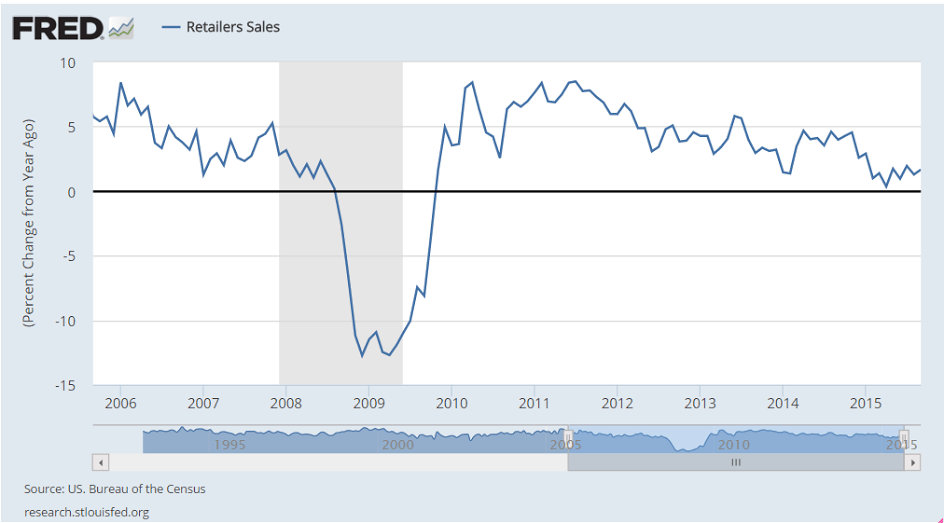
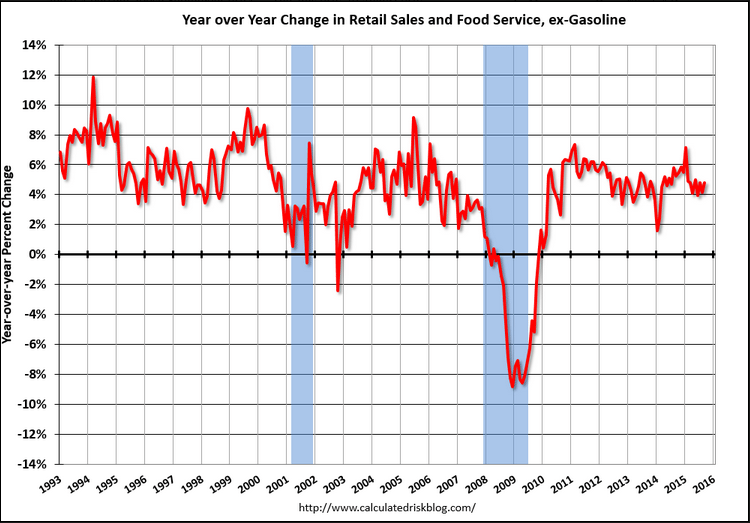
Nothing good here, and of course sales = income, so lower sales = lower incomes.
Also, the boost to prior months from car sales looks like it’s fading:
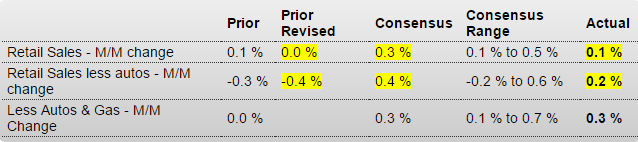
Retail Sales
Highlights
Retail sales slowed in October but fundamentally remain solid. Sales rose only 0.1 percent, 2 tenths under the Econoday consensus. But when excluding vehicles, which slipped back after surging in prior months, and when also excluding gasoline stations, where sales once again fell on price weakness, core sales rose a respectable 0.3 percent which hits the consensus.
And there are solid gains including for housing-related components of furniture & home furnishings and building materials & garden equipment. Nonstore retailers also show a strong gain as do restaurants.
Aside from vehicles and gas, other areas that declined are electronics & appliance stores, grocery stores, and the big category of general merchandise sales. Declines in the latter may be related to import-price effects which are deflating sales. A positive, however, is a gain for department stores which are a subset of general merchandise. Apparel sales, which are definitely being held down by import prices, were unchanged following two small declines.
Year-on-year rates really tell the story especially a respectable plus 4.1 percent rate for sales excluding gasoline stations, a component that is down 20.1 percent and has been badly skewing total sales all year. Total sales are up only 1.7 percent.
The headline is weak and year-on-year rates did ease off, including for core ex-auto ex-gas to plus 3.5 from 3.8 percent, but this report is better than it looks, showing underlying strength that shouldn’t scale down expectations for a December FOMC rate hike.
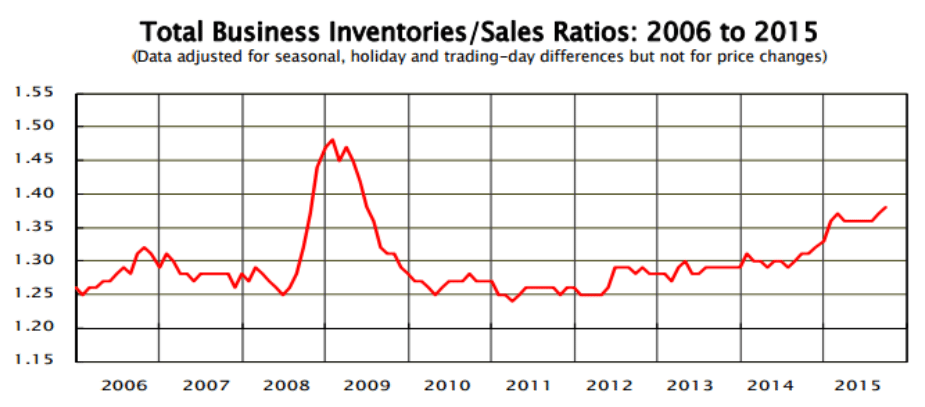
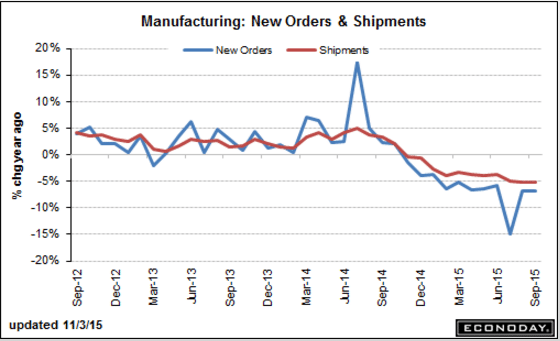
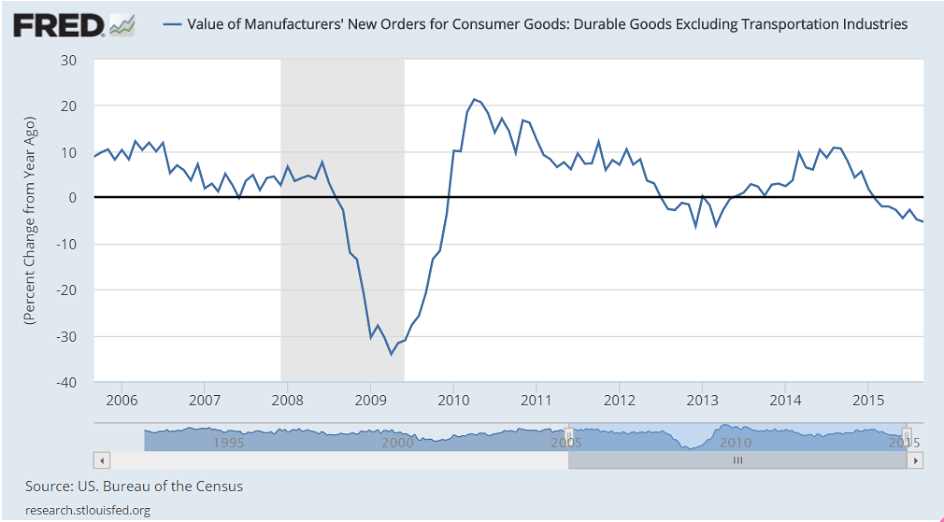
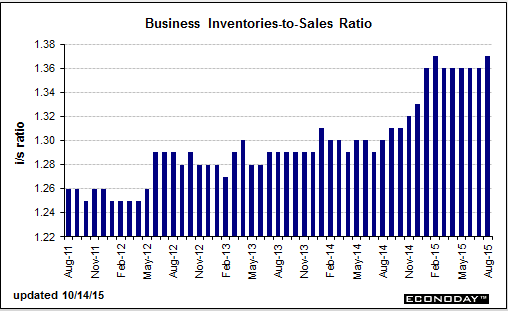
Looks to me like the excess inventory situation has gone from bad to worse, as sales continue to lag output:
MANUFACTURING AND TRADE INVENTORIES AND SALES September 2015 Sales.
The U.S. Census Bureau announced today that the combined value of distributive trade sales and manufacturers’ shipments for September, adjusted for seasonal and trading-day differences but not for price changes, was estimated at $1,320.3 billion, virtually unchanged (±0.2%)* from August 2015, but was down 2.8 percent (±0.4%) from September 2014.
Inventories.
Manufacturers’ and trade inventories, adjusted for seasonal variations but not for price changes, were estimated at an end-of-month level of $1,817.5 billion, up 0.3 percent (±0.1%) from August 2015 and were up 2.5 percent (±0.5%) from September 2014. Inventories/Sales Ratio.
The total business inventories/sales ratio based on seasonally adjusted data at the end of September was 1.38. The September 2014 ratio was 1.31.
Along with most indicators, this one turned south as oil capex collapsed:
Update: Framing Lumber Prices down Sharply Year-over-year
Here is another graph on framing lumber prices. Early in 2013 lumber prices came close to the housing bubble highs.
The price increases in early 2013 were due to a surge in demand (more housing starts) and supply constraints (framing lumber suppliers were working to bring more capacity online).
Prices didn’t increase as much early in 2014 (more supply, smaller “surge” in demand).
In 2015, even with the pickup in U.S. housing starts, prices are down year-over-year. Note: Multifamily starts do not use as much lumber as single family starts, and there was a surge in multi-family starts.

There were hopes that the last tic up was the beginning of a reversal but now seems the downtrend since the oil capex collapse may still be in progress:
The deflationary forces continue:
Import and Export Prices
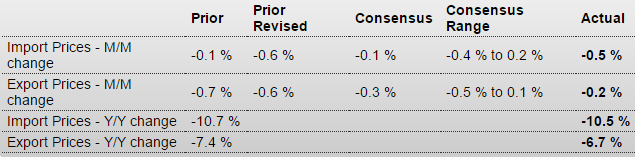
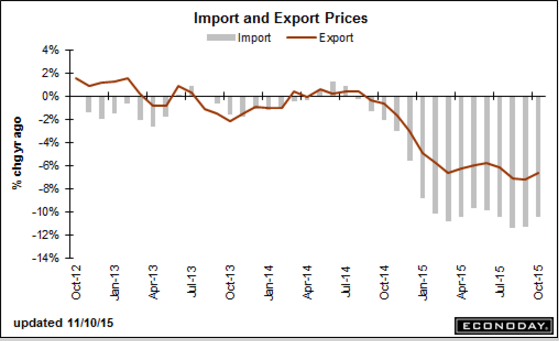
No sign of consumer strength here:
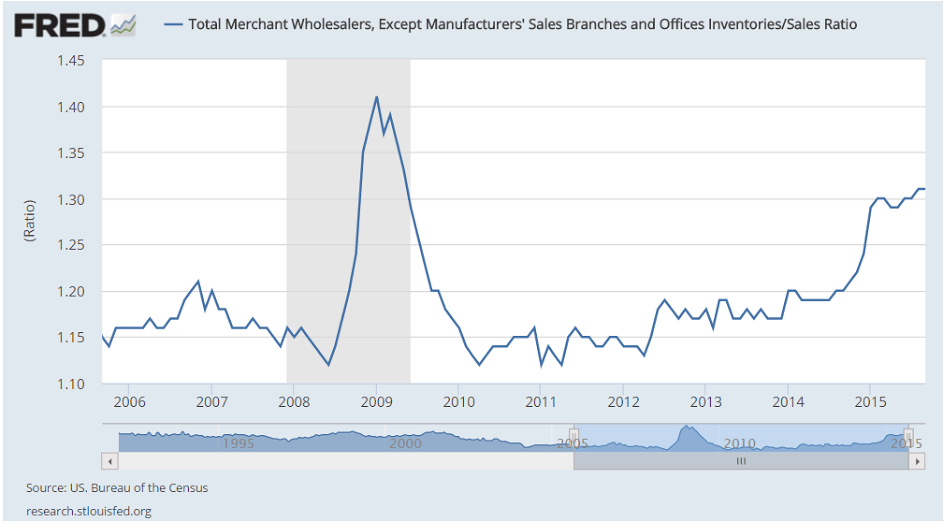
Inventories remain high going into Q4:
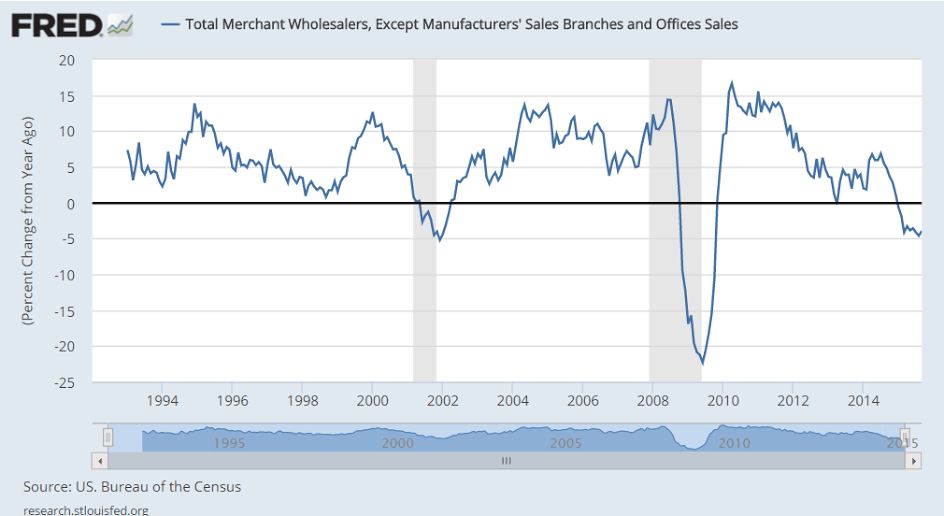
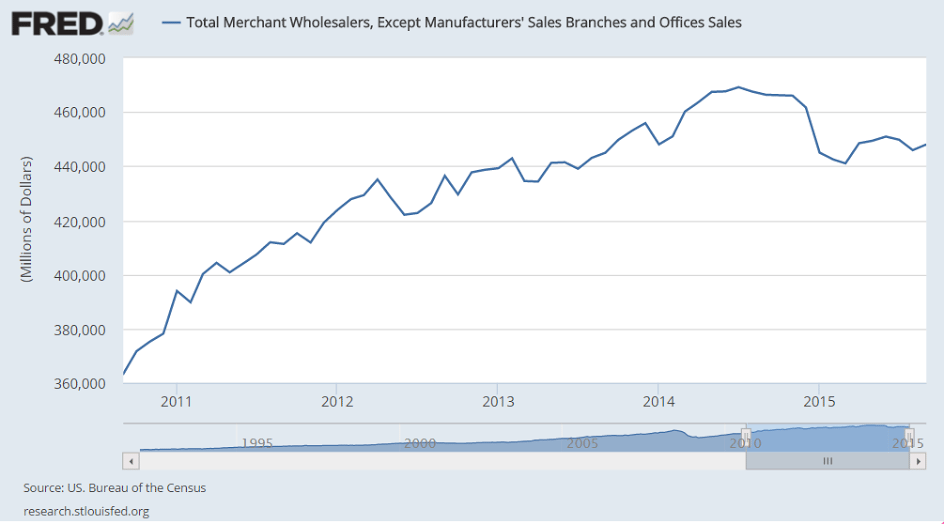
Wholesale Trade
Highlights
Wholesale inventories rose 0.5 percent in September following an upward revised 0.3 percent gain in August. The September build appears to be intentional based on a 0.5 percent rise in September sales that keeps the stock-to-sales ratio for wholesalers unchanged at 1.31.
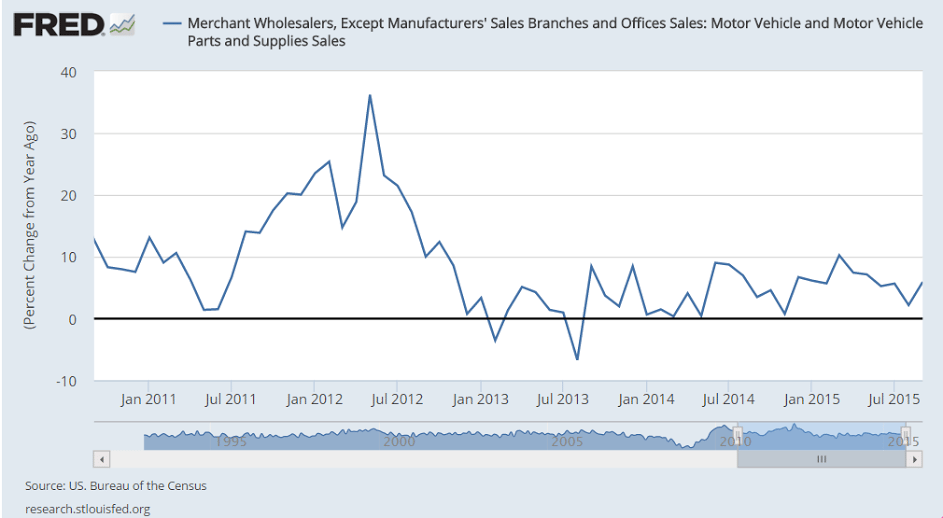
Inventories of autos rose 2.3 percent as wholesalers try to keep up with what is very strong retail demand for autos. Excluding autos, the stock-to-sales wholesale ratio is unchanged at 1.27.
Inventory draws reflecting gains in sales include computer equipment, electrical goods, and apparel. Wholesale inventories of furniture rose on a swing lower for sales.
Inventories in general are heavy and businesses, waiting for a pick up in sales, are being careful to keep them in check. Today’s results are in line with Commerce Department assumptions and should have little bearing on third-quarter GDP revisions. Watch Friday for the business inventories report which will include data from the retail sector.
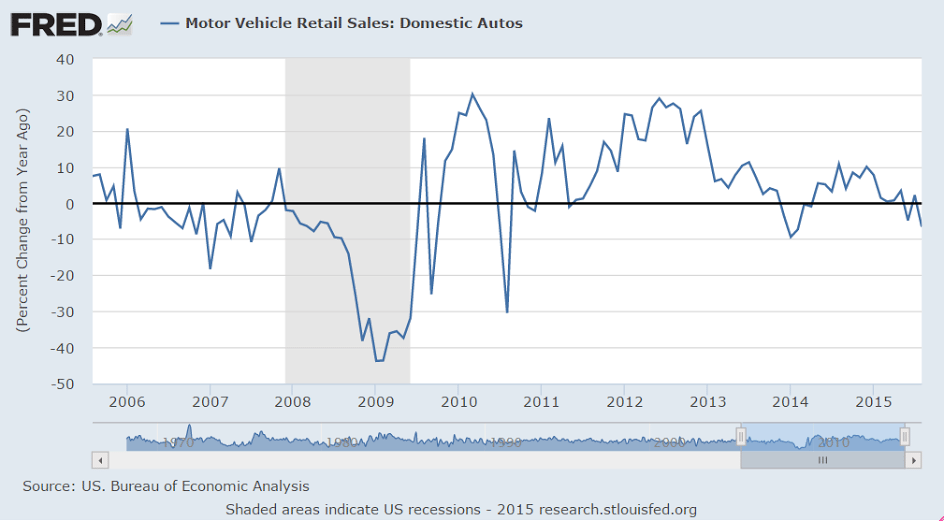
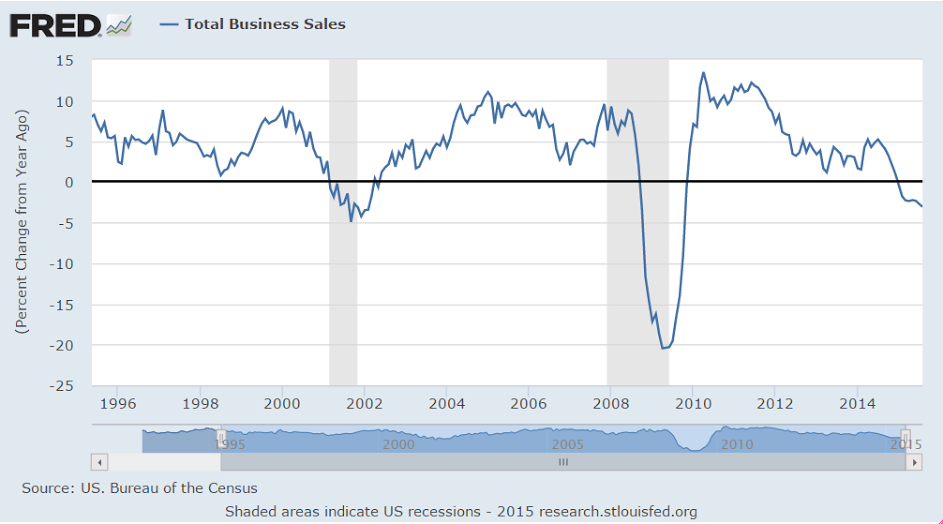
Sales looking like recession:
Autos are just holding their own:
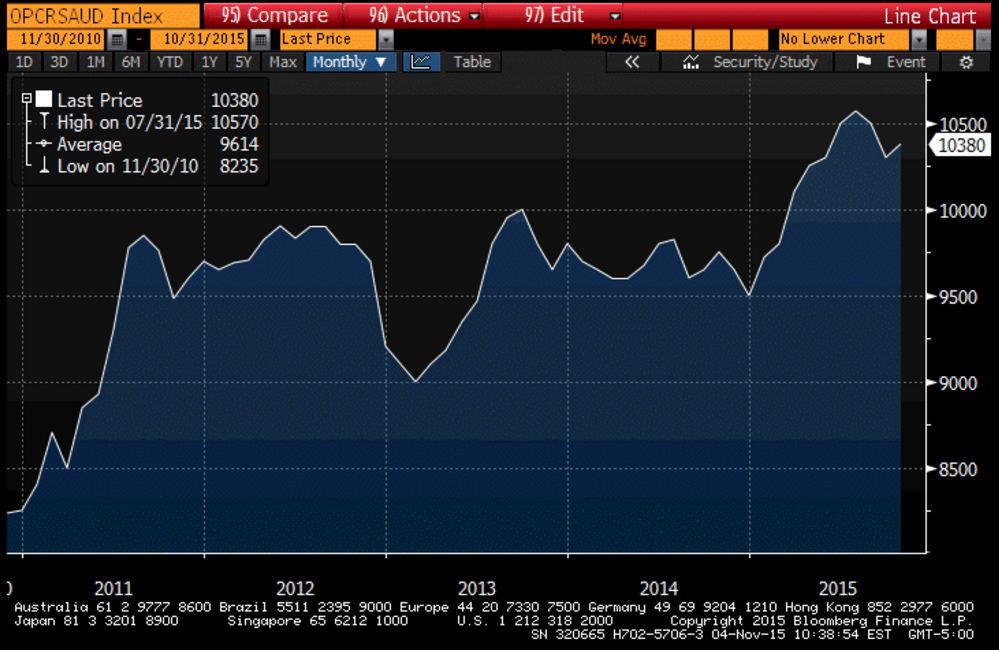
If the Saudis are looking to pump more seems they have to continue to lower prices:
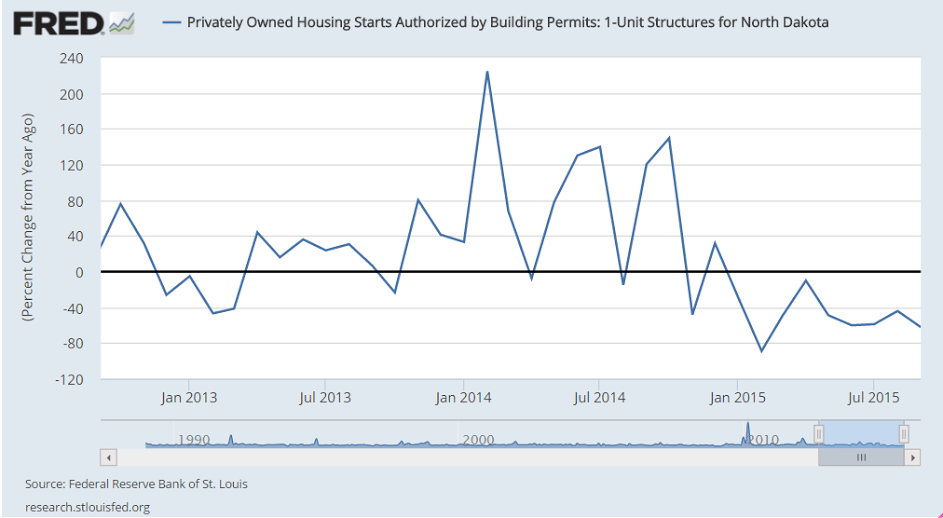
Sure looks like housing still can’t get out of its own way:
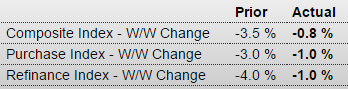
MBA Mortgage Applications
Highlights
Mortgage applications are settling down after spiking and dipping sharply in volatility tied to new disclosure rules put in place last month. Both the purchase and refinance indexes fell an incremental 1.0 percent in the October 30 week with the purchase index up a very solid 20 percent year-on-year. Rates were mixed in the week with the average 30-year fixed mortgage for conforming loans ($417,000 or lower) up 3 basis points to 4.01 percent.
NY ISM company specific business report:
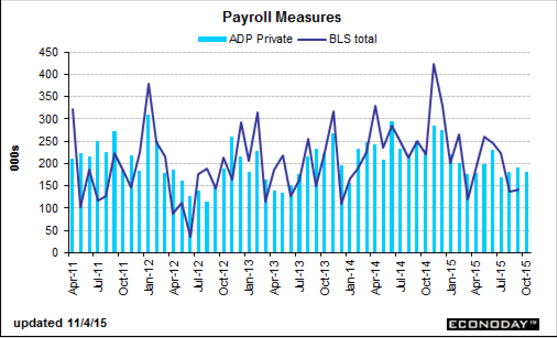
Still working it’s way lower. This is a forecast for Friday’s BLS payroll number:
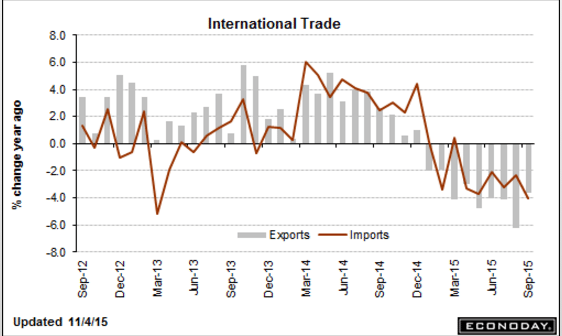
This is a September report. I expect a drop in exports for October and an increase in imports as oil imports increase in line with domestic production declines:
International Trade
Highlights
September’s trade deficit came in very near expectations, at $40.8 billion vs the Econoday estimate for $41.1 billion. August’s unusually large deficit is revised slightly lower to $48.0 billion. September’s goods gap came in at $60.3 billion vs last week’s advance estimate of $58.6 billion. This is offset in part by a $19.5 billion trade surplus in services that is slightly smaller than the August surplus.
Exports were solid in the month, up 1.6 percent and led by consumer goods that include artwork and jewelry. Exports of capital goods were also higher, all helping to offset a decline in exports of industrial supplies. Imports fell 1.8 percent with wide declines led by industrial supplies including crude oil followed by capital goods then autos.
The gain in exports is a positive of course and comes despite soft foreign demand which, for U.S. goods and services, is made softer by strength in the dollar. The dip in imports is good for the GDP calculation but isn’t a positive indication for domestic demand, especially given what is a favorable effect from the strong dollar.
PMI Services Index
Highlights
Growth in Markit’s U.S. service sector sample is slowing slightly, coming in at a final 54.8 vs the flash reading of 54.4 and vs September’s final reading of 55.1. Details are soft with growth in new business at its slowest pace since January and with backlogs down for a third straight month.
Weakness in orders in turn is pulling down 12-month expectations which are near July’s three-year low. Employment is described as modest with hiring at its slowest pace since February. Price readings are mute.
Despite the soft details, the service sector is still humming along solidly and helping to offset weakness in manufacturing.
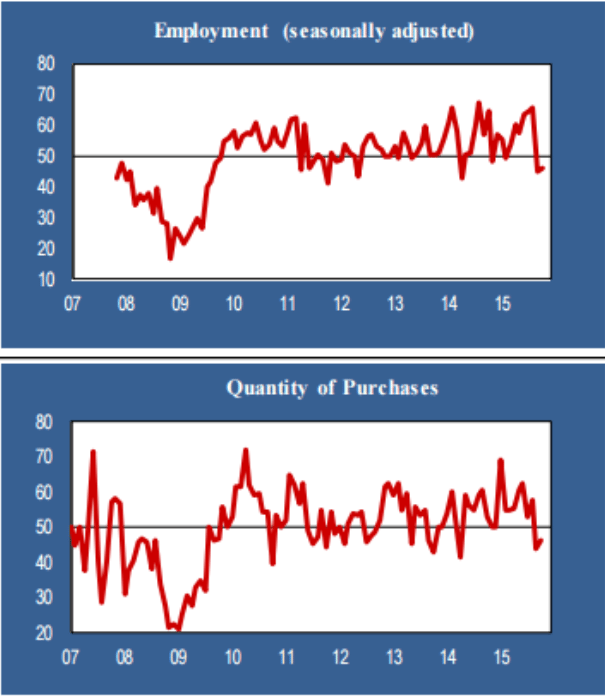
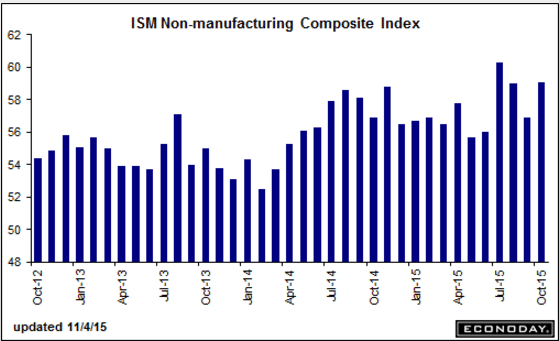
The overall weakness in the economy began with the oil price and oil capex collapse about a year ago, and while this indicator is off it’s July highs, it seems to be holding firm, at least for now:
ISM Non-Mfg Index
Highlights
ISM’s non-manufacturing index continues its searing pace, rising nearly 2-1/2 points to a much higher-than-expected 59.1 which exceeds Econoday’s high-end forecast by more than 1-1/2 points. Orders are robust with new orders up more than 5 points to 62.0 and backlogs unchanged at 54.5 which is very strong for this reading. Export orders are also strong, up 2 points to 54.5 and underscoring the strength of the nation’s services surplus as seen in this morning international trade report. But the highlight of the report, ahead of Friday’s employment data, is a nearly 1 point rise in the employment index to 59.2 which is one of the very strongest readings in the history of the report.
Strength is distributed broadly across industries led by transportation & warehousing, health care & social assistance, and professional, scientific & technical services, the latter a center of strength for foreign demand. The two non-service industries covered in this report are mixed with construction rising but mining, hit by low commodity prices, the only industry to report contraction in the month.
Many readings in this report are near records and follow similar readings in July and August which were also unusually strong. This report has been a consistent upside outlier but it undeniably hints at strength for employment and at a December FOMC rate hike.
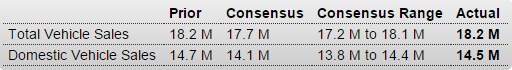
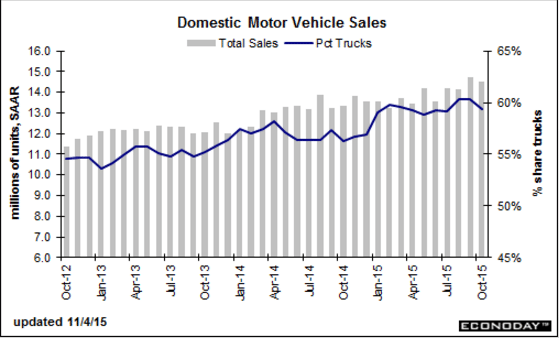
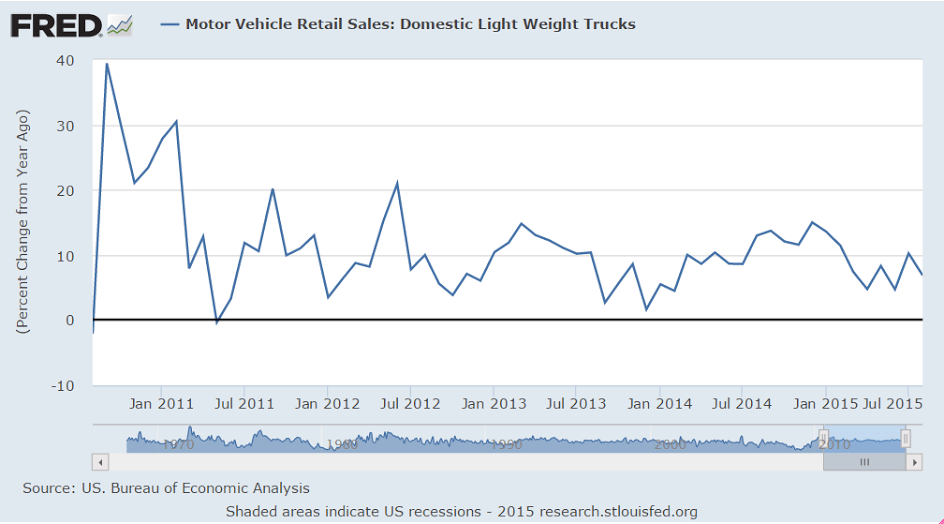
Good sales month but check out the import numbers, which don’t count for GDP:
Motor Vehicle Sales
Highlights
Consumers really showed up in October, at least when it came to dealerships as vehicle sales held unchanged at an 18.2 million annual rate, a 12-year high and outside the Econoday top-end estimate. Import sales, specifically sales of imported light trucks, were the key to October, rising to a 3.7 million rate from 3.5 million and making up for a downtick in sales of North American-made vehicles which slipped to 14.5 from 14.7 million. Still, the 14.5 million rate is also outside the top-end estimate.These data offer convincing evidence of consumer strength and pull forward, at least to a degree, the Fed’s rate liftoff. But the results, because they do no better than match September, do not quite point to a third straight gain for the motor vehicle component of the October retail sales report.
Domestic sales fell some:
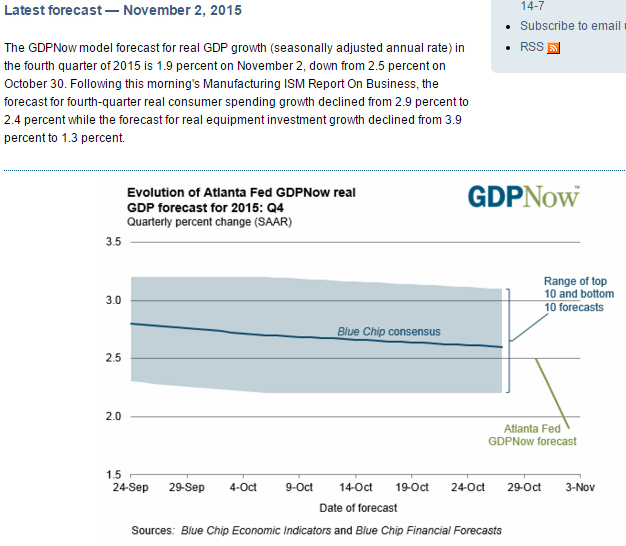
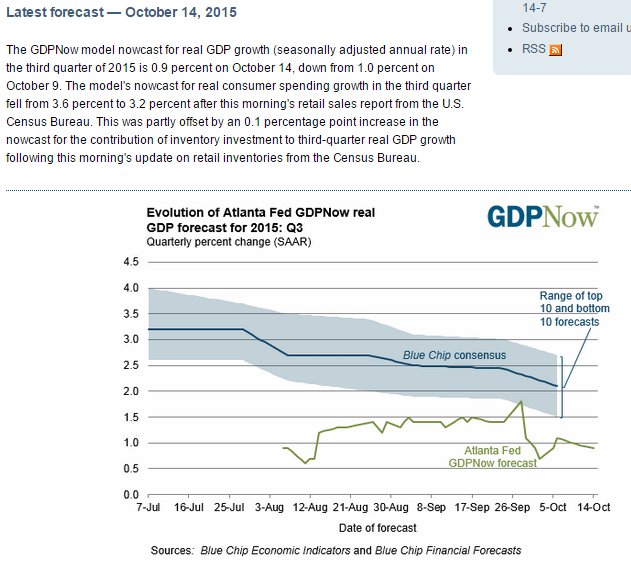
Down to 1.9 for Q4, after being very close for Q1, Q2 and Q3:
German Engineering Orders Hit by Lower Demand From China
By Nina Adam
Nov 2 (WSJ) — Germany’s VDMA engineering federation said Monday that its “plant and machinery makers are battling against global markets’ adversities.” German mechanical engineering orders slumped 13% year-over-year in September, hit by a 18% drop in foreign demand. Foreign orders from outside the eurozone were down 7% in the nine months through September from the same period a year earlier. “Companies are feeling the pinch from turbulences in China, which are also affecting other key developing markets,” said Olaf Wortmann, an economist at VDMA, which represents more than 3,000 midsize companies.

![]()
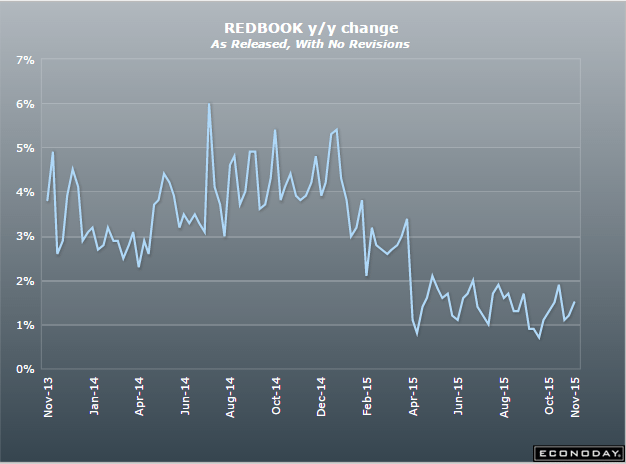
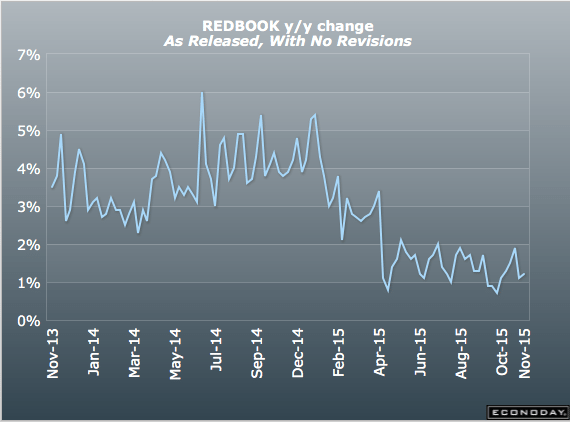
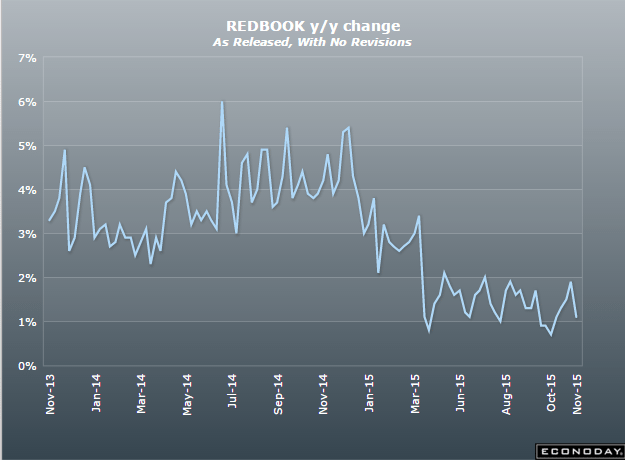
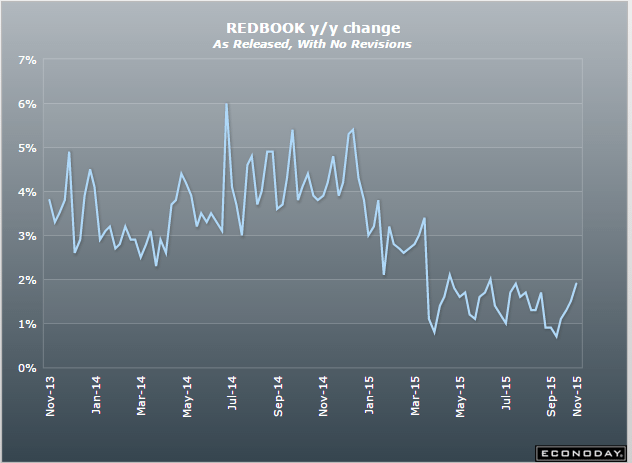
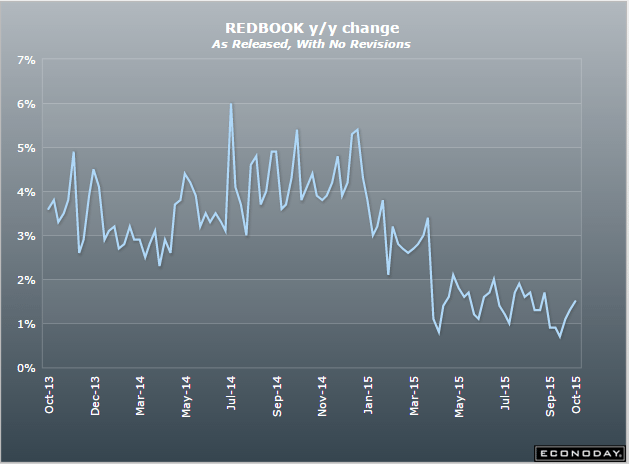
Still depressed but a hopeful forecast, though not long ago 2.8% year over year growth would have been considered low:
Redbook
Redbook’s same-store sales tally has been climbing, up 4 tenths in the October 31 to a year-on-year plus 1.9 percent. But the report’s commentary is mixed, saying some retailers benefited from Halloween shopping though it said the fact that Halloween fell on Saturday actually kept shoppers out of stores on Halloween itself. The report’s month-to-month reading shows no meaningful change against September. But the report’s outlook for the key shopping month of November is very strong, forecasting 2.8 percent year-on-year same-store sales growth for the month.
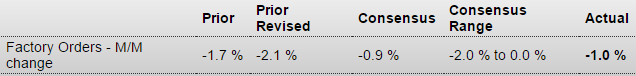
Bad, worse then expected, and prior month revised lower as well:
Factory Orders
Highlights
New orders for the export-hit factory sector fell 1.0 percent in September for the 11th decline in 14 months. Orders for durable goods, initially posted in last week’s advance report, are unrevised at minus 1.2 percent, held down in part by a downswing in civilian aircraft but nevertheless showing wide weakness. Orders for non-durable goods, pulled down by weakness for petroleum and coal products, fell 0.8 percent to extend a run of sizable declines going back to July. The factory sector has been struggling with weakness in the energy sector and especially weak foreign demand that for U.S. goods has been made weaker by the strength in the dollar.
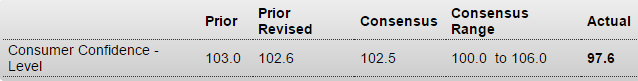
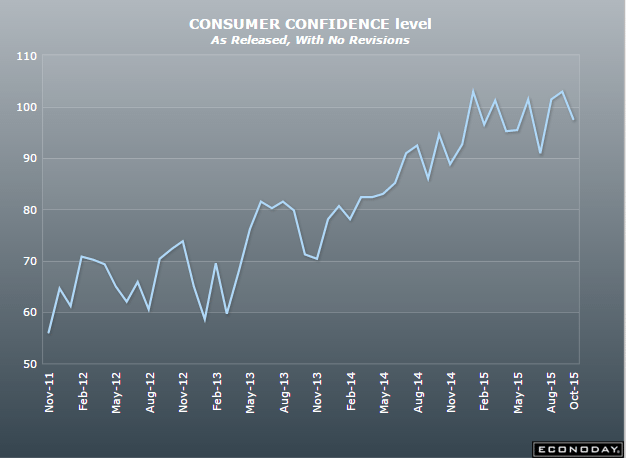
A lot less than expected based on jobs assessment, and note the drop in car buying plans:
United States : Consumer Confidence
Highlights
A decline in the assessment of the current jobs market pulled down the consumer confidence index to a lower-than-expected 97.6 in October. This is about 2.4 points below Econoday’s low-end forecast and 5.0 points below a revised September.
Consumers are saying there are fewer jobs available then there were in September and more say jobs are hard to get. But the latter reading, at 25.8 percent, is still low and consistent with low rates of unemployment. Still, these readings are weaker than September and helped pull down the present situation component by a sizable 8.2 points to 112.1.
The six-month outlook shows much less monthly weakness compared to September with the component down 2.8 points to 88.0. Buying plans are mixed with cars down but both houses and appliances up. Inflation expectations are steady at 5.1 percent which is moderate for this reading.
Jobs are at the heart of consumer confidence and today’s report will limit expectations for strength in the October employment report. This report may also limit expectations for retail sales in October including, based on buying plans, sales of vehicles.
United States : Richmond Fed Manufacturing Index
Highlights
The Richmond Fed makes it five for five, that is five regional Fed reports all showing negative headlines for October. The Richmond Fed index did improve, however, to minus 1 from September’s minus 5. New orders came in at zero following the prior month’s steep contraction of minus 12. But backlog orders, at minus 7, are down for a third month which is not a plus for future shipments or employment. Shipments in October fell to minus 4 from minus 3 which is also a third month of contraction. Hiring is still positive, unchanged at plus 3, but continued growth here is uncertain. Price data are mute with prices received showing slight contraction as they are in other reports. This morning’s report on durable goods orders showed another month of broad weakness in September and this report, together with the other regional reports, point to another weak month for the factory sector in October.
United States : PMI Services Flash
Highlights
Growth in the nation’s service sector is solid but a little slower this month than in September. The services PMI flash for October came in at 54.4 for the slowest rate of growth since the severe weather of January. The report cites a third straight slowdown in new business which is also at its weakest point since January. Though the service sector is insulated to a degree from foreign effects, the report does note that less favorable global conditions are making customers less willing to spend.
Backlogs are down for a third month which is the worst run in two years and hiring has slowed to the weakest level since February. The outlook, though still favorable, is near a three-year low. Price data show little change for inputs and only a fractional gain for prices charged. This report fits in with the general soft tone of economic data, softness that will perhaps be a key focus of tomorrow’s FOMC statement.
Last I checked this ‘counts’ as ‘personal consumption expenditure’:
Premiums for Health Insurance Bought on Exchanges to Climb in 2016
Oct 26 (WSJ) — The Obama administration said many consumers will see noticeable premium increases when buying health coverage on insurance exchanges in 2016. Federal officials said Monday that the price of the second-lowest-cost midrange “silver plan”—a key metric for premiums around the country—will increase by 7.5% on average across the three-dozen states that rely on Washington to administer the health law for them. And 60% of enrollees—across 30 of the largest markets in the U.S.—will see the average rate for that benchmark plan rise by 6.3%.
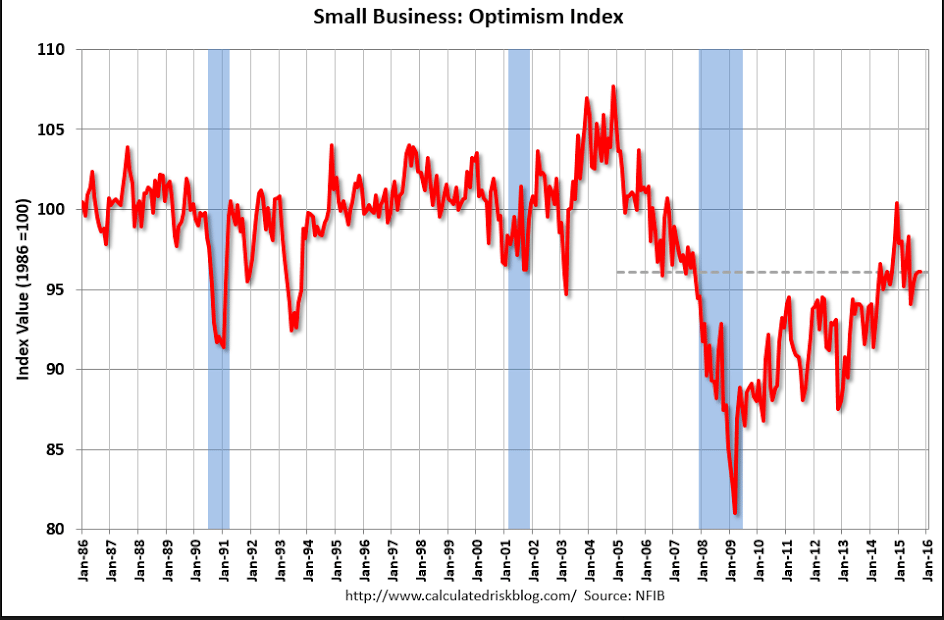
Also decelerating since oil prices collapsed:
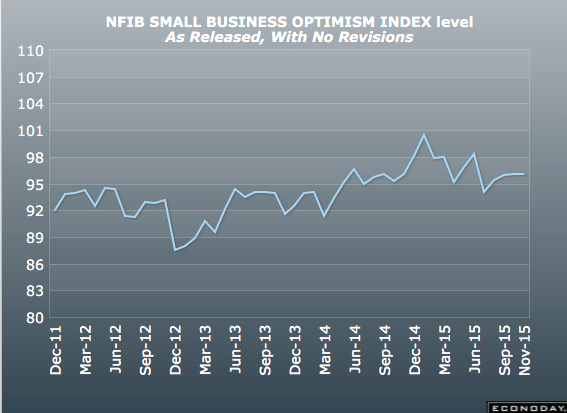
Up off the bottom some but no where near enough to levels historically coincident with lower unemployment, etc:

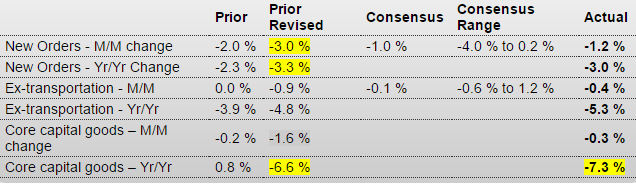
Bad and the prior month revised down, and with employment growth slipping motor vehicles could be hit next:
United States : Durable Goods Orders
Highlights
The factory sector is showing cracks with orders contracting slightly more than expected, down 1.2 percent in September with August’s contraction revised lower to minus 3.0 percent. Other readings are likewise weak with ex-transportation down 0.4 percent following a downward revised 0.9 percent decline in August and with core capital goods orders down 0.3 percent after falling a downward revised 1.6 percent in August.
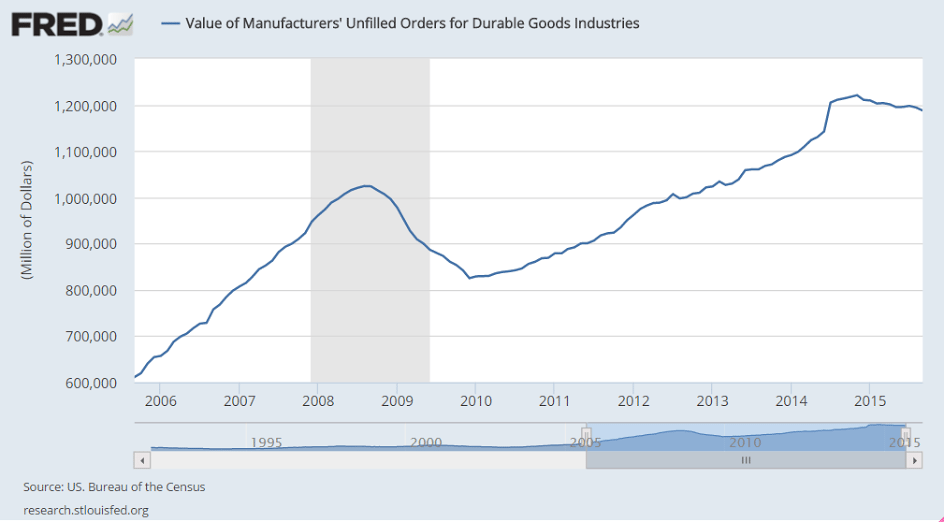
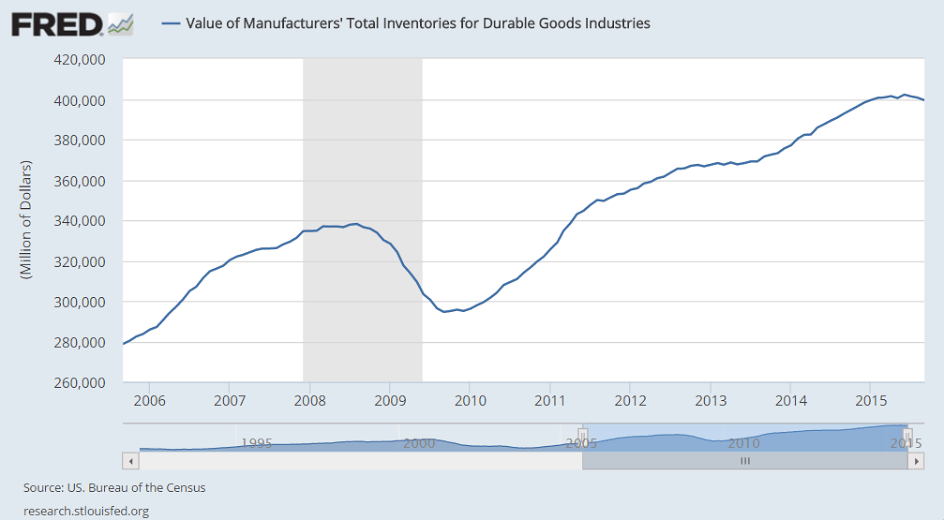
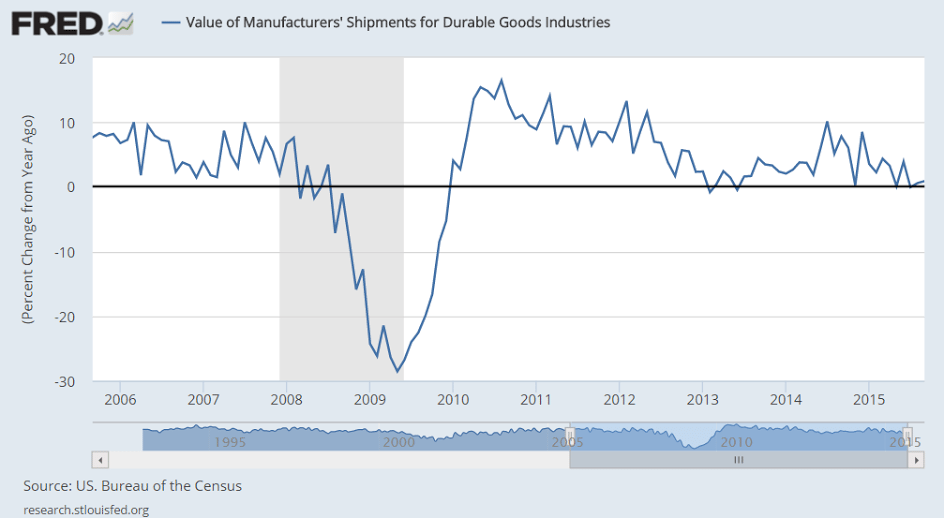
Other readings include a second straight and sharp 0.6 percent decline in unfilled orders and a third straight decline in inventories, down 0.3 percent which is the sharpest decline since May 2013. The decline in unfilled orders suggests that factories, lacking new orders, are working down backlogs while the decline in inventories points to growing caution in the business outlook. But factories are keeping up shipments which is good for GDP, up 0.2 percent after August’s 0.5 percent decline with core capital goods shipments up 0.5 percent after a 0.8 percent decline.
Motor vehicles are a positive in the report, showing a 1.8 percent gain in new orders and a 1.6 percent gain in shipments with both reversing similar sized declines in August. Also positive are electrical equipment and fabricated metals, with both perhaps getting a boost from construction, along with defense aircraft and defense capital goods.
Industries showing declines in new orders include primary metals, machinery, and computers & electronics. Orders for civilian aircraft fell 62 percent in September following a 23 percent decline in August.
This report falls in line with industrial production data where manufacturing in September slipped for the fourth time in five months. Weakness in exports is the balancing factor tipping the factory sector away from growth.
Redbook retail sales still growing at depressed rates:
Price continues to fall as the increased Saudi discounts continue:
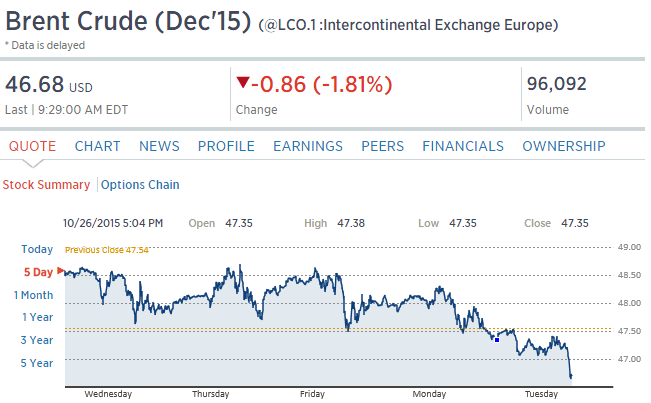
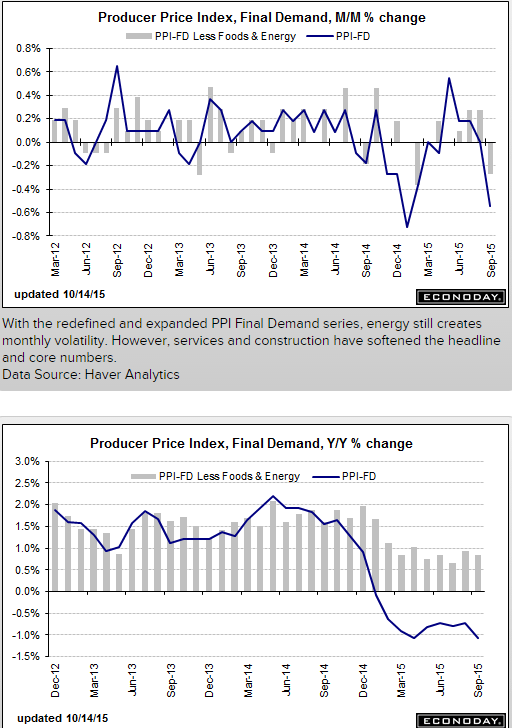
Gives the Fed another dovish data point:
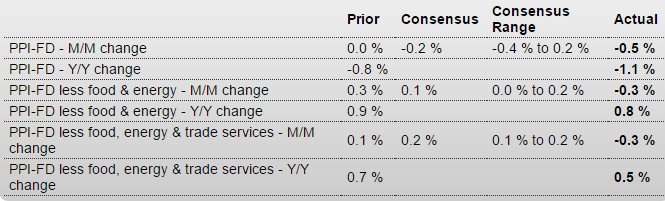
PPI-FD
Highlights
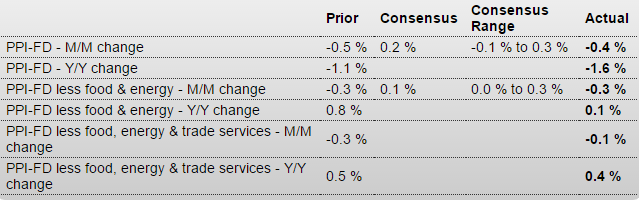
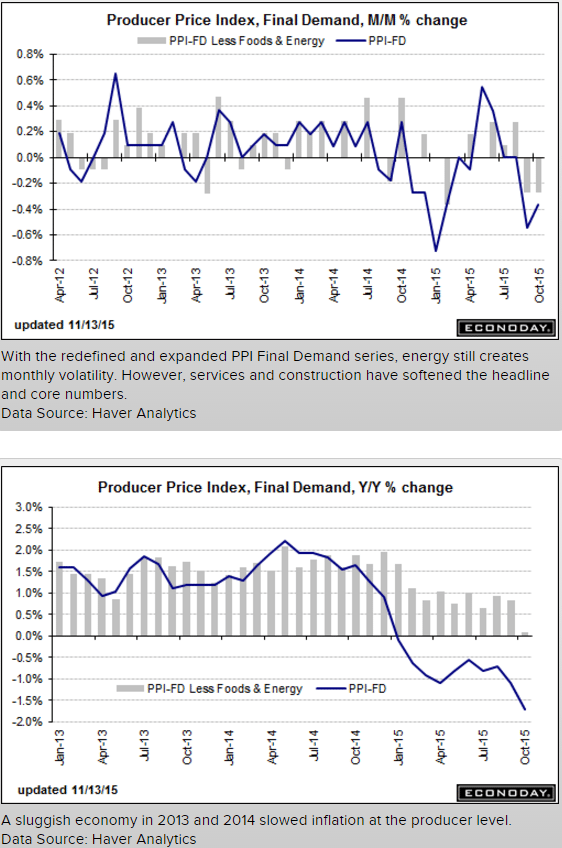
Producer prices show wide weakness and may raise talk that deflationary pressures are building, not easing. The PPI-FD fell 0.5 percent in September which is just below Econoday’s low estimate for minus 0.4. Year-on-year, producer prices are falling deeper into the negative column at minus 1.1 percent. And it’s not all due to energy excluding which and also excluding food, prices fell 0.3 percent though the year-on-year rate is still in the plus column, at plus 0.8 percent but down 1 tenth from August. Excluding food, energy and services, where the latter had been showing price traction, prices still fell 0.3 percent with the year-on-year rate at only plus 0.5 percent.
The services weakness, down 0.4 percent in the month, follows two prior gains of 0.4 percent that had been cited as evidence of resilience in domestic demand. Exports remain very weak at minus 0.8 percent in the month following August’s 0.4 percent decline. September energy prices fell 5.9 percent and are down 23.7 percent year-on-year. Gasoline fell a monthly 16.6 percent for a 42.8 percent year-on-year decline.
Other readings include a 1.3 percent decline for finished goods where the year-on-year rate, following a long string of monthly declines, is down 4.1 percent. This is an important reading that points to pass through of low raw material prices.
Hawks at the Fed are saying that the negative price effects from oil and low import prices will prove temporary. That may be, but the depth of ongoing price weakness continues to sink. Watch for the consumer price report on tomorrow’s calendar.
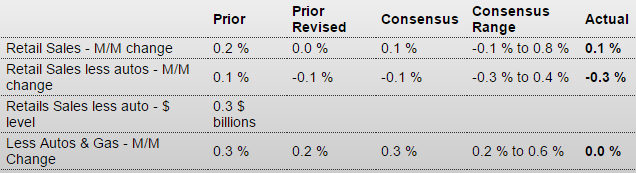
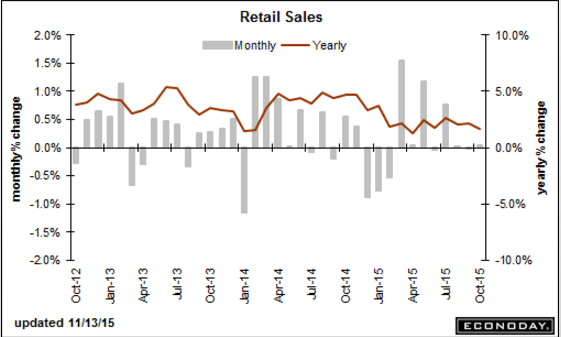
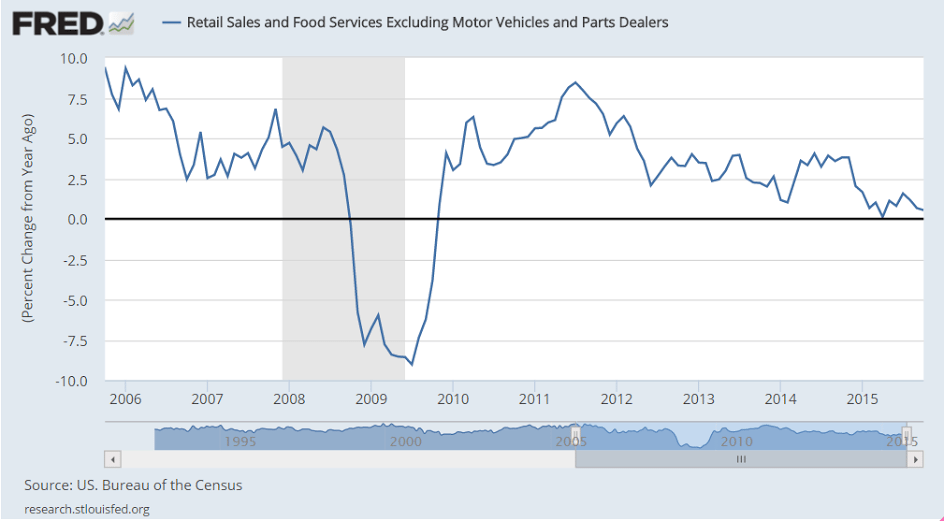
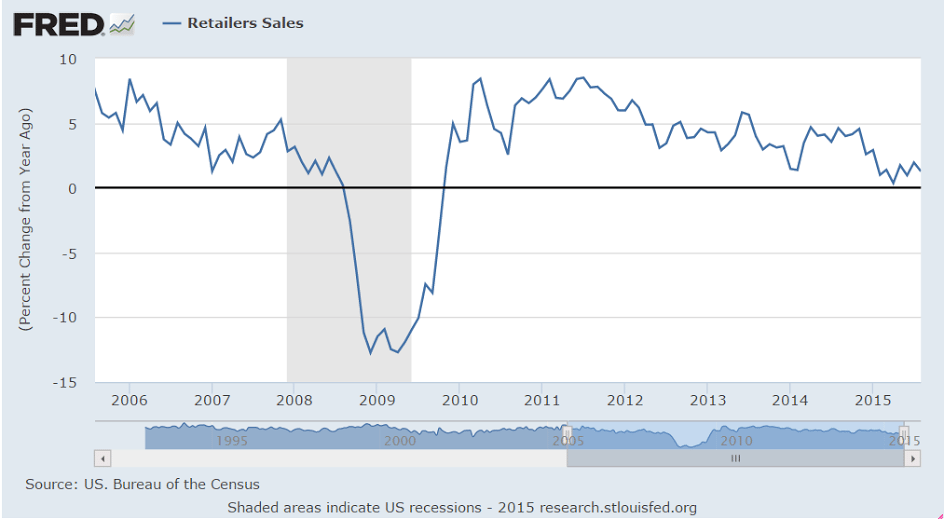
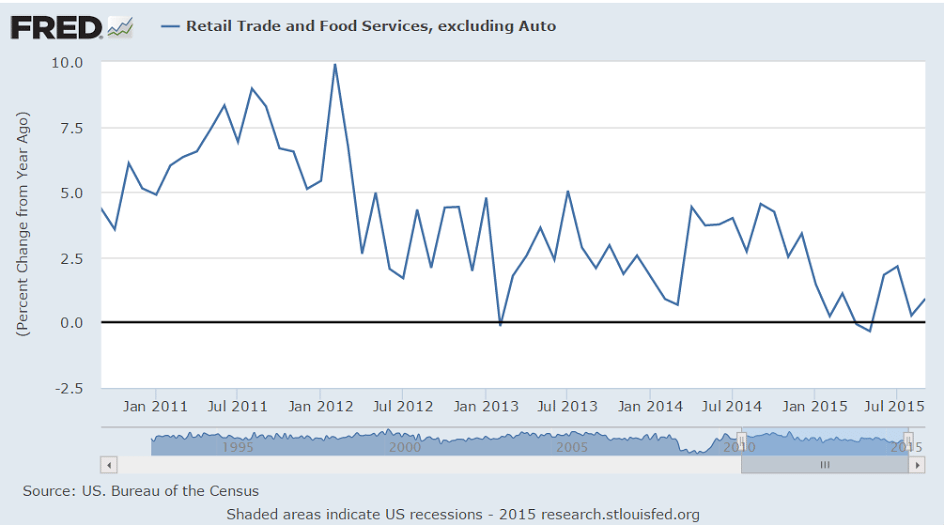
This continues to disappoint, no matter how they try to spin it. And total sales do count, as they are also the total income for the sellers, so that’s been slowing as well:
Retail Sales
Highlights
Weakness at gasoline stations, where low prices are depressing sales totals, continues to exaggerate weakness in retail sales where the headline inched only 0.1 percent higher in September. Gasoline sales fell 3.2 percent in the month, excluding which the headline looks far more respectable at plus 0.4 percent.
And there are plenty of tangible positives in the data including a third straight solid gain for motor vehicles, at plus 1.7 percent in September, and a second straight outsized gain of 0.9 percent for restaurants. Both of these are discretionary categories and point to underlying consumer strength. Clothing stores are also posting strong gains, up 0.9 percent despite negative price effects from lower import prices.
Price weakness is not only pulling down gasoline sales but also sales at food & beverage stores which fell 0.3 percent. But there are signs of consumer retracement in the September report with the general merchandise category, which is very large, down 0.1 percent, and with health & personal care stores unchanged. Building materials fell 0.3 percent with electronics & appliance stores down 0.2 percent.
Looking at adjusted year-on-year rates helps clarify the trends. Excluding gasoline stations, retail sales are up a very respectable 4.9 percent which is well above the less impressive 2.4 percent gain for total sales. Sales at gasoline stations are down a year-on-year 19.7 percent. Leading the positive side are motor vehicles, up 8.8 percent, and restaurants, up 7.9 percent — both robust gains. Core sales, that is ex-auto ex-gas, the year-on-year rate is a moderate plus 3.8 percent for a 1 tenth decline from August.
One of the very biggest positives for the consumer right now, aside from strength in labor demand, is the weakness in pump prices, which however in this report, where dollar totals are tracked and not sales volumes, turns into a negative. Still, the headline is weak and will likely lower third-quarter GDP estimates — but for Fed policy, because the weakness is skewed due to gas prices, the results are harder to assess and may prove neutral.
Imports have a much lesser effect on the economy:
This is where the domestic growth has been, which has been about the same growth rate for the last few years:
And even this is low vs prior cycles:
Yet another big negative here. Again, it’s the same unspent income story. If agents spent less than their incomes others must have spent more than their incomes or inventory went unsold, which is exactly what’s been happening. And unsold inventory = cuts in output and employment = less income = less spending etc. until some agent starts spending that much more than his income. Most often that’s govt, spending more than its income (deficit spending) on rising unemployment benefits, and experiencing reduced tax revenues in the slow down:
Business Inventories
Highlights
There’s evidence of economic weakness coming from inventory data where inventories are being kept down but are still building relative to sales. Business inventories were unchanged for a second month in August while sales fell a sizable 0.6 percent, driving up the inventory-to-sales ratio to 1.37 from 1.36.
Inventory downscaling is underway in manufacturing which is being hurt by weak exports. Manufacturing inventories fell 0.3 percent in both August and July against a major sales decline of 0.7 percent in August and a 0.2 percent dip in July. There’s less inventory downscaling, at least right now, among wholesalers where inventories rose 0.1 percent but sales at wholesalers are even weaker, down 1.0 percent in the month. Retail, the third component, is not immune with sales down 0.1 percent but inventories up 0.3 percent.
Inventories are looking heavy which could limit production and employment growth and could emerge as a new concern for the doves at the Fed.
Revised down again:
Applying leverage here is, functionally, subversive:
McConnell’s Last Stand: He Wants Medicare, Social Security Cuts to Raise Debt Limit
By Rob Garver
Oct 13 (Fiscal Times) — In case anyone thought things couldn’t get more chaotic on Capitol Hill, Senate Majority Mitch McConnell appears ready to set them straight. McConnell, according to a report first published by CNN, plans to make several major demands of the White House, including changes to Medicare, Social Security, and EPA regulations as his price for raising the nation’s debt limit.